
Abstract
Hearing threshold levels (HTLs) at 500–8,000 Hz from the National Health and Nutrition Examination Survey (NHANES) 2011–2012, 2015–2016, and 2017–2020 were analyzed for males and females ranging in age from 20 to 80-plus years (N = 8,795). HTLs for the 10th, 25th, 50th, 75th, and 90th percentiles are provided for males and females. Equations were generated to describe median HTLs as a function of age at each frequency. The medians generated for this unscreened dataset of U.S. adults were compared to those in Table B.3 of ISO 1999 (2013), which came from analyses of the NHANES 1999–2006 datasets. The ISO 1999 values were found to be slightly higher (worse) at several frequencies. The ISO 1999 (2013) median HTLs were 2 to 5 dB worse at 500 Hz for males and females and 2 to 8 dB worse at 4,000 and 6,000 Hz for males than the updated NHANES estimates. As in prior analyses of NHANES data, HTLs worsened with age, were better for females than males, and were better for Non-Hispanic Blacks than for Non-Hispanic Whites. The latter difference was observed for both males and females, was confined to frequencies above 2,000 Hz, and widened with increasing age.
Keywords
Introduction
Prior studies of hearing loss in U.S. adults include cross-sectional population-based studies from specific areas of the country, such as the Framingham Cohort in Framingham, Massachusetts (e.g., Gates et al., 1990; Mościcki et al., 1985) and the Epidemiology of Hearing Loss Study (EHLS) in Beaver Dam, Wisconsin (e.g., Cruickshanks et al., 1998, Zhan & Zhong, 2010), single-site longitudinal studies, such as the EHLS and the Baltimore Longitudinal Study on Ageing (e.g., Lin, Metter, et al., 2011), multi-site longitudinal studies, such as the Health ABC Study (e.g., Deal et al., 2017; Lin et al., 2013), and nation-wide cross-sectional studies with complex sample designs targeting representation of the entire U.S. population (e.g., Agrawal et al., 2008, 2009; Lin, Niparko, et al., 2011). Unquestionably, the most well-known and established studies of the last type are the long-running National Health and Nutrition Examination Surveys (NHANES) administered under the auspices of the Center for Disease Control and Prevention (CDC) and overseen by the National Center for Health Statistics (NCHS).
For the NHANES data, inclusion of audiometric testing dates to NHANES I, completed from 1971 to 1975, with the data for this survey being released to the public on data tapes in 1989. It should be noted, however, that national collection of audiometric data took place in the 1960s in the US as a part of the National Health Examination Survey (NHES), a predecessor to NHANES. In 1999, the design and operations for NHANES changed such that from thenceforward it would be an annual rather than periodic survey of the noninstitutionalized civilian population of the U.S. Each calendar year since 1999, a nationally representative sample of the US population has been interviewed and examined. To stabilize the variance estimates from the data, as well as to protect the anonymity of participants and to expedite release of the data for analyses, the NCHS opted to release the NHANES data in 2-year cycles. This annual collection and biennial release of data has continued since 1999, although the coronavirus pandemic in 2019 resulted in the suspension of the 2019–2020 cycle. The most recent publicly released audiometric data were gathered during the 2017–2018 and the 2019–2020 cycles, with the data from 2017 through March 2020 combined into a single dataset, NHANES 2017–2020.
Data on hearing threshold levels (HTLs) from NHANES were published previously for 1999–2006 (Agrawal et al., 2008; Hoffman et al., 2010, 2012), 2001–2008 (Lin et al., 2011) and most recently for 2011–2012 (Hoffman et al., 2017). The results of the analyses of the 1999–2006 data by Hoffman et al. (2010) formed the basis for the normative HTLs for unscreened U.S. adults included in the most recent edition of ISO standard 1999 (2013), “Acoustics-Estimation of noise-induced hearing loss.” Table B.3 of Annex B in this ISO standard provides the 10th, 50th and 90th percentiles for HTLs from 500 to 8,000 Hz for unscreened U.S. males and females for age decades centered at 30, 40, 50, 60, and 70 years. ISO 1999 (2013), and its earlier editions, have been used frequently in a variety of contexts from research to public policy to disability claims to estimate noise-induced hearing loss and to attempt to parse out the contributions of age and noise for a given set of audiometric thresholds. As noted by Hoffman et al. (2017), more recent generations appear to have better hearing than those upon which the current ISO 1990 (2013) Annex B values are based. The present analyses were conducted, in part, to provide the most recent estimates of the HTLs of unscreened U.S. adults and to compare those estimates to the values included in Annex B of ISO 1999 (2013).
Age and sex have long been recognized as predominant factors affecting hearing. ISO 7029 (2017) presents equations to estimate the hearing thresholds for “otologically normal adults” of various ages, separately for males and females. ISO 7029 defines “otologically normal” as someone “…who is free from all signs or symptoms of ear disease and from obstructing wax in the ear canal and who has no history of undue exposure to noise, exposure to potentially ototoxic substances or familial hearing loss” (ISO 7029–2017, Section 3.1). Review of the exclusion criteria employed in the various studies comprising the dataset used in ISO 7029 (Table F.1) reveals that the criteria applied were often more stringent than specified for “otologically normal adults” in Section 3.1 of the standard. Commonly, studies whose data formed the basis of this international standard on age-associated hearing loss excluded participants with established risk factors for hearing loss including head injuries, smoking, and diabetes, among others. The values for age-associated hearing loss in ISO 7029 are essentially those included in Annex A of ISO 1999 for highly screened populations. The idea behind the synthesis of data in ISO 7029 is to derive an estimate of “pure” age-associated hearing loss, at least to the extent possible. This is a challenging, perhaps impossible, objective to realize in that elimination of adults who are positive for a particular risk factor may also modify the impact of other risk factors on hearing. For example, attempting to eliminate those individuals from the dataset with prior exposures to occupational noise also modifies several other non-noise factors that affect hearing loss, such as educational level, firearm and off-work noise, diabetes, and smoking (Agrawal et al., 2010; Dobie & Agrawal, 2011).
Annex B of ISO 1999, on the other hand, attempts to estimate representative or “typical” hearing thresholds of males and females of various ages. Stringent screening criteria to eliminate many potential causes of threshold elevation are not applied for such “unscreened” samples. The present report provides updated values for the hearing thresholds of an unscreened representative sample of adults in the U.S. Table B.3 in Annex B of ISO 1999 (2013) presents the hearing thresholds for males and females at each of five age decades: 30, 40, 50, 60, and 70 years. Here, following analysis of the most recent NHANES data, equations are provided to generate the median HTLs at each frequency for males and females as a continuous function of age from about 25–85 years. In addition, expanded tabular information is provided that includes the first and third quartiles in addition to the 10th, 50th, and 90th percentiles featured in Table B.3 of ISO 1990 (2013).
Methods
The NHANES Dataset
The NHANES 2011–2012, 2015–2016, and 2017–2020 surveys were conducted by the NCHS to monitor the health and nutritional status of the civilian, non-institutionalized US population. Sex and race/ethnicity were self-reported using federal guidelines in existence at that time. Because the surveys enquired about the respondent's sex, either male or female, rather than gender, this variable is referred to here as the participant's self-reported sex. The surveys used a complex, multistage, stratified, cluster design with oversampling of targeted subgroups to produce nationally representative estimates. Complete details for each NHANES dataset can be found at: https://www.cdc.gov/nchs/nhanes/index.htm.
NHANES targets about 5,000 individuals per year, 10,000 per 2-year cycle, for interviews and approximately half of those undergo examination at the mobile examination center (MEC). As noted, the 2017–2018 and partial 2019–2020 datasets spanning a period of 3.2 years were combined. Many of the hearing-related items in NHANES, including audiometry and tympanometry, are included as a part of the evaluation at the MEC whereas questions regarding the self-reported condition of hearing, hearing aid use, and noise exposures are included among the household interview questions. NHANES 2011–2012, 2015–2016, and 2017–2020 included 9,756, 9,971, and 15,560 individuals, respectively, with 5,560, 5,719, and 9,232 from each survey, respectively, being 20 years of age or older. Of the total of 35,287 participants across all three cycles, 11,504 had complete audiograms and 8,795 of these were from adults 20 years of age or older. For those ≥ 20 years old, the 2017–2020 cycle included audiograms only for those 70–80 + years of age. Those with an age designated as 80 + years in NHANES 2017–2020 were nominally assigned an age of 80 by NCHS to protect the participant's identity. The NCHS noted that the mean age for that group in the 2017–2020 survey was 85 years. The sex, age, and race/ethnicity of the 8,795 adults with complete audiograms are provided in Table 1.
Demographic Breakdown (Sex, Race/Ethnicity, Age Decade) of the 8,795 Adults From National Health and Nutrition Examination Survey (NHANES) 2011–2012, 2015–2016, and 2017–2020 Included in the Analyses of Hearing Thresholds.

Audiometric testing was conducted in sound booths (model Delta 142; Acoustic Systems, Austin, TX) in the MECs, which were transported to each survey location. Ambient noise met the standards for maximum permissible ambient noise levels for ears-covered testing from 500 to 8,000 Hz (ANSI 3.1, 1999). During testing, background noise was monitored continuously. For NHANES 2011–2012 and 2015–2016, HTLs were obtained using Interacoustics (Middlefart, Denmark) AD226 audiometers calibrated to ANSI S3.6 (1996) specifications. For the 2017–2020 examination, an Audiometric Research Tool (ART) system was used which comprised National Instruments hardware and custom ART software to form a comprehensive and customizable audiometer.
HTLs were obtained using a pulsed-tone stimulus and a standard clinical modified method of limits procedure for each ear at 500; 1,000; 2,000; 3,000; 4,000; 6,000; and 8,000 Hz. The first test ear varied across participants. HTLs were usually obtained using supra-aural TDH-49P headphones (Telephonics, Farmingdale, NY) but insert earphones (EARtone 3A; Etymotic Research, Elk Grove Village, IL) were used when participants had collapsing ear canals (0.6% of males and 0.4% of females). Noise was not used to mask the non-test ear. However, when marked interaural asymmetry was found (≥ 25 dB at 500 and 1,000 Hz or ≥ 40 dB at the other frequencies), the poorer ear was re-tested with insert earphones.
The surveys were approved by the NCHS Institutional Review Board, and all participants provided written consent. The audiometry examination was conducted by trained NHANES health technicians and included otoscopy, tympanometry, and air-conduction pure-tone audiometry. The entire NHANES protocols, including the survey instruments and data-coding procedures, and the complete dataset are publicly available online at https://www.cdc.gov/nchs/nhanes.
For the small number of individuals for whom there was evidence of a collapsed canal with headphones or a concern about cross-over detection of the pure-tone signal in the better ear when presented to the worse ear without masking, the HTLs obtained with insert earphones were available. Less than 0.6% of adults with complete audiograms had collapsed canals that required use of insert earphones. The number of thresholds re-tested with insert earphones due to cross-hearing concerns varied with frequency but never involved more than 1% of the HTLs for a given ear and frequency. When HTLs measured with insert earphones were available, these values were used.
Although the 8,795 adults in the dataset had complete audiograms, in some cases the HTLs could not be established because they were beyond the limits of the audiometer. These were coded in the NHANES datasets with values of “666.” Overall, this occurred less than 0.5% of the time across ears and frequencies except for the HTLs at higher frequencies (≥ 3,000 Hz) for the oldest age groups, 60–69, 70–79, and 80 + years. Specifically, the population-weighted prevalence of “666” values among the 80 + age group were 2.5%, 3.5%, 8.1%, and 26.4% at 3,000; 4,000; 6,000; and 8,000 Hz, respectively, for the left ear and 2.2%, 3.2%, 6.6%, and 27.8%, respectively, for the right ear. For the 70–79-year-olds, “666” values were entered for the left ear for 1.6%, 3.4%, and 11.1% of the cases for 4,000; 6,000; and 8,000 Hz, respectively, whereas these rates were 0.9%, 3.3%, and 10.1% of the cases, respectively, for the right ear. For the 60–69-year age group, the prevalence of “666” values exceeded 1% only at 6,000 (1.3%) and 8,000 Hz (1.2%) for the right ear and at 8,000 Hz (1.3%) for the left ear. Also, it was generally the case that, for a given age group, males had greater occurrences of “666” entries than females.
To maximize use of the available data, all “666” entries were recoded with values of 126 dB HL, a value just exceeding the maximum audiometer output of 120 dB HL across frequency and datasets. Estimates of the median and the percentiles above the median, such as the 75th and 90th percentiles for the 80 + years age group may be biased by this treatment of the “666” entries at the higher frequencies, especially 8000 Hz, and should be treated with caution. It should be noted that Agrawal et al. (2008, 2009), in their analyses of NHANES 1999–2006 data, opted to treat such entries as missing. In the more recent analyses of NHANES HTLs by Hoffman et al. (2010, 2012), there is no mention of how “666” entries were handled.
Data Analysis
All prevalence estimates and statistical analyses presented here were performed in accordance with the National Health and Nutrition Examination Survey: Analytic Guidelines, 2011–2014 and 2015–2016 published online on December 14, 2018 by the NCHS and National Health and Nutrition Examination Survey, 2017-March 2020 Prepandemic File: Sample Design, Estimation, and Analytic Guidelines (Akinbami et al., 2022). Statistical analyses were performed using SAS version 9.4 (SAS Institute, Inc., Cary, NC). This included the use of masked strata and cluster variables for the design and the use of the adjusted sample weights provided for each participant by the NCHS. Sample weights for the 2011–2012 and 2015–2016 datasets were adjusted as recommended when combined (each cycle's 2-year weights divided by 2) whereas the sample weights for the 2017–2020 dataset were unaltered. This treatment of sample weights arises from the focus on HTLs that were obtained from adults with nonoverlapping age ranges across the NHANES datasets: adults 20–69 years of age in the two earlier NHANES datasets versus adults 70–80 + years in the most recent dataset. In addition, as recommended by the NCHS, the lowest common denominator guided the choice of which set of sample weights to use and, given the focus on audiometric data attained in the MEC, those from the MEC sample weights were used here.
The full set of data from 35,287 adults was included in the dataset to be analyzed with restriction to those at least 20 years of age and with completed audiograms designated via domain specifications in the SAS analyses. Variance estimation was accomplished using the recommended Taylor-series linearization method. The 95% confidence intervals were those generated by SAS 9.4 based on standard errors estimated by linear interpolation of a normal distribution [i.e., standard error = ((p*q)/N)1/2, where p is the proportion of interest, 0.5 for the median, and q = 1-p, also 0.5 for the case of the median, and N is the number of cases]. Hoffman et al. (2010) noted that the standard error and resulting confidence intervals derived from such standard errors provided appropriate estimates of the confidence intervals.
Hoffman et al. (2010, 2012) adopted the convention that HTLs for a dataset represented the midpoint of the interval along the cumulative distribution of HTLs. Given 5-dB step sizes used for the measurement of HTLs, an HTL of 15 dB HL, for example, is considered the midpoint of values over the range of 12.5–17.5 dB HL. SAS, on the other hand, computes percentiles assuming that the HTL is the upper limit of the range. Dobie (2006) and Hoffman et al. (2010) demonstrated that midpoint-based percentiles for HTLs are the more appropriate choice and can be calculated easily from upper-limit percentiles by adding 2.5 dB to the upper-limit values generated by SAS. The midpoint convention was used throughout the present analyses when presenting percentile HTL values, including the median HTLs.
Most commonly, the “better-ear PTA4” is established by computing the four-frequency pure-tone average for 500; 1,000; 2,000; and 4,000 Hz (PTA4) for each ear and then designating the ear with the minimum PTA4 as the better ear (Stevens et al., 2013; WHO, 1991; WHO, 2021). However, ISO 1999 (2013) Table B.3 values for the unscreened U.S. population were from the “better ear” defined on a frequency-by-frequency basis. That is, if the left ear had a better HTL at 500 and 4000 Hz but the right ear had a better HTL at 1,000 and 2,000 Hz, these specific values were used to define the “better ear” HTLs. This appears to be an atypical definition of “better ear” but was imposed to reconcile entries in Annex B in the 2013 standard with calculations used in earlier editions of the standard (Hoffman et al., 2010, 2012). To minimize confusion here, the latter definition of “better ear” is labeled “PTminLR,” reflecting the use of the minimum pure-tone threshold between the left and right ears at a given frequency.
Results
Median PTminLR HTLs for Males and Females as a Function of Age
Figure 1 shows the population median PTminLR HTLs for males (top) and females (bottom) as a function of age in years. Median ages were used for each age decade except for the 80 + age group for which only the mean value of 85 years supplied by the NCHS was available. Median HTLs for 500; 1,000; and 2,000 Hz are plotted in the left panels and those for 3,000–8,000 Hz appear in the right panels.

Population estimates of median PTminLR hearing threshold levels (HTLs) for males (top) and females (bottom) for 500–2,000 Hz (left) and 3,000–8,000 Hz (right). Lines are best-fitting cubic polynomials fitted to the population medians.
Table 2 provides the parameters for the best-fitting cubic polynomials for each sex and frequency. These polynomials were fitted to the median values and not to the individual data. They are offered as a means of easily estimating the median HTLs for males and females ranging in age from about 25–85 years of age, along the lines of Dobie and Wojcik (2015). The r2 values for each fit to the medians were > 0.97, which was slightly but consistently higher than quadratic fits in every case.
Regression Coefficients for Best-Fitting Cubic Polynomials Fitted to the Median PTminLR Hearing Threshold Level (HTLs).

HTLf = Yof + af*A + bf*A2 +cf*A3, where A = age in Years and f = Frequency in Hz. All r2 values for the best-fitting equations fitted to the medians were greater than 0.97.
Figure 2 (males) and 3 (females) show the median PTminLR HTLs for age decades centered at 30, 40, 50, 60, and 70 years of age. These are the same age ranges used in Hoffman et al. (2010, 2012) for the NHANES 1999–2006 data that were the basis for the ISO 1999 (2013) Table B.3 values. The median values (filled circles) are plotted with 95% confidence intervals. The red solid line represents the best-fitting cubic polynomial using the median age for each age decade and the equation parameters in Table 2. As expected, there is good agreement between the equation predictions and the population median PTminLR values for both sexes and all age decades. For comparison, the unfilled circles in each panel present the medians from ISO 1999 (2013) Table B.3. The ISO values tend to be slightly higher (worse) than those from the present analyses, especially for males (Figure 2).

Population-weighted median PTminLR HTLs for males for each age group from the NHANES combined dataset (filled circles). Error bars = 95% confidence intervals for the PTminLR medians. Red solid lines are values estimated using the equation parameters in Table 2. Unfilled circles show medians from ISO 1999 (2013) Table B.3. Median ages for each age group appear in the parentheses in each panel after age range. HTL = hearing threshold level; NHANES = National Health and Nutrition Examination Survey.
Due to the previously discussed possible underestimation of HTLs at 8,000 Hz in the 80 + age group, especially for males, median audiograms for that age group were not included in Figures 2 and 3. ISO 1999 (2013) Table B.3 also does not include values for males and females in their 80 s.
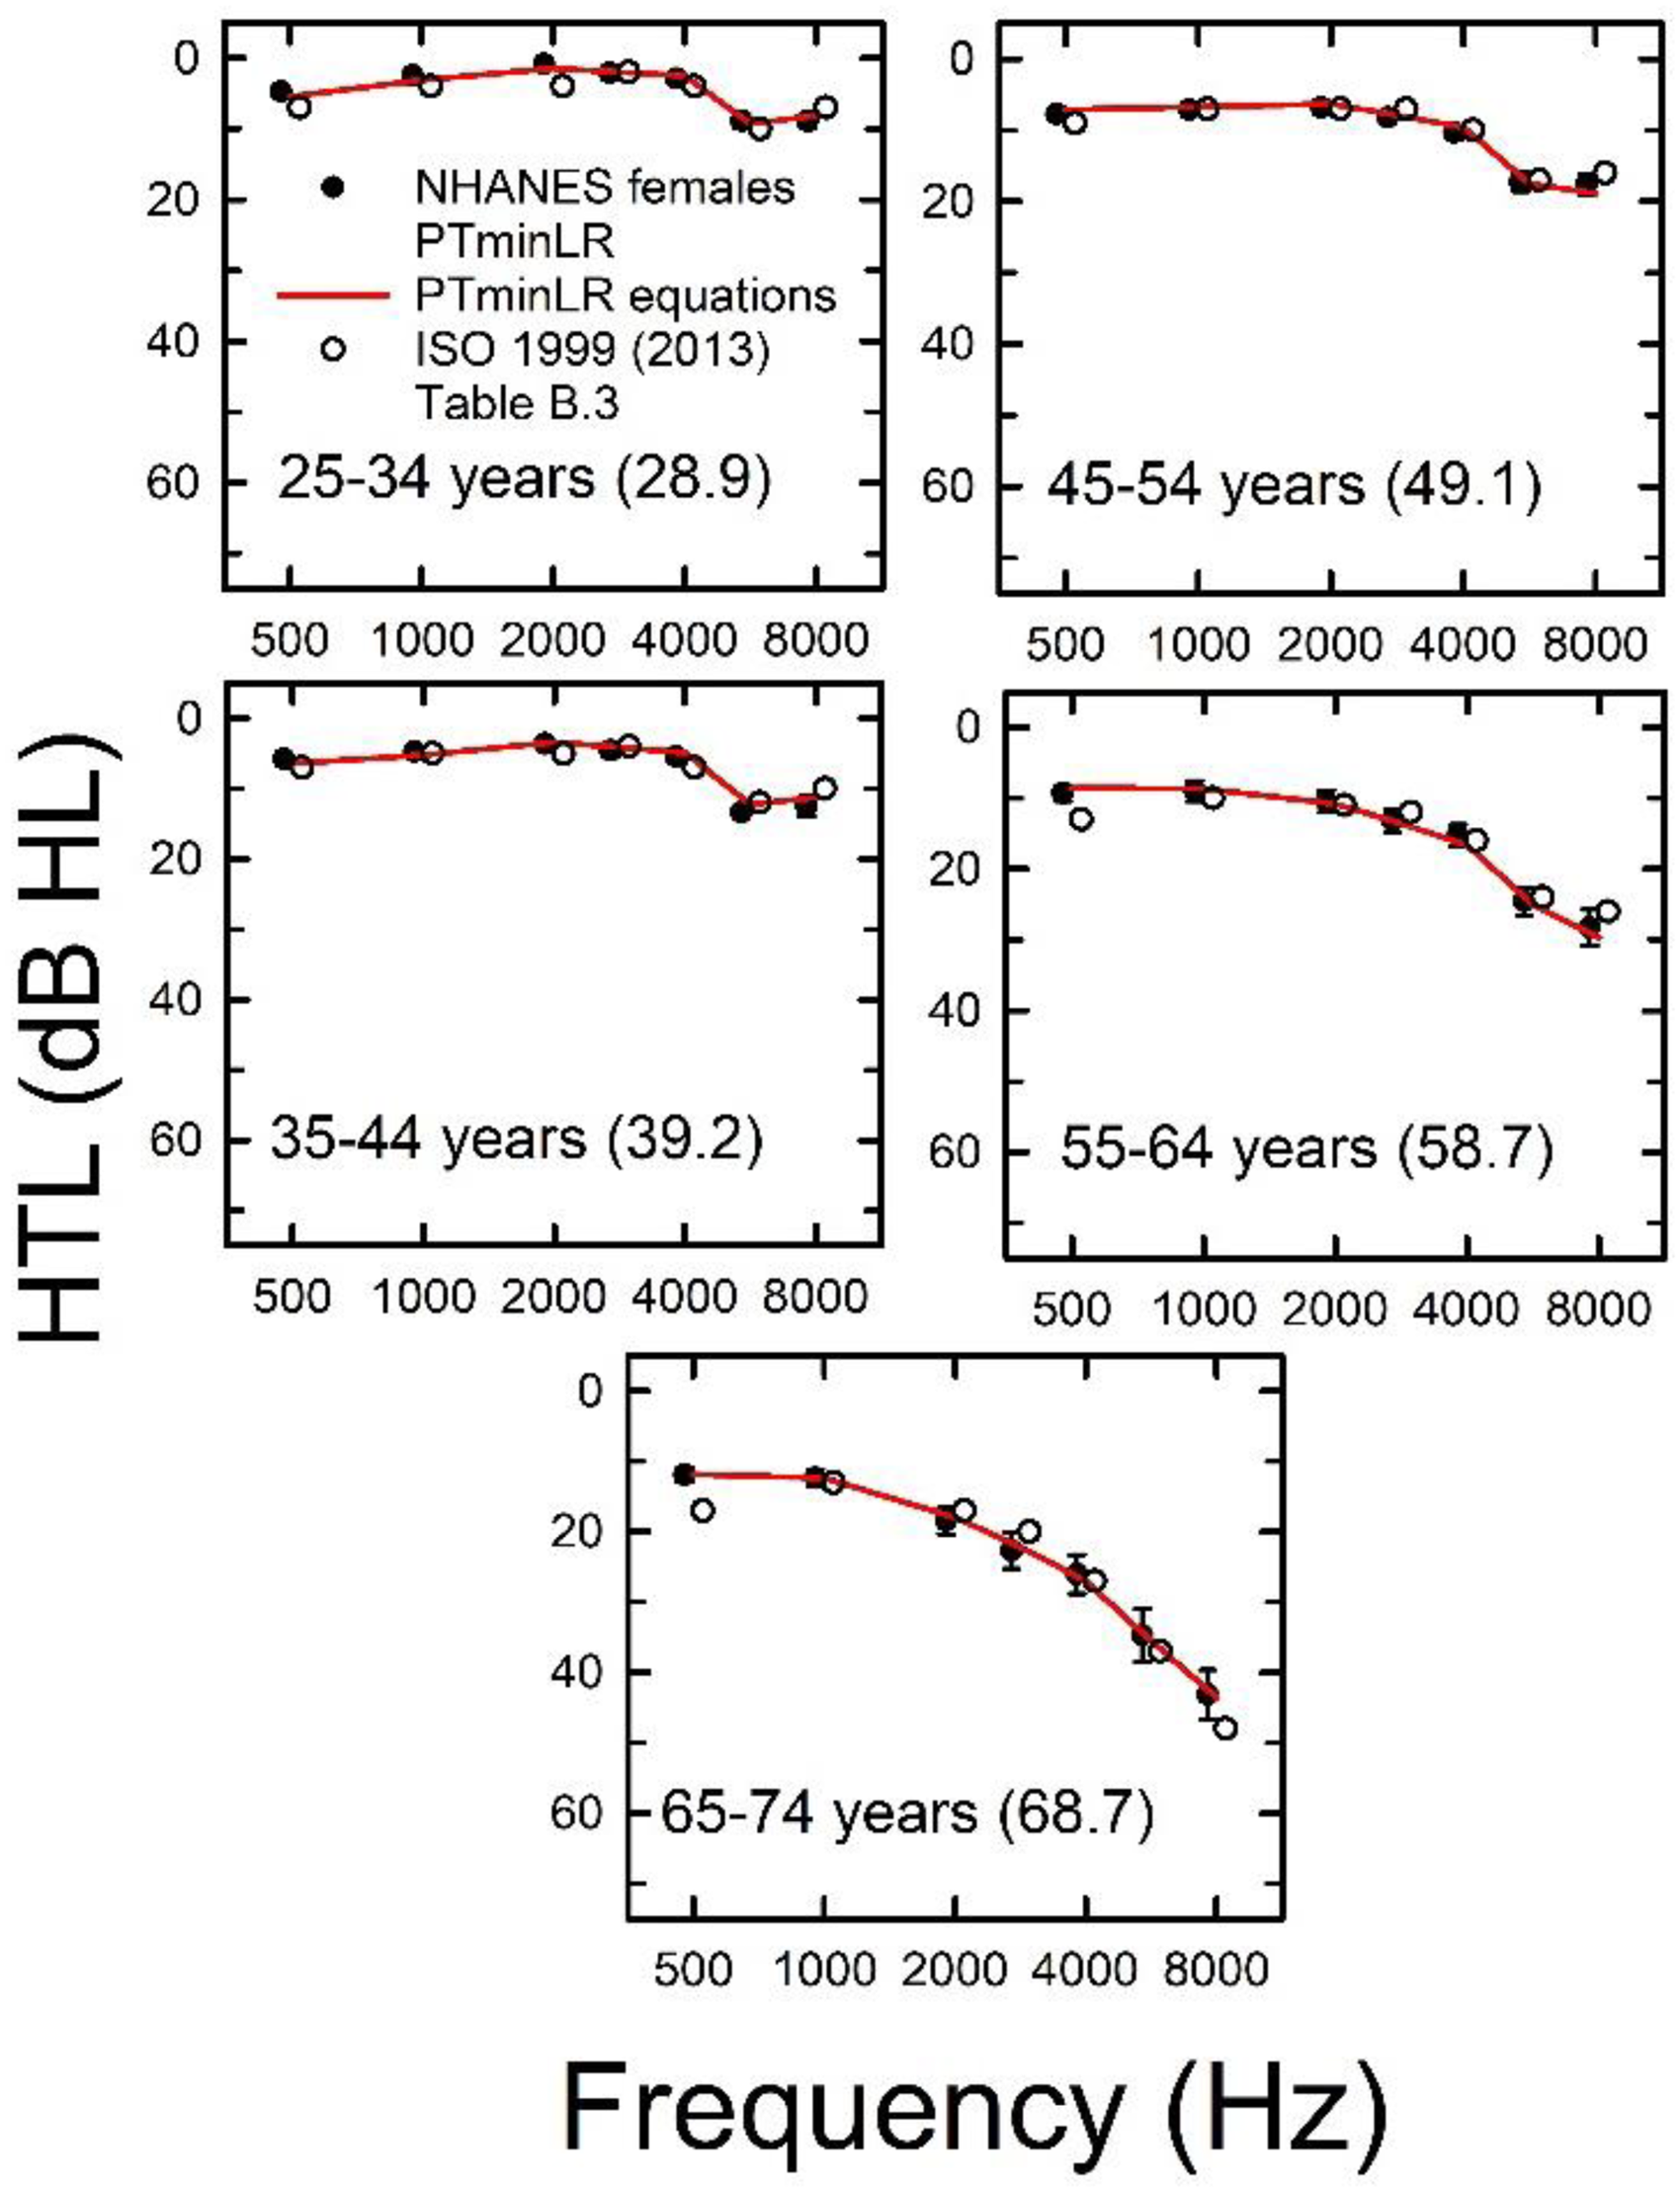
As Figure 2, but for females.
The ISO values (unfilled circles) in Figures 2 and 3 tend to be slightly higher (worse) than those from the present analyses (filled circles). Table 3 provides a more detailed look at these differences. Generally, the differences are larger for males than females and for the oldest two age decades. The ISO 1999 (2013) median HTLs were about 2 to 5 dB worse at 500 Hz for males and females and 2 to 8 dB worse at 4,000 and 6,000 Hz for males than the current NHANES estimates.
Differences in Median HTLs in dB, Calculated as ISO-1999 (2013) Table B.3 Median PTminLR Values minus Median PTminLR Values from the NHANES 2011–2012, 2015–2016, and 2017–2020 Combined Dataset.

HTL = hearing threshold level; NHANES = National Health and Nutrition Examination Survey.
Population percentiles for PTminLR HTLs were generated from the combined NHANES 2011–2012, 2015–2016, and 2017–2018 dataset for each frequency, sex, and age decade. The HTLs for each percentile are provided in the Appendix as Tables A1 (males) and A2 (females). Again, the HTLs at 8,000 Hz for the oldest 80 + age group should be interpreted with caution.
Figure 4 depicts the population median PTminLR HTLs estimated by the cubic polynomials using the parameters in Table 2 for males (left) and females (right) for ages 25 through 85 years. It is well known that two of the major factors affecting HTLs for adults are sex, males having worse hearing than females, and age, hearing declining with age for both sexes, and this has been observed consistently in NHANES datasets (e.g, Agrawal et al., 2008, 2009; Hoffman et al., 2010, 2012, 2017). The effects of both factors on the estimated median PTminLR HTLs are readily apparent in Figure 4.

Population median PTminLR hearing threshold level (HTLs) for males (left) and females (right) for ages 25–85 years estimated using the best-fitting cubic polynomial with the parameters in Table 2.
Although examined less frequently than sex and age, race/ethnicity has also been found consistently to affect HTLs in NHANES datasets. The significant effects of race/ethnicity have been due primarily to the differences in hearing between Non-Hispanic Blacks and Non-Hispanic Whites with the former having lower HTLs than the latter (Agrawal et al., 2008, 2009; Driscoll & Royster, 1984; Flamme et al., 2011, 2020; Hoffman et al., 2010, 2017; Royster et al., 1980). In Figures 5 (males) and 6 (females), the population median PTminLR HTLs are shown for these two racial/ethnic groups for each sex and age decade. For both sexes and most age decades, the median HTLs in Figures 5 and 6 at and above 2,000 Hz are lower (better) for Non-Hispanic Blacks than for Non-Hispanic Whites in the same age-sex cohort, the gap between these two races/ethnicities widening with advancing age. The dashed lines in each panel show the estimated median PTminLR HTLs using the cubic polynomial equation (Table 2). Note that the equation derived from the data for all races/ethnicities provides a very good estimate of median PTminLR HTLs for the Non-Hispanic White group but not for the Non-Hispanic Black group. This is due, in part, to the higher prevalence of Non-Hispanic Whites than any other racial/ethnic group in the US (and, consequently, in NHANES) and to the HTLs for this group being largely representative of all race/ethnicities except Non-Hispanic Blacks. Figures 5 and 6 confirm and extend previous findings and re-emphasize the need to take race and ethnicity into account when considering age-associated hearing loss.
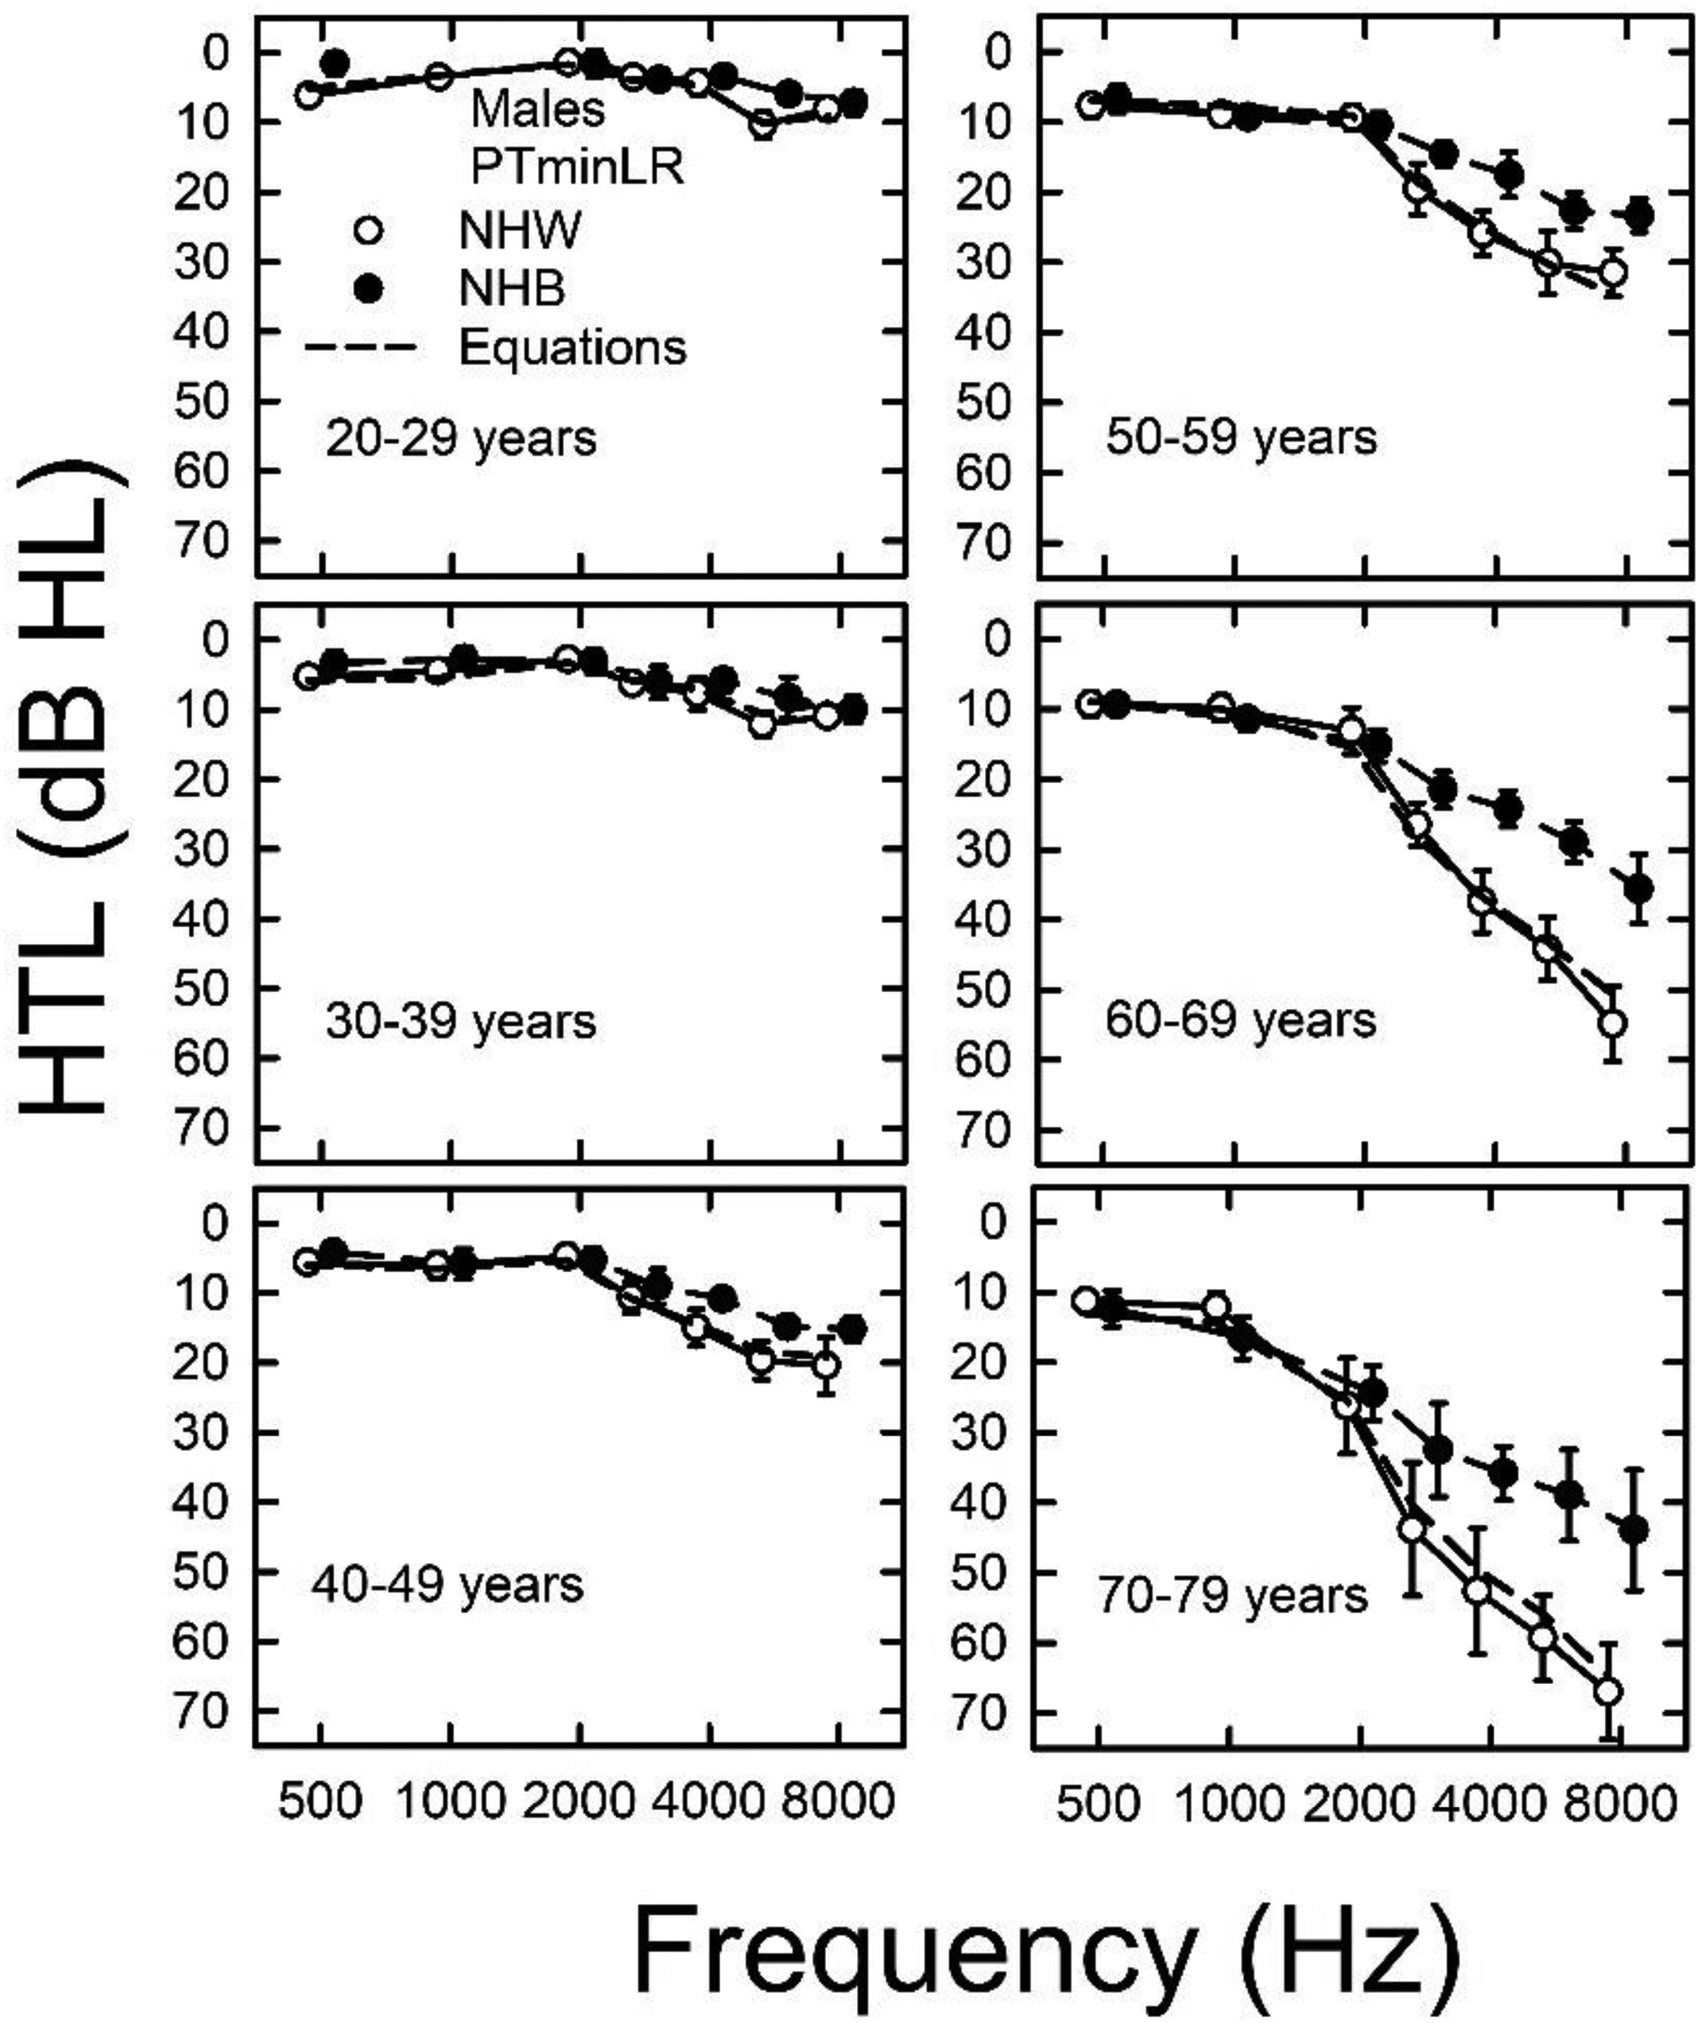
Population-weighted median HTLs for NHW (unfilled circles) and NHB (filled circles) males. Error bars show 95% confidence intervals. HTL = hearing threshold level; NHW = Non-Hispanic White; NHB = Non-Hispanic Black.

As Figure 5 but for females.
Discussion
The present analyses of the NHANES 2011–2012, 2015–2016, and 2017–2020 datasets confirm and extend prior findings regarding median PTminLR HTLs as a function of sex and age for frequencies from 500 to 8,000 Hz as well as the clear effects of age, sex, and race/ethnicity on these HTLs (e.g., Agrawal et al., 2008, 2009; Hoffman et al., 2010, 2012, 2017). The median PTminLR HTLs reported by Hoffman et al. (2010, 2012) from NHANES 1999–2006 formed the basis for the values in Table B.3 of Annex B in ISO 1999 (2013). When the median HTLs from the present analyses (Figures 2 and 3) were compared to the medians from Table B.3 of ISO 1999 (2013), the present median HTLs were slightly better in several cases. As was shown in Table 3, the ISO 1999 (2013) median HTLs were about 2–5 dB worse at 500 Hz for males and females and 2–8 dB worse at 4,000 and 6,000 Hz for males than the current NHANES estimates. The cubic polynomials (Table 2) fitted to the group median data provided excellent estimates of the median values for both sexes and for the various age ranges (Figures 2 and 3). Should ISO 1999 be revised, the values reported herein may represent a reasonable replacement for the median PTminLR values for an unscreened U.S. population, currently in Table B.3 of ISO 1999 (2013). To facilitate the use of these values for any age from approximately 25–85 years, the cubic polynomial equations with the parameters specified in Table 2 could also be included in Annex B of the standard. Finally, population estimates of the PTminLR HTLs for the 10th, 25th, 50th, 75th, and 90th percentiles are provided in Tables A1 and A2 of the Appendix, again to facilitate the application of these results to the interpretation of PTminLR HTLs measured in various groups or individuals in the U.S.
As in prior analyses of hearing loss from NHANES datasets, the primary variables affecting HTLs were age and sex (Agrawal et al., 2009; Hoffman et al., 2010, 2017), with HTLs increasing steadily with age and being higher (worse) for males than females. The effects of race/ethnicity, specifically, Non-Hispanic Blacks having lower (better) HTLs than Non-Hispanic Whites, observed consistently in prior analyses of NHANES data (Agrawal et al., 2008, 2009; Flamme et al., 2011; Flamme et al., 2020; Hoffman et al., 2010, 2017), were again observed in these analyses of the most recent NHANES data.
Footnotes
Acknowledgments
This work was supported, in part, by Indiana University, including the use of the High-Performance Computing center. The author thanks the reviewers for their helpful comments on the original submission.
Declaration of Conflicting Interests
The author declared no potential conflicts of interest with respect to the research, authorship, and/or publication of this article.
Ethical Approval
The surveys of this study were approved by the NCHS Institutional Review Board.
Funding
The author received no financial support for the research, authorship, and/or publication of this article.
Informed Consent
All participants provided written informed consent.
Appendix A. Tables With Population Percentiles.
Population Percentiles for Females From the Combined NHANES 2011–2012, 2015–2016, and 2017–2020 Dataset.

| Sex | Age | %-tile | 500 Hz | 1,000 Hz | 2,000 Hz | 3,000 Hz | 4,000 Hz | 6,000 Hz | 8,000 Hz |
|---|---|---|---|---|---|---|---|---|---|
| Female | 20–29 | 10 | −1.8 | −4.0 | −6.3 | −6.3 | −6.4 | −1.3 | −1.4 |
| (24.0) | 25 | 1.0 | −1.1 | −2.7 | −2.4 | −2.4 | 3.5 | 3.2 | |
| 50 | 5.0 | 1.9 | 0.7 | 1.4 | 1.8 | 8.6 | 8.0 | ||
| 75 | 9.3 | 5.8 | 5.1 | 5.7 | 6.3 | 14.0 | 13.6 | ||
| 90 | 12.5 | 10.0 | 9.6 | 10.4 | 11.3 | 19.0 | 19.2 | ||
| 30–39 | 10 | −1.6 | −2.6 | −5.6 | −5.0 | −4.1 | 0.7 | 0.8 | |
| (33.8) | 25 | 1.1 | −0.3 | −1.7 | −1.2 | −0.4 | 5.3 | 5.0 | |
| 50 | 5.0 | 3.5 | 2.1 | 2.8 | 3.9 | 10.6 | 10.2 | ||
| 75 | 9.6 | 7.1 | 6.9 | 7.6 | 8.5 | 16.4 | 16.1 | ||
| 90 | 14.8 | 11.7 | 11.6 | 12.3 | 13.0 | 22.1 | 22.2 | ||
| 40–49 | 10 | −1.5 | −1.8 | −2.3 | −2.0 | −0.8 | 4.4 | 4.1 | |
| (44.2) | 25 | 1.9 | 2.0 | 0.6 | 1.8 | 3.3 | 9.4 | 9.2 | |
| 50 | 6.5 | 6.0 | 5.0 | 6.2 | 7.2 | 14.8 | 15.1 | ||
| 75 | 11.2 | 11.1 | 10.2 | 11.9 | 13.8 | 21.5 | 22.4 | ||
| 90 | 16.2 | 16.4 | 17.1 | 19.8 | 21.4 | 31.5 | 31.9 | ||
| 50–59 | 10 | 0.4 | −0.2 | −0.9 | 0.3 | 3.2 | 9.2 | 9.5 | |
| (53.8) | 25 | 4.2 | 3.6 | 3.3 | 5.0 | 7.4 | 14.2 | 15.1 | |
| 50 | 8.7 | 8.0 | 8.8 | 10.6 | 12.9 | 20.7 | 22.3 | ||
| 75 | 14.0 | 13.2 | 15.0 | 17.3 | 20.1 | 30.1 | 34.2 | ||
| 90 | 20.8 | 20.7 | 21.2 | 25.7 | 30.4 | 40.4 | 50.0 | ||
| 60–69 | 10 | 1.5 | 0.7 | 1.2 | 2.9 | 5.0 | 11.2 | 15.3 | |
| (63.7) | 25 | 5.3 | 4.9 | 5.6 | 7.9 | 10.6 | 17.8 | 22.6 | |
| 50 | 10.9 | 11.0 | 12.4 | 16.1 | 18.9 | 29.2 | 35.4 | ||
| 75 | 17.0 | 18.2 | 21.9 | 27.2 | 31.5 | 42.0 | 51.6 | ||
| 90 | 26.5 | 27.8 | 32.7 | 37.4 | 44.0 | 55.2 | 66.0 | ||
| 70–79 | 10 | 4.1 | 3.5 | 7.3 | 11.5 | 14.0 | 17.3 | 21.6 | |
| (73.3) | 25 | 8.3 | 7.7 | 14.3 | 18.6 | 21.7 | 26.6 | 36.8 | |
| 50 | 12.5 | 13.7 | 23.5 | 28.5 | 35.3 | 42.1 | 52.8 | ||
| 75 | 21.2 | 23.1 | 35.4 | 41.3 | 47.7 | 55.3 | 65.1 | ||
| 90 | 30.2 | 35.6 | 47.8 | 51.0 | 58.8 | 63.6 | 72.2 | ||
| 80+ | 10 | 8.5 | 7.9 | 13.2 | 20.6 | 26.2 | 29.8 | 38.6 | |
| (85.0) | 25 | 15.0 | 14.4 | 22.4 | 28.7 | 35.0 | 45.0 | 58.2 | |
| 50 | 24.3 | 25.3 | 36.4 | 42.8 | 50.6 | 58.6 | 68.8 | ||
| 75 | 34.0 | 36.8 | 50.7 | 54.6 | 60.0 | 67.6 | 79.0 | ||
| 90 | 43.8 | 47.4 | 59.0 | 62.0 | 67.0 | 75.8 | 96.0 |
Values are PTminLR thresholds in dB HL at frequencies from 500 through 8000 Hz. For each age decade, the range of ages and the population median age are shown, the latter in parentheses.