
Abstract
The National Health and Nutrition Examination Survey (NHANES) data on audiometric hearing loss, self-reported trouble hearing, and the use of hearing aids and assistive listening devices (ALDs) for the three most recent surveys (2011–12, 2015–16, and 2017–20) were analyzed for adults ranging in age from 20 to 80-plus years. Complete audiograms were available for a total of 8,795 adults. The prevalence of hearing loss, measured audiometrically and self-reported, is provided for males and females by age decade. Logistic-regression analyses identified variables affecting the odds of having an audiometrically defined hearing loss or self-reported trouble hearing. As in previous reports, males were more likely than females to have audiometric hearing loss and the prevalence of hearing loss increased steadily with advancing age. The same trends were observed for self-reported hearing difficulty, although the effects of age and sex were smaller for self-reported trouble hearing compared to audiometric hearing loss. The agreement between the audiometric classification of hearing loss severity and the amount of trouble reported on the self-report measure was moderate (r = 0.61). The prevalence of hearing-aid and ALD use differed for males and females of the same age, females generally using these devices less frequently than males, but both showing increased prevalence of device use with advancing age. Unmet hearing-healthcare need, defined as the percentage of those with identified hearing loss or trouble hearing who were not current hearing-aid users or had never tried hearing aids or ALDs, was about 85%.
Keywords
Introduction
The Over-the-Counter Hearing Aid Act of 2018 created the opportunity for a new pathway through the Hearing Healthcare (HHC) system, one that empowers the adult with perceived mild-to-moderate hearing loss to seek hearing help on their own. In the release of its final rule, U.S. Food and Drug Administration (FDA) “Establishing Over-the-Counter Hearing Aids,” on August 17, 2022 (https://www.federalregister.gov/d/2022-17230), the FDA retained the reliance on “perceived mild-to-moderate hearing loss” as the primary criterion for over-the-counter (OTC) hearing aids. This candidacy criterion originated in the Federal legislation and the legislation followed from a decade-long effort to improve the accessibility and affordability of HHC in the U.S. (Donahue et al., 2010; NASEM, 2016; PCAST, 2015).
Over the past several decades, provision of hearing aids in the U.S. and many other countries required the participation of various HHC professionals, most frequently hearing-instrument dispensers, audiologists, or physicians. The HHC professional determined candidacy for hearing aids based almost exclusively on the individual's audiogram. There are many barriers in the prevailing HHC system in the U.S. that have had the effect of drastically reducing the number of individuals with perceived hearing trouble who have sought and obtained hearing aids. The cost of hearing aids in the U.S. has certainly been one significant barrier. Another key barrier has been the requirement to consult with HHC professionals to establish candidacy, typically requiring an audiogram, as well as to obtain the hearing aid(s) once cleared by the HHC professional to do so (Humes, 2020; Laplante-Levesque et al., 2012; Pronk et al., 2017; Yueh et al., 2010).
As HHC in the U.S. begins to embark on a new or additional pathway to hearing help for adults with perceived mild-to-moderate hearing loss, it is important to benchmark the current state of HHC in the U.S. In this way, the impact of this new pathway to hearing help can be better evaluated in the future. To do this, data from the most recently available National Health and Nutrition Examination Surveys (NHANES) were analyzed and are reported here. Specifically, data on audiometrically measured and self-reported hearing loss from the NHANES 2011–12, 2015–16, and 2017–20 interviews and examinations were analyzed here. In addition, data on the uptake of hearing aids and assistive listening devices (ALDs) by U.S. adults were examined. With these “baseline” data available, many years from now it will be possible to redo such analyses to determine whether the advent of OTC hearing aids and other efforts to improve the accessibility and affordability of HHC in the U.S. have had a significant impact on the provision of HHC to those in need of hearing help.
One of the appeals of the prevailing reliance on the audiogram for candidacy, in contrast to reliance on perceived hearing difficulty, has been the objectivity of the audiometric measurements. Audiograms have long been obtained using standardized psychophysical procedures and precisely calibrated equipment to ensure the accuracy and reliability of the measurements across time and across clinics (Bunch, 1922, 1943; Carhart & Jerger, 1959). LePrell et al. (2022) provide a recent description of the history of pure-tone audiometry and its application to several clinical disorders, including noise-induced hearing loss and ototoxicity-induced hearing loss.
A key problem with reliance on the pure-tone audiogram for candidacy for help with hearing aids is the frequently observed mismatch between audiometrically defined and self-perceived hearing loss. This mismatch was the focus of a recent synthesis of existing information on audiometric and self-reported hearing loss by Edwards (2020) in the context of the potential market for OTC hearing aids. Many population studies of audiometric and self-reported hearing difficulties also have observed this mismatch (Choi et al., 2016, 2019; Goman et al., 2020; Kamil et al., 2015; Kiely et al., 2012; Kim et al., 2017; Nondahl et al., 1998; Oosterloo et al., 2020; Salonen et al., 2011; Sindhusake et al., 2001; Swanepoel et al., 2013; Wiley et al., 2000). Often the mismatch between audiometric and self-report measures of hearing difficulties has been couched in terms of the self-report measure either underestimating or overestimating the true hearing loss as captured by the audiogram. From the inception of many self-report measures, however, it was recognized that the pure-tone audiogram did not provide a comprehensive picture of hearing function and self-report measures were needed to supplement the audiogram (e.g., Demorest & Erdman, 1987; Giolas et al., 1979; Ventry & Weinstein, 1982, 1983; Weinstein & Ventry, 1983). In this context, self-report measures were not intended to estimate the severity of pure-tone hearing loss but to supplement the narrow audiometric information with broad functional information. Humes (2021a) emphasized this distinction in analyses of data from over 10,000 adults with self-report and audiometric information. When reviewing the literature on self-reported or perceived hearing loss, however, it is quickly apparent that there is no consensus as to how this should be measured and summarized, with tools ranging from single Yes/No questions (e.g., Nondahl et al., 1998; Sindhusake et al., 2001) to comprehensive surveys with as many as 163 items (Demorest & Erdman, 1987).
Even for the audiogram, debates arise regarding how the audiometric information should be summarized and interpreted. Typically, a pure-tone-average (PTA) is involved as a summary metric, but the frequencies constituting the PTA and the boundaries established for that PTA to effectively categorize the severity of the hearing problem have been topics of sometimes heated scholarly exchanges for many years [see Humes (2020) for a brief overview of this debate]. Another important decision concerning the reduction of audiometric information to severity of hearing loss pertains to whether the PTA should be based on the better ear, the worse ear, or some type of bilateral average.
Most recently, the World Health Organization (WHO) adopted a new guideline for hearing loss severity to be extracted from the pure-tone audiogram (Olusanya et al., 2019; Stevens et al., 2013; WHO, 2021). Based on the better-ear PTA for 500, 1000, 2000 and 4000 Hz, referred to here as the better-ear PTA4, the WHO set the following limits for each of several “hearing-impairment grades”: (0, normal) PTA4 < 20 dB HL; (1, mild) 20 ≤ PTA4 < 35 dB HL; (2, moderate) 35 ≤ PTA4 < 50 dB HL; (3, moderately severe) 50 ≤ PTA4 < 65 dB HL; (4, severe) 65 ≤ PTA4 < 80 dB HL; (5, profound) 80 ≤ PTA4 < 95 dB HL; and (6, deafness) PTA4 ≥ 95 dB HL. Humes (2018) evaluated the functional deficits associated with each hearing-impairment grade in this WHO classification system and found that the average data supported incremental functional changes with each successive step in hearing-impairment grade, except for the distinction between the moderately severe and severe grades. However, there were large individual variations in functional deficits within a given hearing-impairment grade (Humes, 2020, 2021a). Individuals classified as “normal hearing,” for example, had self-reported hearing difficulties that ranged from minimal to substantial. A similar wide range of variation in perceived hearing difficulties was observed for each PTA4-based hearing-impairment grade. In Humes (2021a), and consistent with the available literature, the correlation between the audiometrically defined and the self-reported hearing impairment severity was r = 0.5 to 0.6, suggesting 25–36% shared variance between these two types of measures. This was not due to inherent unreliability of the self-report measure analyzed in Humes (2021a), which was the Hearing Handicap Inventory for the Elderly-Screen (HHIE-S; Ventry & Weinstein, 1982, 1983; Weinstein, 1986). This instrument has been evaluated by many investigators and scores have test-retest correlations on the order of r = 0.85 to 0.90 (Lichtenstein et al., 1988; Tomioka et al., 2013; Ventry & Weinstein, 1983; Weinstein et al., 1986).
Humes (2021a) argued that the modest shared variance between audiometric and self-report measures of hearing was related to the different functional domains tapped by each measure. Within the context of the WHO International Classification of Health and Functioning (WHO-ICF; WHO, 2001), pure-tone audiometry tapped into only the “bodily impairment” domain of healthy function whereas well-conceived self-report measures can tap all three domains defined by the WHO model, bodily impairment, activity limitations, and participation restrictions, and possibly some of the contextual factors that modulate each domain. As a result, a strong association between the narrow audiometric measure of hearing loss and the broad self-report measure of hearing difficulty would not be expected. There are other important methodological differences between the psychophysical measurement of behavioral responses to acoustic stimuli inherent in pure-tone audiometry and broad questionnaire-based measures of hearing function that also likely contribute to the modest shared variance between these two measures. Further, pure-tone audiometry does not itself provide a complete assessment of auditory-based “bodily impairment” even for peripheral sensory or neural function (e.g., Kohrman et al., 2020; Moore, 2019).
As a new pathway to hearing help dawns in the U.S. with the advent of OTC hearing aids, it is important not to just benchmark the current state of HHC but also to better understand the association between audiometric definitions of hearing impairment and self-report measures of perceived hearing difficulty. This represents another objective of the present data analyses and report. Of particular interest is the association of each of these measures with the eventual uptake of assistance from devices, such as hearing aids and ALDs, by adults. Several studies and reviews have identified self-reported hearing difficulty as the key factor leading to hearing-aid acquisition within the extant HHC system (e.g., Hickson et al., 2014; Humes, 2021b; Knudsen et al., 2010; Laplante-Levesque et al., 2012; Pronk et al., 2017; Ratanjee-Vanmali et al., 2019; Sawyer et al., 2019; Simpson et al., 2019). Further, many older adults with slight amounts of pure-tone hearing loss, well within the WHO-new HI grade of “normal” hearing, seek hearing aids and obtain positive outcomes (Humes, 2020; Roup et al., 2018; Singh & Doherty, 2020). These individuals are already well motivated as they have perceived hearing needs that compromise their auditory wellness. Although factors affecting the uptake of hearing aids have been studied frequently, much less is known about the factors affecting the uptake of ALDs. Evidence regarding the overall effectiveness of ALDs in addressing the HHC needs of adults is mixed, but such devices are growing rapidly in use among adults (e.g., Maidment et al., 2018). The presentation of prevalence data on the use of ALDs by adults in the U.S. represents another objective of the present report.
In summary, this report had the following objectives. To provide: (1) updated estimates of the prevalence of audiometric hearing loss and perceived hearing difficulty among U.S. adults; (2) updated estimates of the prevalence of use of hearing aids and ALDs in U.S. adults; (3) estimates of the unmet HHC needs of U.S. adults. In addition, variables affecting audiometric hearing loss, perceived hearing difficulty, and device uptake were examined.
Methods
The NHANES Dataset
The NHANES 2011–12, 2015–16, and 2017–20 surveys were conducted by the National Center for Health Statistics (NCHS), Centers for Disease Control and Prevention to monitor the health and nutritional status of the civilian, non-institutionalized US population. Sex and race/ethnicity were self-reported using federal guidelines in existence at that time. Because the surveys enquired about the respondent's sex, either male or female, rather than gender, this variable is referred to here as the participant's self-reported sex. The surveys used a complex, multistage, stratified, cluster design with oversampling of targeted subgroups to produce nationally representative estimates. The specific groups oversampled varied across surveys; full details are provided by NHANES (https://wwwn.cdc.gov/nchs/nhanes/analyticguidelines.aspx#sample-design).
NHANES 2011–12, 2015–16, and 2017–20 included 5,560, 5,719, and 9,232 from each survey, respectively, who were 20 years of age or older. Of these adults, 8,795 had complete audiograms. For those ≥ 20 years old, the 2017–20 cycle included audiograms only for those 70–80 + years of age. Those with age designated as 80 + years in NHANES 2017–20 were nominally assigned an age of 80 by NCHS to protect the participant's identity. The NCHS noted that the mean age for that group in the 2017–20 survey was 85 years. The sex, age, and race/ethnicity of the 8,795 adults with complete audiograms are provided in Table 1.
Demographic Breakdown (Sex, Race/Ethnicity, Age Decade) of the 8,795 Adults from NHANES 2011–12, 2015–16, and 2017–20 Included in the Analyses of Hearing Thresholds.

Audiometry
Audiometric testing was conducted in sound booths (model Delta 142; Acoustic Systems, Austin, TX) in the mobile examination centers (MECs), which were transported to each survey location. Ambient noise met the standards for maximum permissible ambient noise levels for ears-covered testing from 500–8000 Hz (ANSI 3.1, 1999). During testing, background noise was monitored continuously. For NHANES 2011–12 and 2015–16, hearing threshold levels (HTLs) were obtained using Interacoustics (Middlefart, Denmark) AD226 audiometers calibrated to ANSI S3.6 (1996) specifications. For the 2017–20 examination, an Audiometric Research Tool (ART) system was used which comprised National Instruments hardware and custom ART software to form a comprehensive and customizable audiometer. For tympanometry, in 2011–12, the micro audiometrics earscan (Murphy, NC) acoustic impedance tympanometer (Murphy, NC) whereas in 2015–16 and 2017–20 the Interacoustics Titan (Middelfart, Denmark) was used. All results were obtained using a 226-Hz probe frequency.
HTLs were obtained using a pulsed-tone stimulus and a standard clinical modified method of limits procedure for each ear at 500, 1000, 2000, 3000, 4000, 6000 and 8000 Hz. The first test ear varied across participants. HTLs were usually obtained using supra-aural TDH-49P headphones (Telephonics, Farmingdale, NY) but insert earphones (EARtone 3A; Etymotic Research, Elk Grove Village, IL) were used when participants had collapsing ear canals (0.6% of males and 0.4% of females). Noise was not used to mask the non-test ear. However, when marked interaural asymmetry was found (≥ 25 dB at 500 and 1000 Hz or ≥ 40 dB at the other frequencies), the poorer ear was re-tested with insert earphones which have greater interaural attenuation than the headphones.
The surveys were approved by the National Center for Health Statistics Institutional Review Board, and all participants provided written consent. The audiometry examination was conducted by trained NHANES health technicians and included otoscopy, tympanometry, and air-conduction pure-tone audiometry. The entire NHANES protocols, including the survey instruments and data-coding procedures, and the complete dataset are publicly available online at https://www.cdc.gov/nchs/nhanes.
For the small number of individuals for whom there was evidence of a collapsed canal with headphones or a concern about cross-over detection of the pure-tone signal in the better ear when presented to the worse ear without masking, the HTLs obtained with insert earphones were available. Less than 0.6% of adults with complete audiograms had collapsed canals that required use of insert earphones. The number of thresholds re-tested with insert earphones due to cross-hearing concerns varied with frequency but never involved more than 1% of the HTLs for a given ear and frequency. When HTLs measured with insert earphones were available, these values were used.
Although the 8,795 adults in the dataset had complete audiograms, in some cases the HTLs could not be established because they were beyond the limits of the audiometer. These were coded in the NHANES datasets with values of “666.” Overall, this occurred less than 0.5% of the time across ears and frequencies except for the HTLs at higher frequencies (≥ 3000 Hz) for the oldest age groups, 60–69, 70–79, and 80 + years. Specifically, the population-weighted prevalence of “666” values among the 80 + age group were 2.5, 3.5, 8.1, and 26.4% at 3000, 4000, 6000, and 8000 Hz, respectively, for the left ear and 2.2, 3.2, 6.6, and 27.8%, respectively, for the right ear. For the 70–79-year-olds, “666” values were entered for the left ear for 1.6, 3.4, and 11.1% of the cases for 4000, 6000, and 8000 Hz, respectively, whereas these rates were 0.9, 3.3, and 10.1% of the cases, respectively, for the right ear. For the 60–69-year age group, the prevalence of “666” values exceeded 1% only at 6000 (1.3%) and 8000 Hz (1.2%) for the right ear and at 8000 Hz (1.3%) for the left ear. Also, it was generally the case that, for a given age group, males had greater occurrences of “666” entries than females. To maximize use of the available data, all “666” entries were recoded with values of 126 dB HL, a value just exceeding the maximum audiometer output of 120 dB HL across frequency and datasets.
Interview Questions and Examination Data
The interview question used to define the presence of hearing trouble was the following (AUQ054): “Which statement best describes your hearing (without a hearing aid or other listening device)? Would you say that your hearing is excellent, good, that you have a little trouble, moderate trouble, a lot of trouble, or are deaf?” The responses to this question have been analyzed in several prior studies of various NHANES datasets with responses of “excellent” or “good” considered as reflective of no trouble hearing and all other responses, from “a little trouble” through “deaf” considered as reflective of varying degrees of hearing trouble (e.g., Choi et al., 2016; Goman et al., 2020; Kamil et al., 2015). This same question and dichotomization of responses was also employed in several other surveys outside of the NHANES (e.g., Caban et al., 2005; Dillard et al., 2022; Marrone et al., 2019; McKee et al., 2018; Zelaya et al., 2015). This same criterion was employed in the present analyses and is justified additionally below.
Other hearing-related interview questions examined here concerned the frequency of difficulty following conversation in noise (AUQ 100/101) and how frequently hearing caused frustration when talking (AUQ110). Each of these questions included responses of always, usually, at least half the time, seldom, and never. In addition, device-related questions included queries about whether the respondent ever used hearing aids or cochlear implants (AUQ146/148), with the 2017–20 survey adding personal sound amplifiers to the question (AUQ630). These were Yes/No questions with follow-up questions as to which type of device had been used. Very few indicated use of cochlear implants or personal sound amplifiers in response to these questions. As a result, only responses about hearing aid use are presented here. In the 2011–12 and 2015–16 NHANES surveys, those who responded affirmatively about hearing aid use were asked about the frequency of hearing aid use over the past year (AUQ152). Those answering always to seldom were considered current hearing aids users and those who replied never were added to those who ever used hearing aids rather than treated as current hearing aid users. For the 2017–20 NHANES survey, AUQ153 had a similar follow-up question for frequency of hearing-aid use, but only over the preceding two weeks and responses were in terms of hours per day (< 1 to ≥ 8 h per day) with never being the last response alternative. Those answering never were handled as in the other two surveys. Finally, respondents were asked (AUQ154/156) whether they ever used assistive listening devices (Yes/No response) with these devices defined as “…FM systems, closed-captioned television, amplified telephone, relay services, or a sign-language interpreter” with “instant or text message” and “live video streaming” added, along with the qualification “because of hearing loss” in NHANES 2017–20.
In addition to including demographic variables of sex, age, and race/ethnicity in the fully adjusted logistic-regression analyses, measures of education level, diabetes, hypertension, smoking, noise exposure, cerumen impaction, and tympanogram abnormalities were included, with several of these additional hearing-loss risk factors defined as in Hoffman et al. (2017) for the analyses of the NHANES 2011–12 data. Specifically, participants were classified positive for diabetes and assigned a value of 1 (0 if negative) if they answered “yes” to “ever been told by a doctor or other health professional that you have diabetes” or “now taking diabetic pills to lower blood sugar” or had a 2-h fasting glucose readings ≥ 200 mg/dl at the time of the NHANES exam. Participants were classified positive for hypertension and assigned a value of 1 (0 if negative) if they answered “yes” to “Have you ever been told you have high blood pressure?” or “Are you taking a prescription for hypertension?” or, if during the MEC exam, the average of four blood pressure measurements was > 140 mmHg (systolic) or > 90 mmHg (diastolic). Smoking history was defined as “nonsmoker” (assigned 0) if the respondent answered “no” to “Have you smoked at least 100 cigarettes in your life?” Current and former smokers were divided into two groups, < 20 pack-years (assigned 1) and ≥20 pack-years (assigned 2). Although Hoffman et al. (2017) included education level as a covariate, the NHANES 2017–20 dataset coded the education level for adults differently from prior cycles. The education levels for the two earlier datasets were recoded to match those for 2017–20. Specifically, education levels were: (1) less than 9th grade; (2) 9th to 11th grade; (3) high-school graduate (including General Education Diploma, GED); (4) some college, including associates degree; and (5) college graduate.
In addition to those measures included in Hoffman et al. (2017), two other measures were generated. One was based on the presence of impacted cerumen, defined as no portion of the eardrum being visible upon otoscopic examination by the technician. An additional measure was included to quantify the status of the middle ear. Tympanograms were designated as abnormal if the tympanogram width exceeded 150 daPa, middle-ear pressure was ≤ −200 daPa, or static compliance was less than 0.2 ml (Shanks & Shohet, 2009; Wiley et al., 1996). Only those tympanograms judged subsequently by an audiologist to be of good or adequate quality were included. Because the otoscopic and tympanogram measures were ear-specific, the logistic-regression analyses for PTA4 were also ear-specific. That is, the logistic-regression analyses evaluated the effects of various variables on the better-ear PTA4 using otoscopy and tympanograms for the better ear.
Given the possible effect of income on the use of hearing aids and ALDs, a measure of annual family income was included. NHANES 2017–20 only included income information as an income-to-poverty ratio, information that is also included in the other two NHANES surveys. As a result, this was the income measure applied across all three NHANES surveys. NHANES used poverty guidelines, which vary by family size and geographic location, published annually by the U.S. Department of Health and Human Services. Population quintiles were generated to establish the following five levels of income based on the family income to poverty ratio: (1) ratio < 1.0; (2) 1 ≤ ratio < 2; (3) 2 ≤ ratio < 3.5; (4) 3.5 ≤ ratio <5; (5) ratio = 5.
Data Analysis
All prevalence estimates and statistical analyses presented here were performed in accordance with the National Health and Nutrition Examination Survey: Analytic Guidelines, 2011–2014 and 2015–2016 published online on December 14, 2018, by the NCHS and National Health and Nutrition Examination Survey, 2017-March 2020 Prepandemic File: Sample Design, Estimation, and Analytic Guidelines (Akinbami et al., 2022). Statistical analyses were performed using SAS version 9.4 (SAS Institute, Inc., Cary, NC). This included the use of masked strata and cluster variables for the design and the use of the adjusted sample weights provided for each participant by the NCHS. Sample weights for the 2011–12 and 2015–16 datasets were adjusted as recommended when combined (each cycle's 2-year weights divided by 2) whereas the sample weights for the 2017–2020 dataset were unaltered. This treatment of sample weights arises from the focus on HTLs which were obtained from adults with non-overlapping age ranges across the NHANES datasets: adults 20 to 69 years of age in the two earlier NHANES datasets versus adults 70 to 80 + years in the most recent dataset. In addition, as recommended by the NCHS, the lowest common denominator guided the choice of which set of sample weights to use and, given the focus on audiometric data attained in the MEC, the MEC sample weights were used here.
The full set of data from 35,287 adults was included in the dataset to be analyzed with restriction to those at least 20 years of age and with completed audiograms designated via domain specifications in the SAS analyses. Variance estimation was accomplished using the recommended Taylor-series linearization method. The 95% confidence intervals were those generated by SAS 9.4 based on standard errors estimated by linear interpolation of a normal distribution [i.e., standard error = ((p*q)/N)1/2, where p is the proportion of interest, 0.5 for the median, and q = 1−p, also 0.5 for the case of the median, and N is the number of cases]. Hoffman et al. (2010) noted that the standard error and resulting confidence intervals derived from such standard errors provided appropriate estimates of the confidence intervals.
Several binary logistic-regression analyses were performed to identify factors affecting the presence of hearing loss, either as defined audiometrically or for by self-report, and the self-reported use of hearing aids or ALDs. The “better-ear PTA4” was established by computing the PTA4 for each ear and then selecting the minimum of the two values as the “better ear” value (Stevens et al., 2013; WHO, 1991, 2021).
It is challenging to identify a goodness-of-fit metric for logistic-regression models applied to complex survey data like NHANES. SAS Version 9.4 (SAS Institute, Inc., Cary, NC) was used here. The SAS output provides a test of the global null hypothesis (Beta = 0) and this test was significant for all of the logistic-regression models provided here [minimum F (14.6, 832.4) = 19.6, p < .0001; second-order Rao-Scott design correction applied]. The “max-rescaled R2” statistic, a pseudo-R2 value, ranged from 0.20 to 0.53 indicating reasonable fits. Finally, the concordance between predicted and observed probabilities for the logistic-regression models ranged from 75.1 to 95.1%, further supporting good fits for all models.
A minimum events-per-variable ratio of 10 is frequently recommended for logistic-regression analyses to ensure stability of the solution (Harrell et al., 1984, 1996; Peduzzi et al., 1996), although this guideline was not developed from consideration of complex survey designs such as that employed by NHANES. All events-per-variable ratios exceeded 20.
Results
Self-Reported Hearing Trouble
Figure 1 provides the prevalence of each response for item AUQ054, General Condition of Hearing. In Figure 1 and elsewhere, blue vertical bars present data for males and pink vertical bars present data for females. Also, unless noted otherwise, error bars in Figure 1 and elsewhere represent 95% confidence intervals. In Figure 1, and other figures with prevalence estimates, percentages and confidence intervals are provided in tabular form in the supplementary materials.
The aggregate data from all 8,793 adults with responses to this item in the surveys appear in the bottom right panel whereas the other panels show the results segregated by age decade. From age 20 to 59 years (left panels), the predominant responses were either “excellent” or “good” with the response distributions gradually shifting to greater degrees of hearing difficulty with increase in age decade. About 75–80% of U.S. adults reported their hearing to be either “excellent” or “good,” the remainder indicating some amount of trouble hearing, from “a little” to “deaf.”
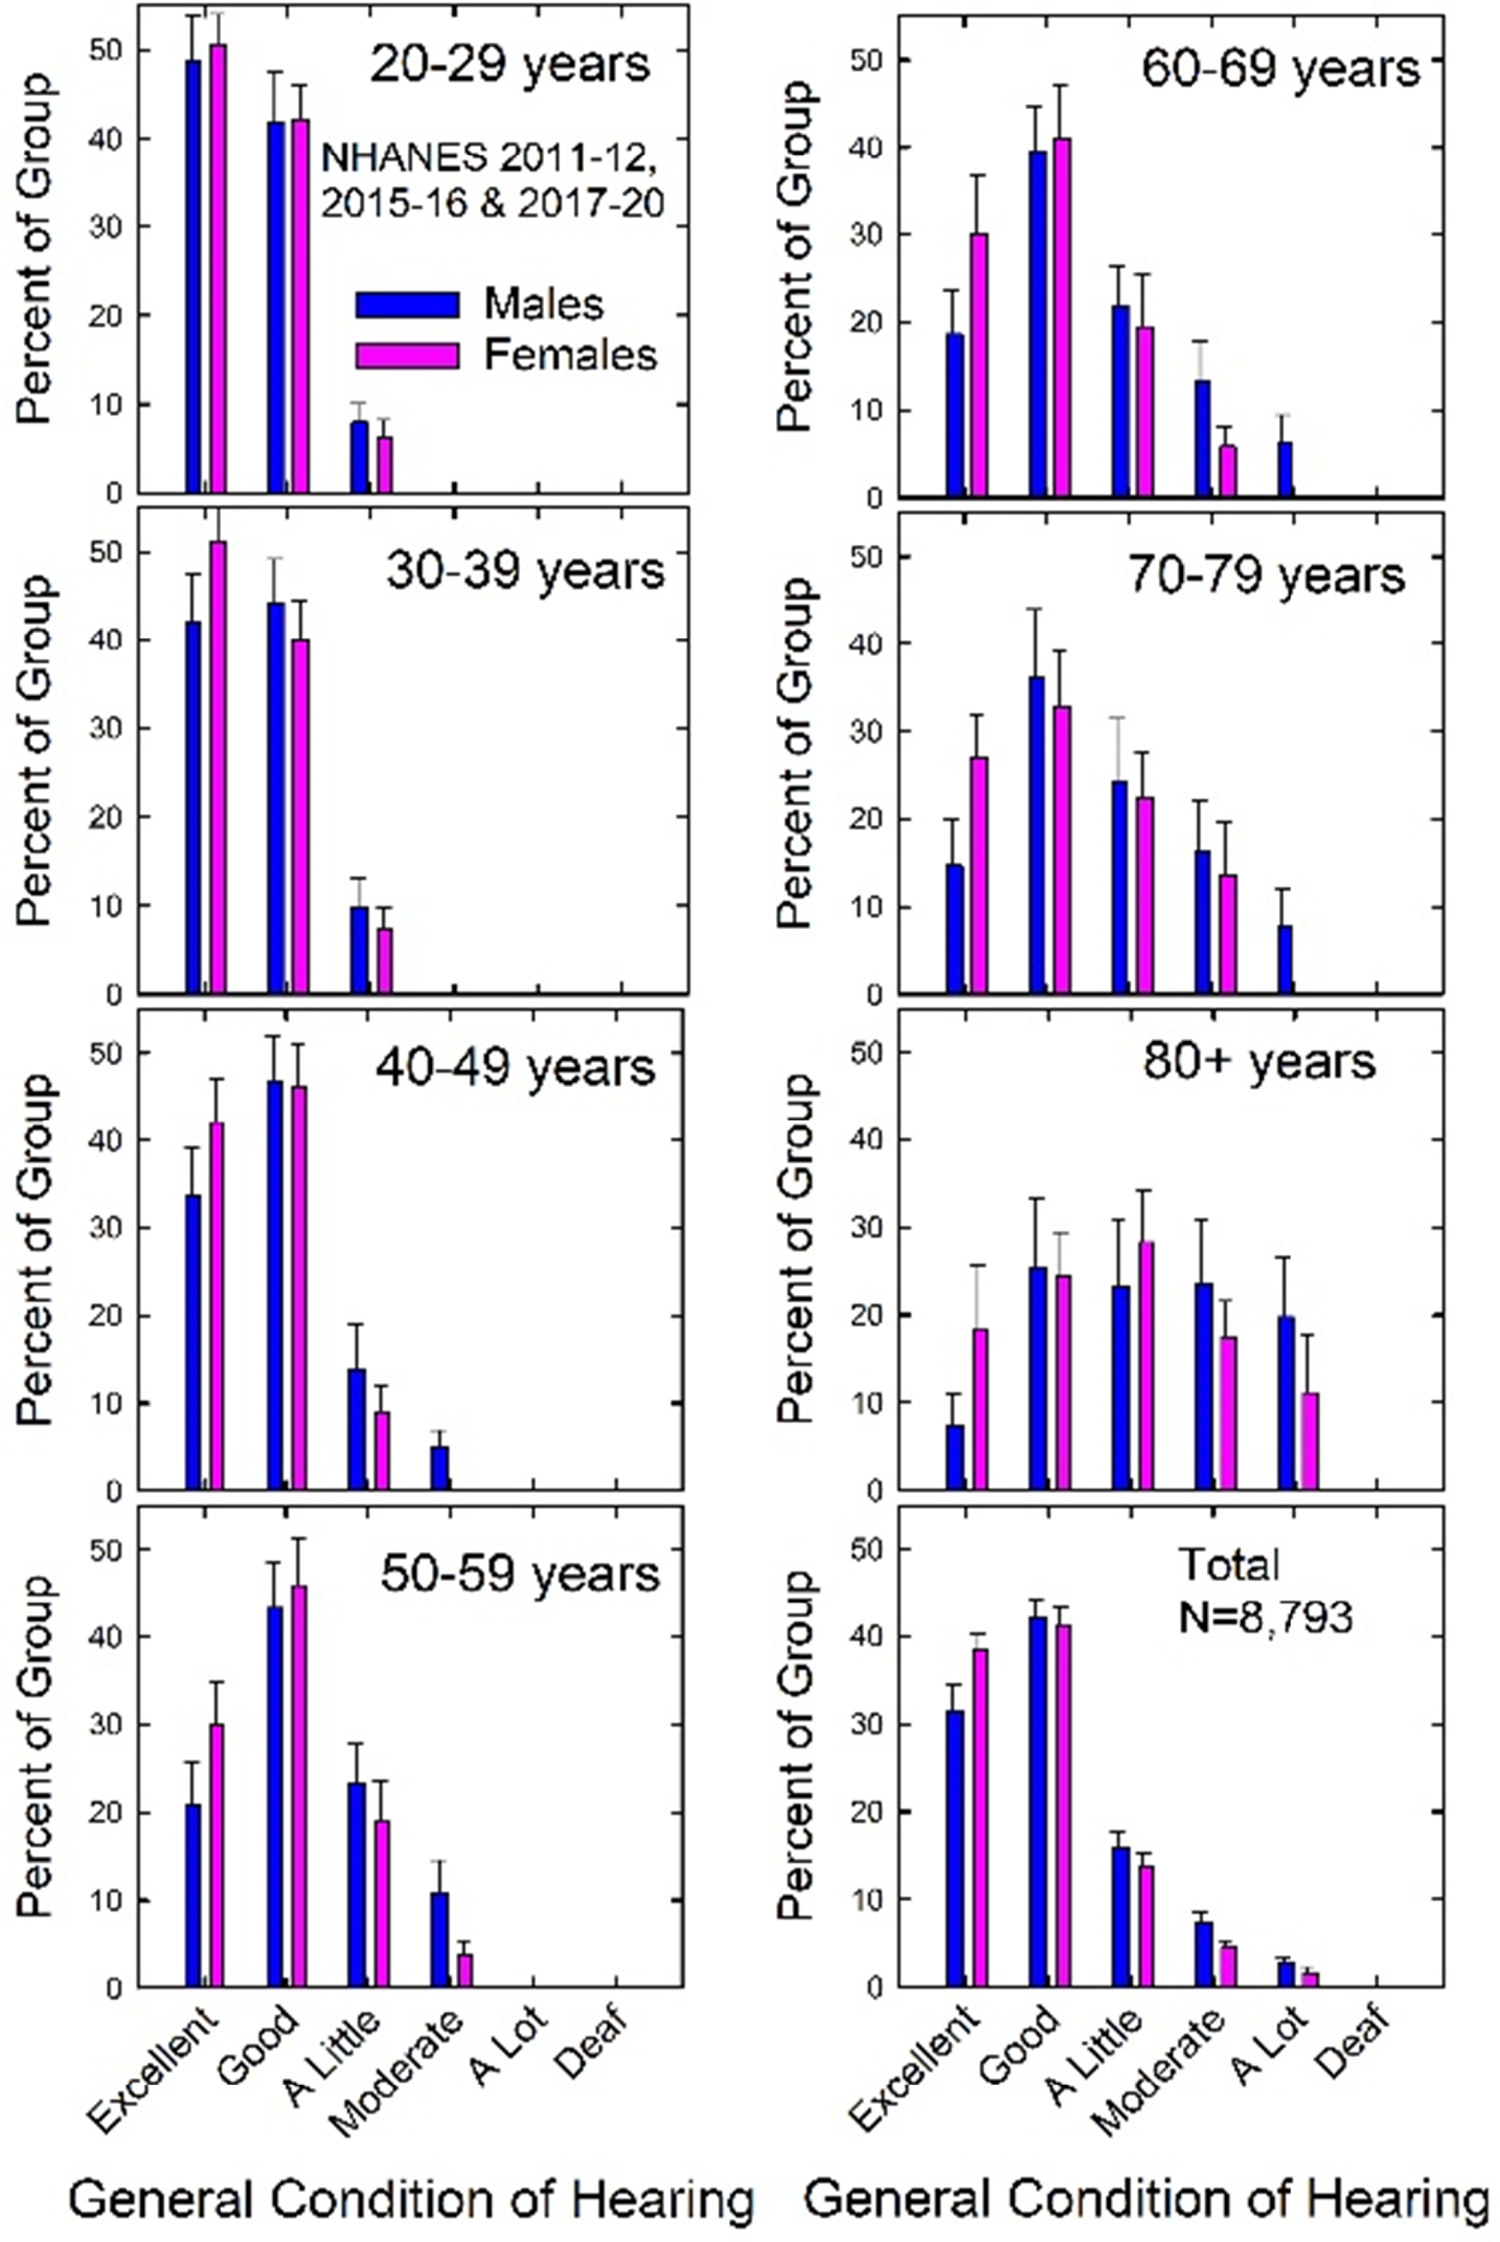
Prevalence of self-reported hearing trouble for males and females for each age decade and for all males and females (“Total”). In all figures, error bars = 95% confidence intervals.
Although a cut-off point of at least “a little trouble” has been applied consistently in many prior studies of other NHANES datasets, the cut-off point was further evaluated here before proceeding. To do this, responses to separate questions about the frequency of hearing difficulty for conversations in noise and the frequency of frustration with hearing while talking were examined. The response choices ranged from always (1) to never (5) for both questions, such that higher scores were associated with less frequent problems. For the question about difficulty for conversations in noise, median responses (95% confidence intervals in parentheses) using these ordinal scales were 3.84 (3.75, 3.93) and 2.47 (2.35, 2.61) for the no-trouble-hearing and trouble-hearing subgroups, respectively. For the question about frustration with hearing while talking, median responses were 4.35 (4.29, 4.41) and 3.30 (3.17, 3.43) for the no-trouble-hearing and trouble-hearing subgroups, respectively. The medians were nearly identical for males and females. For both questions and both males and females, the medians of the trouble-hearing subgroup were significantly lower than those for the no-trouble-hearing subgroup indicating that problems were significantly more frequent for those who had reported trouble hearing. The difference between subgroup medians was at least one point on each 5-point scale. For both the males and females and both questions, the subgroup with no reported trouble hearing exhibited median scores approximating “seldom” (4.0), whereas the subgroup reporting trouble hearing gave median responses approximating “about half the time” (3.0) or “usually” (2.0). These data from responses to questions pertaining to hearing, but independent of the question about overall trouble hearing, support the criterion used to form the no-trouble-hearing and trouble-hearing subgroups.
Figure 2 shows the percentage of males and females in each age decade, as well as across all ages (“ALL”), with self-reported trouble hearing. For both males (blue) and females (pink) the prevalence of trouble hearing increased steadily across age groups. Overall, about 26% of males and a little over 20% of females, aged 20 to 80 + years, had self-reported trouble hearing.
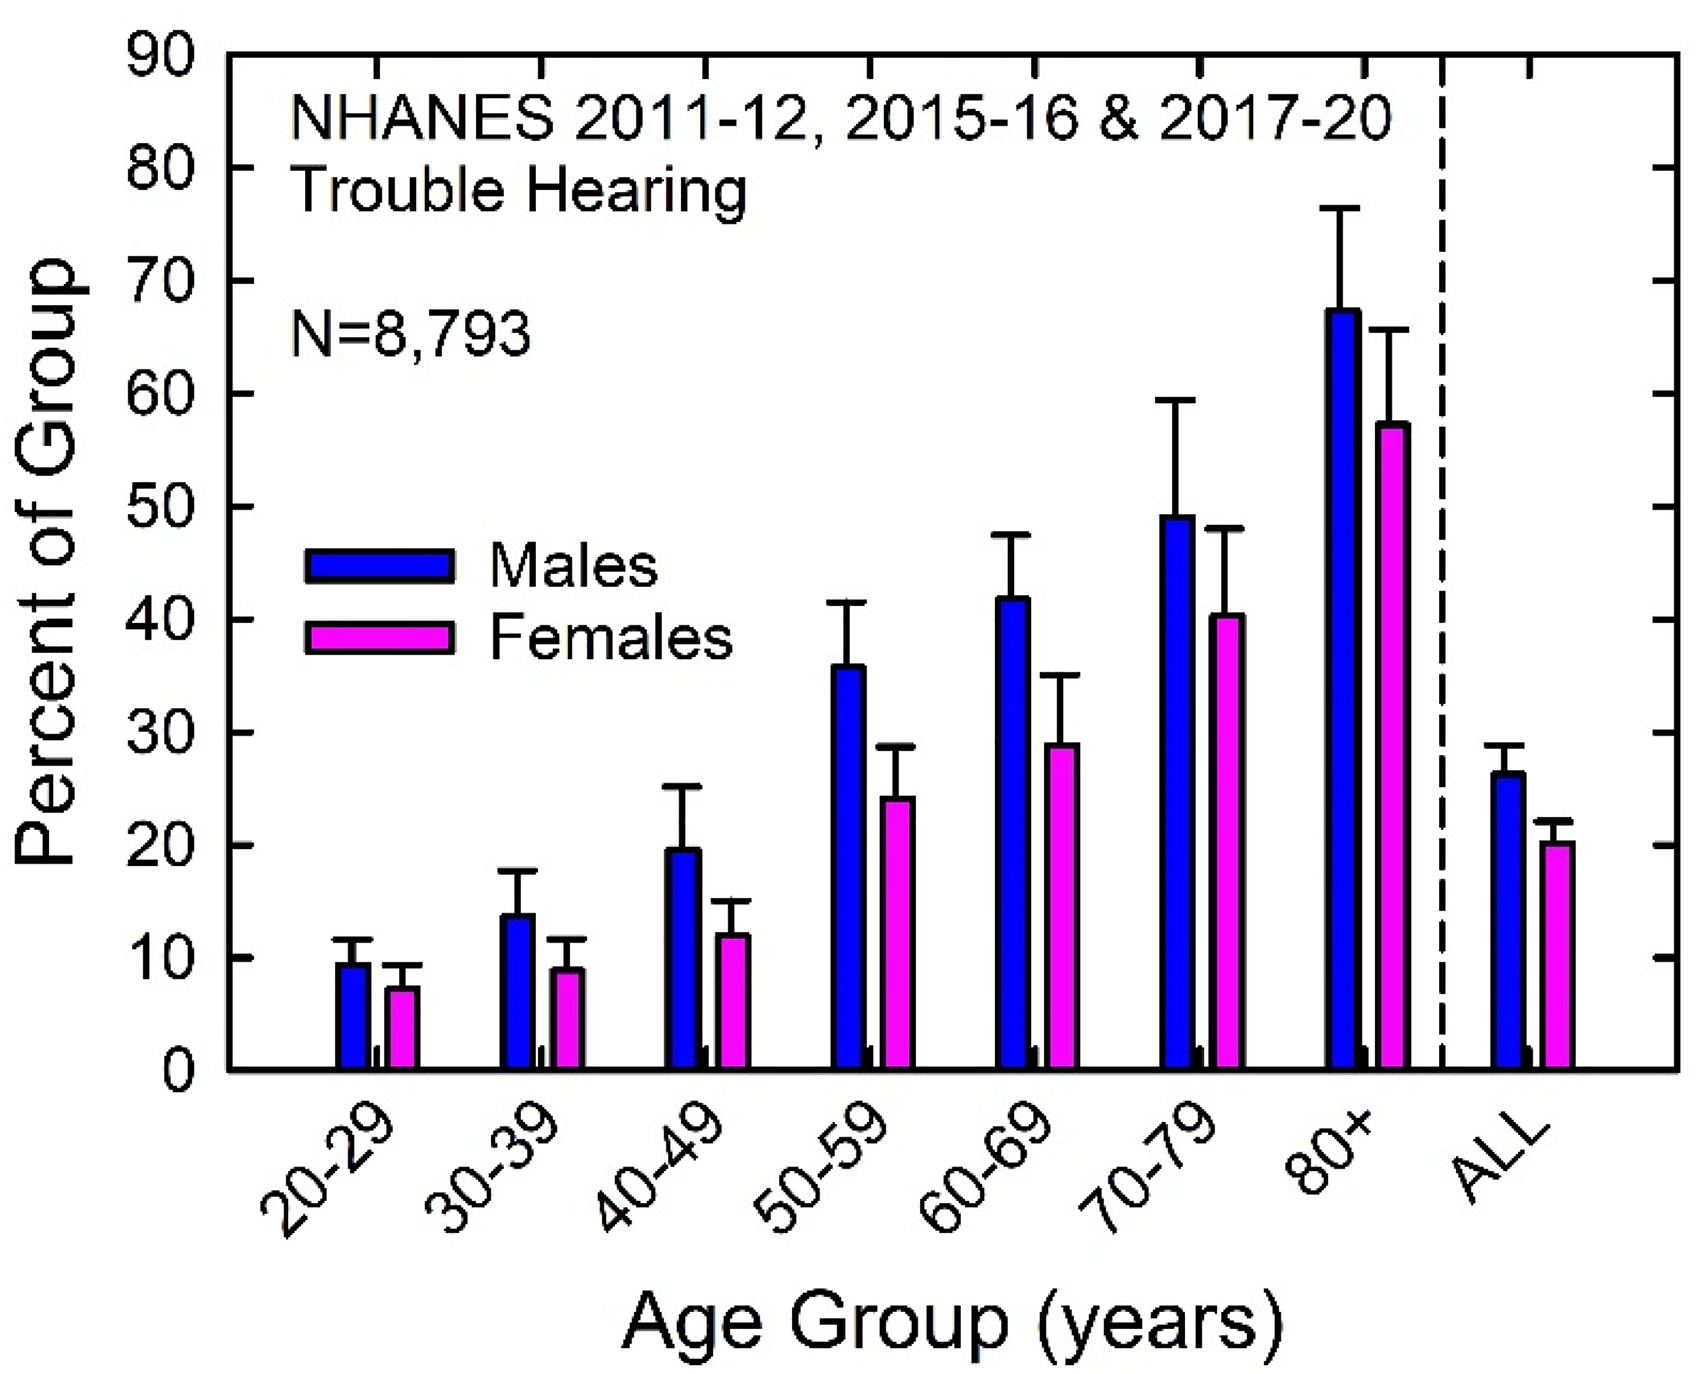
Prevalence of self-reported trouble hearing among U.S. adults 20 to 80 + years of age.
Audiometric Hearing Loss
Figure 3 shows the prevalence of each WHO-HI grade for males and females for each age decade and overall (“Total”) for the 8,795 adults with complete audiograms. As was observed for self-reported trouble hearing, the distributions are concentrated at “normal” over the range 20–59 years of age (left panels) and then begin to spread across grades between 60 and 80 + years of age. Very few males or females 80 + years of age had normal hearing as defined audiometrically. The aggregate data in the lower right panel indicate that about 80% of males and 85% of females had normal hearing based on the WHO-HI grade system. The balance mostly fell in the “mild” or “moderate” WHO-HI grades.

Prevalence of each WHO-HI grade among U.S. males and females for each age decade and overall (“Total”).
Figure 4 shows the prevalence of impaired hearing, defined as better-ear PTA4 ≥ 20 dB HL, for U.S. males and females for each age decade and in aggregate (“ALL”). As expected, the prevalence of impaired hearing increased with age decade for both males and females. Females consistently had a lower prevalence of impaired hearing for each age decade and in aggregate. Overall, about 23% of adult males and 17% of adult females between the ages of 20 and 80 + years had impaired hearing.

Prevalence of impaired hearing based on WHO-HI criteria for U.S. males and females.
There are many similarities in the prevalence patterns for males and females, across age decades, and in aggregate, for self-reported trouble hearing (Figures 1 and 2) and WHO-HI-defined impaired hearing (Figures 3 and 4). To compare these two classification systems, each of the 6-point classification scales was converted to a 5-point scale. For self-reported trouble hearing, the “excellent” and “good” responses were combined, as collectively they correspond to the single WHO-HI grade of “normal”. For the WHO-HI grade system, very small percentages were found for the two most severe impairments, “severe” and “profound” (Figure 3) and these two were combined. Overall, the population-weighted correlation between the two classification scales was r = 0.61, indicating about 37% shared variance between self-reported and audiometrically quantified hearing ability.
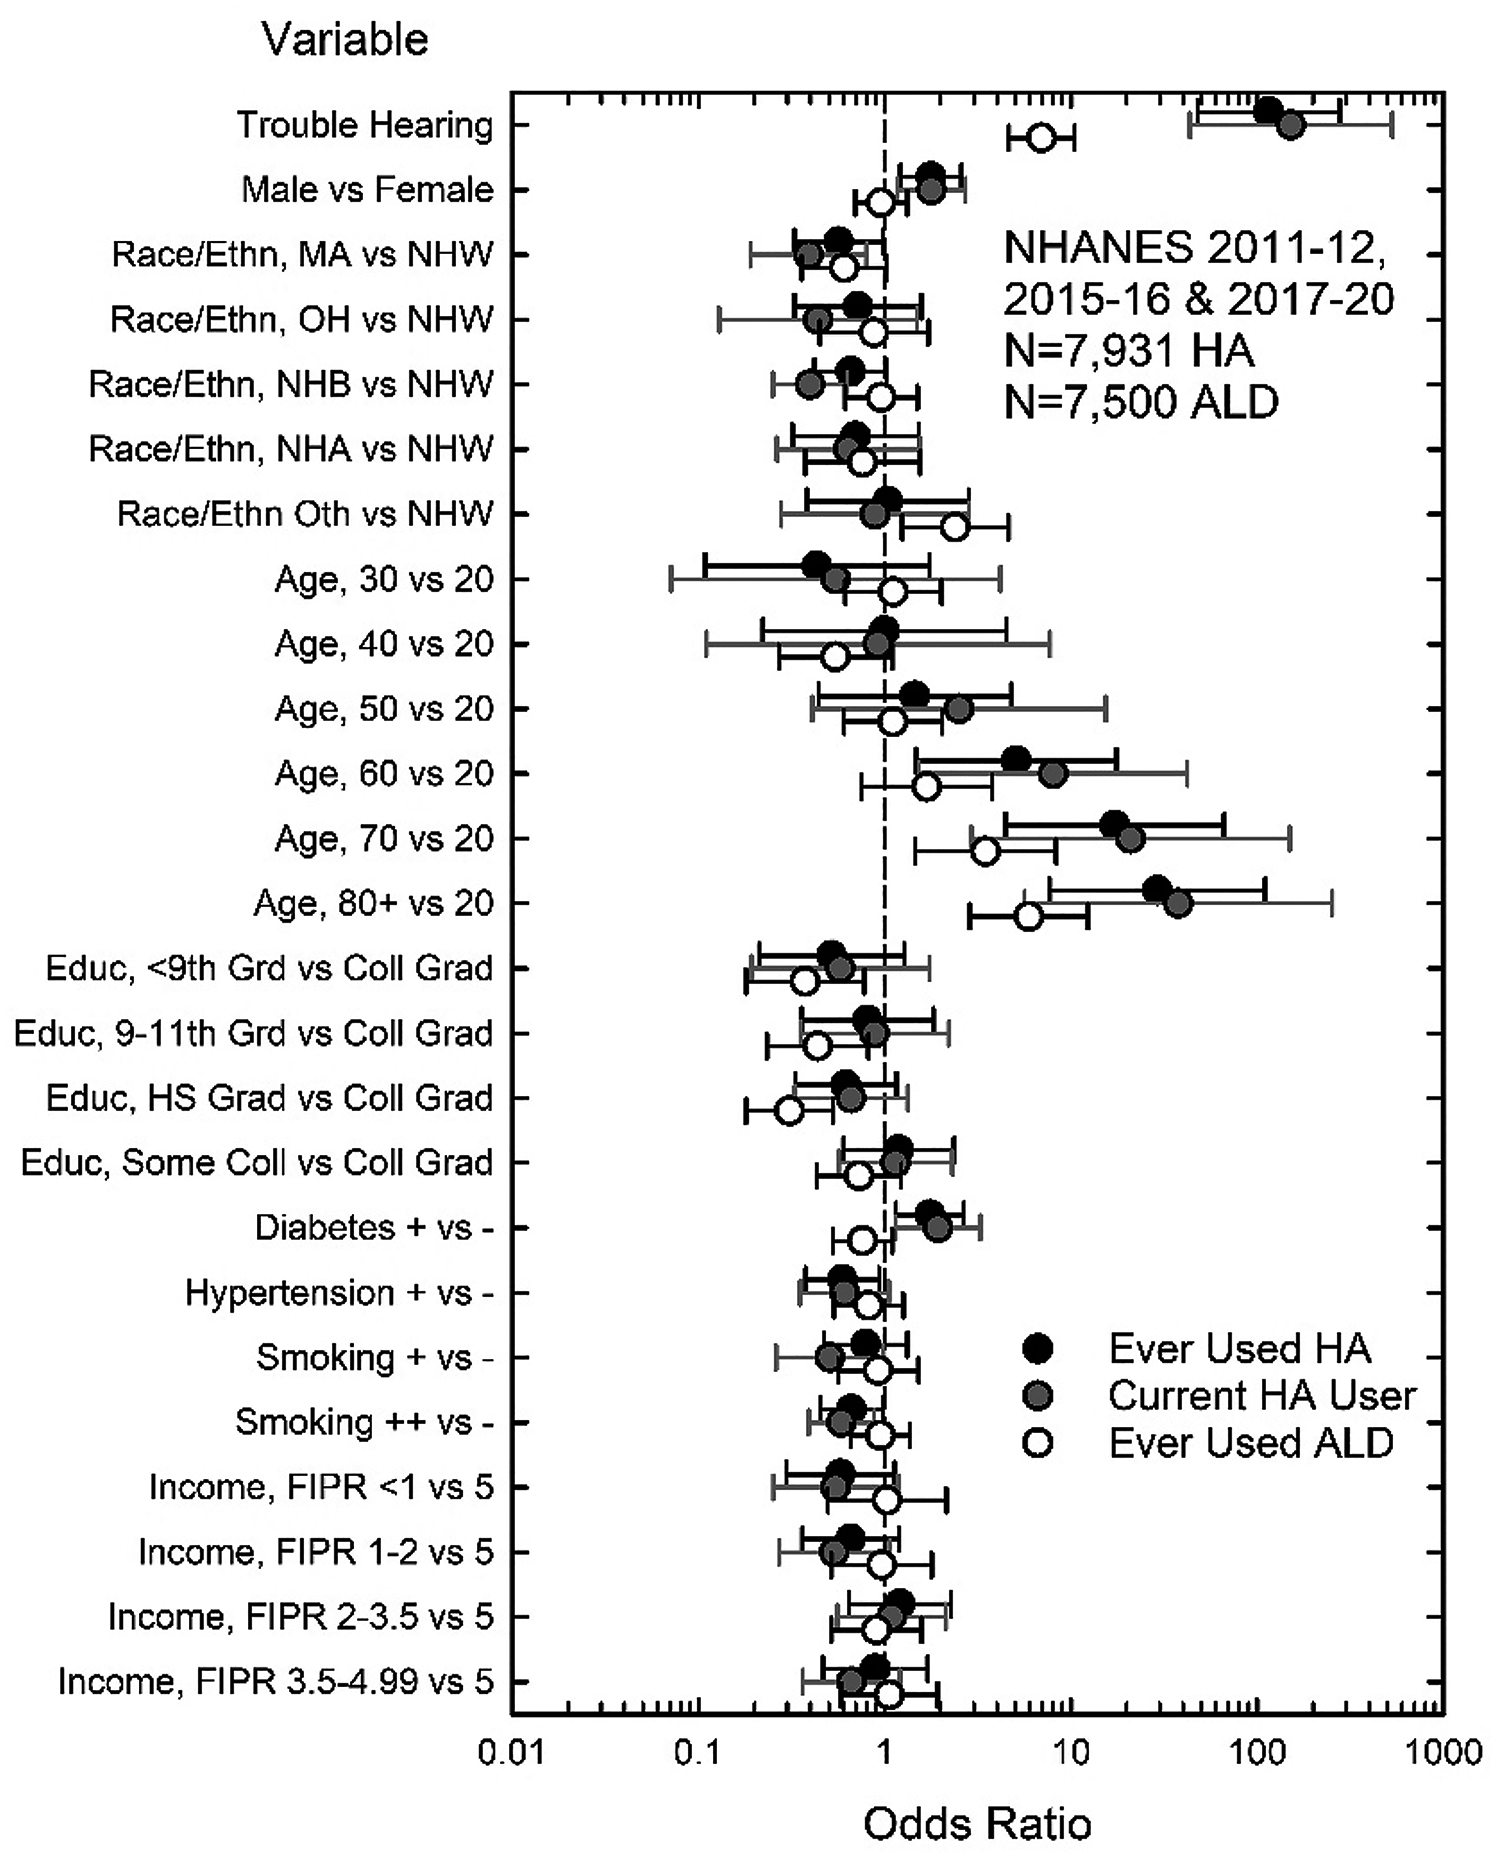
The variables that affected the odds of having self-reported trouble hearing or audiometrically defined impaired hearing were examined using binomial logistic regression. Several demographic, health, and noise-exposure variables were found to be significant. Figure 5 shows the odds ratios (ORs) for self-reported trouble hearing and better-ear PTA4 ≥ 20 dB HL. For these logistic-regression analyses and others presented below, tables of type-3 main effects and ORs are given in the Appendix.

Fully adjusted odds ratios (ORs) for the effect of several variables on the presence of trouble hearing (unfilled circles) and audiometric hearing loss (filled circles). Those ORs for which the 95% CIs do not cross the vertical dashed line at OR = 1.0 are significant at p < .05. Note. Additional information is provided in Tables A1 and A2.
The two most obvious effects on the odds of having trouble hearing are seen for age and race/ethnicity. The odds of having trouble hearing steadily and significantly increased for each age decade relative to the youngest decade. For race/ethnicity, four of the five ORs showed significant decreases in the odds of having trouble hearing relative to Non-Hispanic Whites (NHW). Only the OR for the Other-Non-Hispanic race/ethnicity (Oth) failed to differ from NHW. The smallest ORs were observed for Non-Hispanic Blacks and Asians (NHB, NHA). The next largest ORs in Figure 5 for trouble hearing were for positive histories of exposure to loud noise, both at work and off-work. Positive histories of noise exposure increased the odds of having trouble hearing by 50–75%. In addition, a positive history of hypertension, a positive history of diabetes, and lower education level all increased the odds of having self-reported hearing trouble by about 20–40%.
There are large increases in the odds of PTA4 ≥ 20 dB HL with increasing age decade. Whereas those aged 70 to over 80 years had about 10 times higher odds of having self-reported trouble hearing relative to 20- to 29-year-olds, the odds of audiometric hearing loss in these oldest age decades were at least 100 times higher than for the youngest age decade. For race/ethnicity, the OR for PTA4 ≥ 20 dB HL was only significantly lower for Non-Hispanic Blacks relative to Non-Hispanic Whites, the odds being about 50% lower. Level of education was the variable with the next largest effect on the odds for PTA4 ≥ 20 dB HL. Those with less than a college degree had significantly higher odds for PTA4 ≥ 20 dB HL than those with a college degree. A positive history of diabetes, work and off-work exposure to loud noise, better-ear cerumen impaction, and abnormal tympanograms in the better ear also significantly increased the odds for PTA4 ≥ 20 dB HL.
Use of Hearing Aids and ALDs
Prevalence estimates for various definitions of device usage are shown in Figure 6. Although not shown in Figure 6, the prevalence of current hearing-aid use was about 80–85% lower than the estimates shown for ever-using hearing aids. The two left panels depict the prevalence of ever using hearing aids (top) or ALDs (bottom) for each sex and age decade with aggregate values shown at the far right in each panel (ALL). The top-right panel shows the prevalence for ever having used both hearing aids and ALDs whereas the bottom right panel shows the prevalence for ever having used either of these devices. The prevalence estimates for using both devices in the top-right panel were only valid for the oldest age group and the aggregate data as the relative standard error exceeded 30% for the other age decades, due to small number of individuals who reported using both devices.
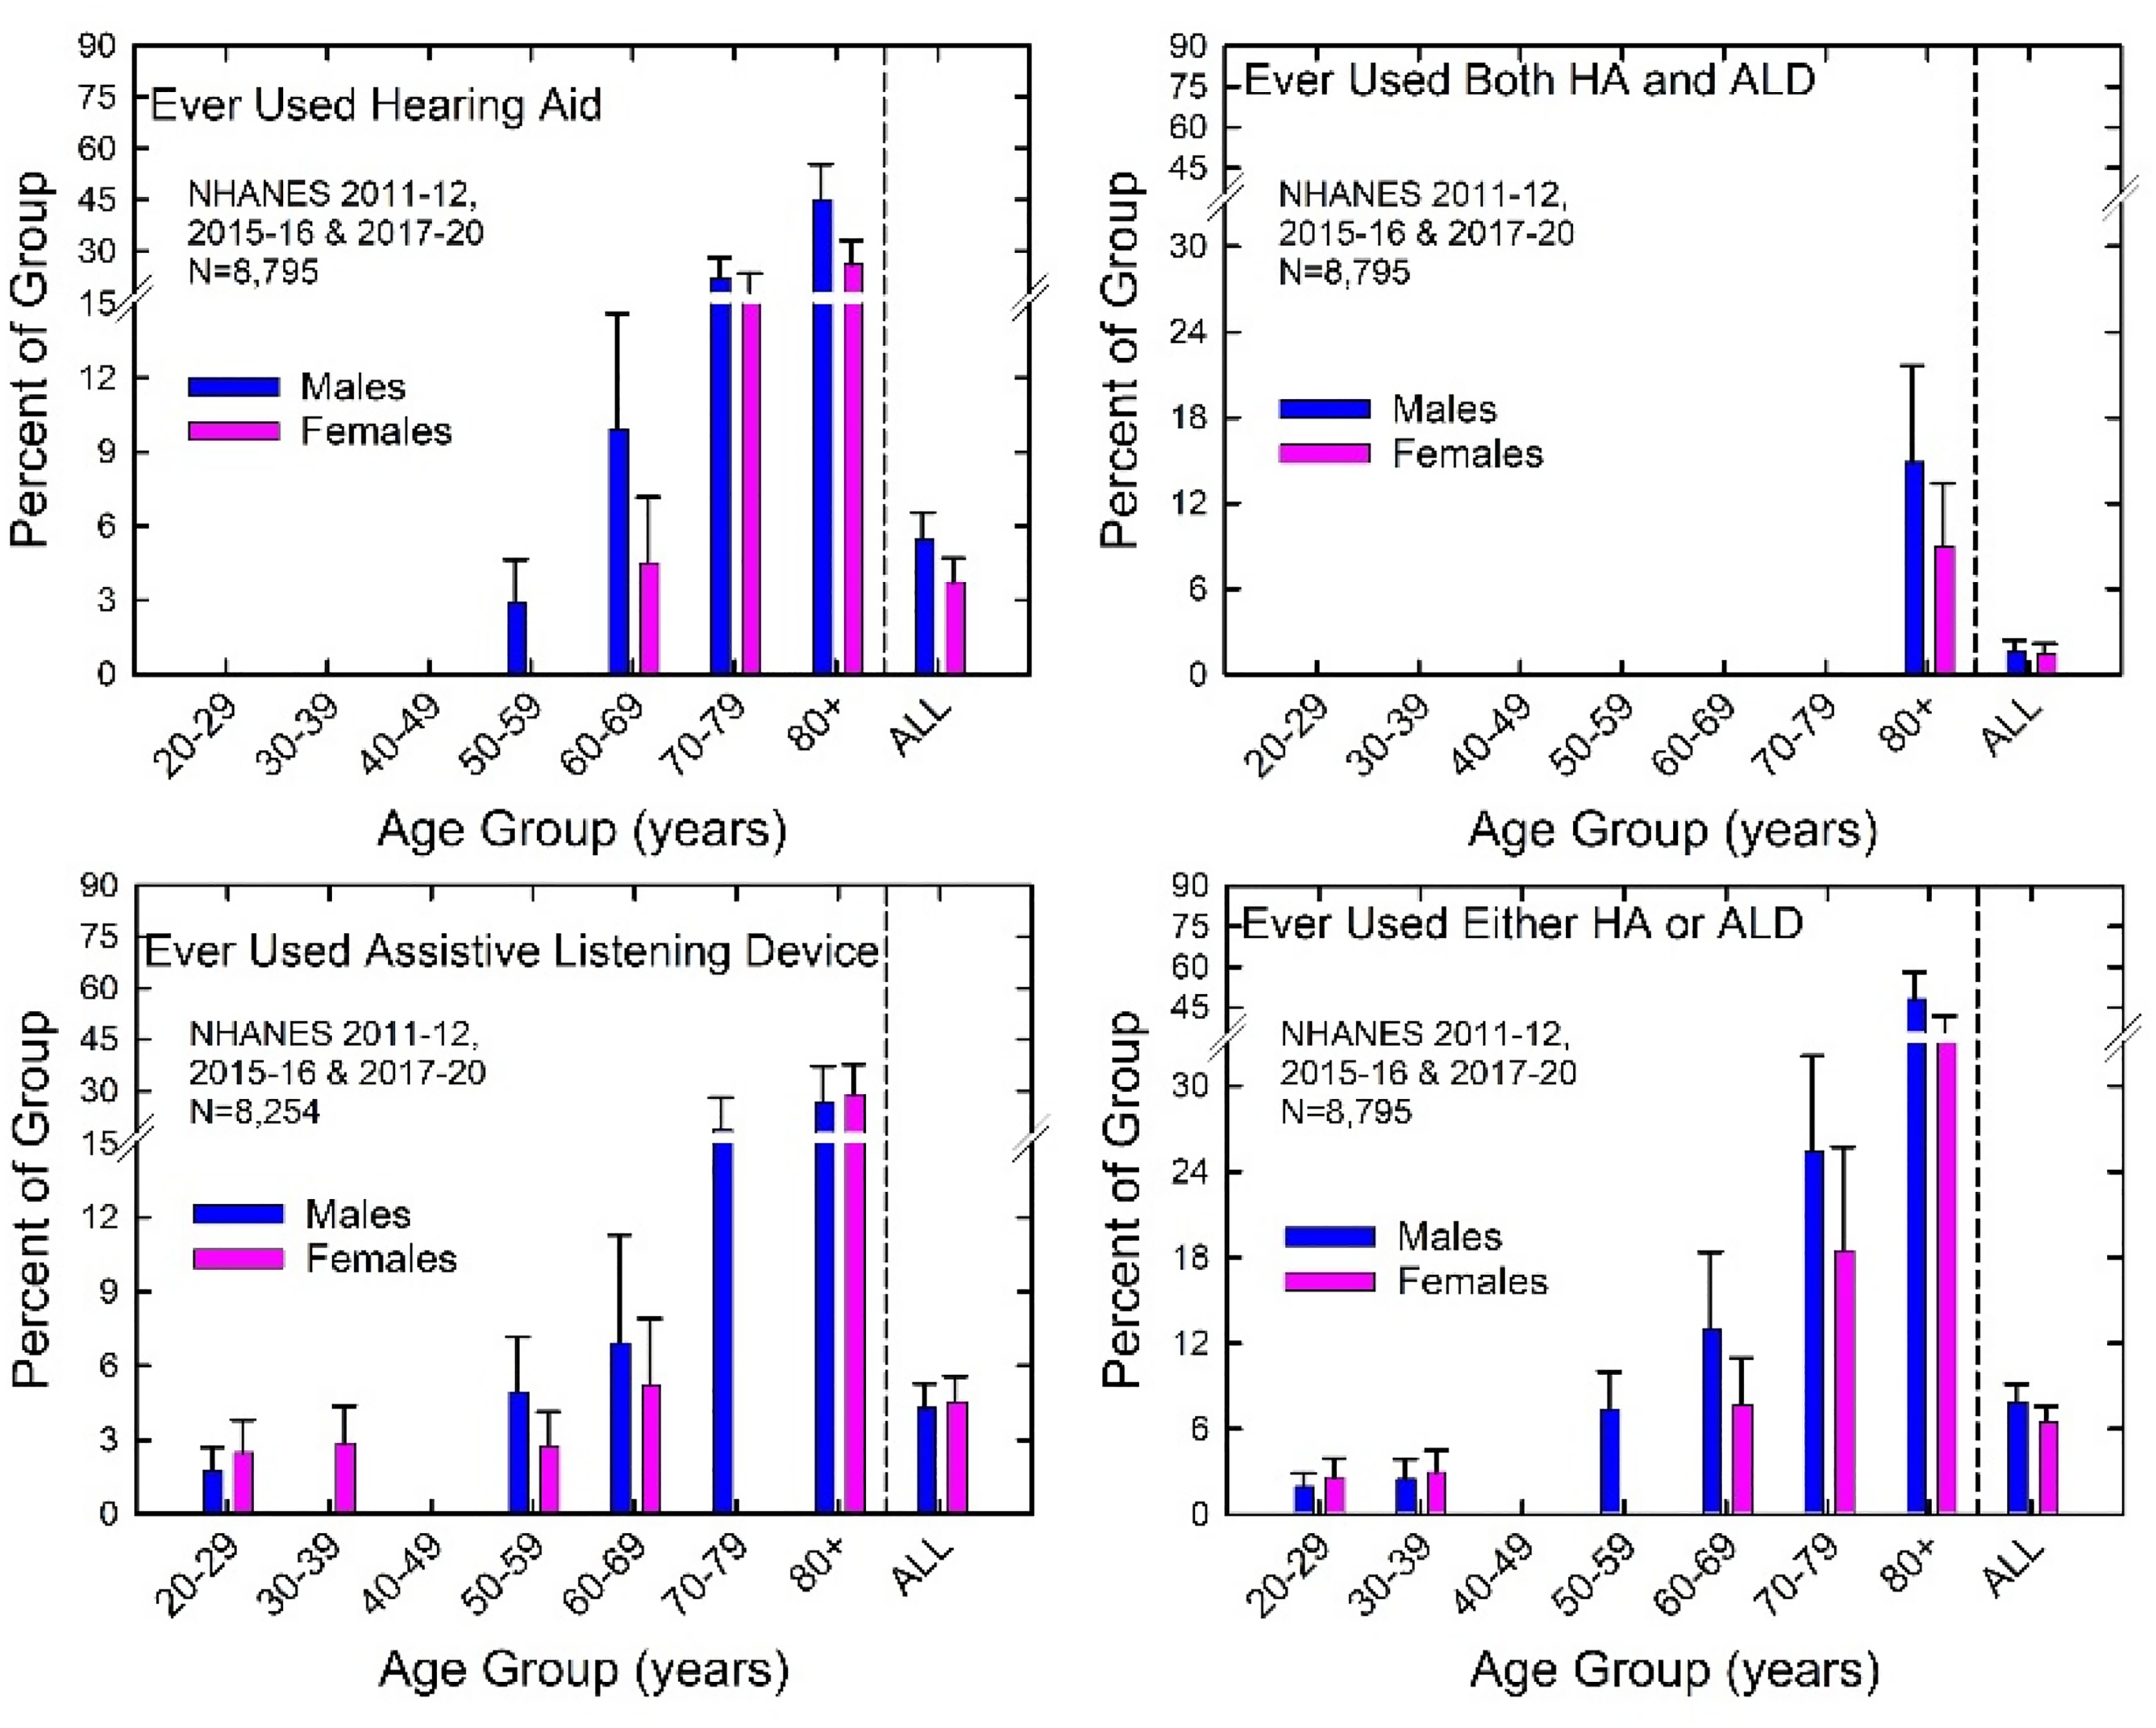
Prevalence of hearing-aid and ALD use for those who reported only use of hearing aids (top left), only ALDs (bottom left), both (top right), or either (bottom right). Missing prevalence estimates in each panel are all those for which the relative standard error exceeded 30%. HA = hearing aid.
The prevalence of device use increased steadily with age decade whether for hearing aids (top left) or ALDs (bottom left). The prevalence of ALD use was higher than that of hearing-aid use for those 59 years of age and younger, but this trend reversed among those in their 70 s and 80 s. Overall, the prevalence of device use was generally less than about 6%.
Binary logistic-regression analyses were performed for current hearing aid use, ever using hearing aids, and ever using ALDs. Given the moderate correlation between trouble hearing and PTA4 noted previously, collinearity concerns precluded the use of both these measures in multi-variable logistic-regression analyses. Unadjusted ORs were determined for trouble hearing and PTA4 alone and in combination for current hearing-aid use and ever using hearing aids or ALDs. In all the logistic-regression models for device use, the ORs for trouble hearing were five to twenty times larger than those for PTA4. This was also true when PTA4 replaced trouble hearing as the sole measure of impaired hearing in the multi-variable logistic-regression analyses. The ORs for PTA4 were significant, but considerably smaller than those for trouble hearing, while the ORs for the other variables in the model were largely unchanged when PTA4 replaced trouble hearing. As a result, only the models that used trouble hearing as a covariate are shown in all subsequent multi-variable logistic-regression analyses of device use.
Figure 7 shows the ORs for each of the three fully adjusted logistic-regression analyses of variables affecting device use. Generally, the pattern of ORs in Figure 7 was very similar whether current hearing-aid use (grey circles) or ever using hearing aids (black circles) was the dependent variable. Trouble hearing had the largest ORs for hearing-aid use, followed by age. For age, those 60 years of age and older had about 5–30 times greater odds of using hearing aids than those in their 20 s. Much smaller but significant ORs emerged for sex, males having greater odds for using hearing aids than females, race/ethnicity, both Mexican Americans and Non-Hispanic Black having lower odds for current hearing-aid use than Non-Hispanic Whites, and diabetes increasing the odds for hearing-aid use. A positive history of smoking for at least 20 pack-years significantly decreased the odds of hearing-aid use. This most likely reflects an underlying attitude toward one's own health rather than smoking per se decreasing the odds of hearing-aid use by reducing the need for hearing assistance.
Fully adjusted ORs for the effect of several variables on the current use of hearing aids (HA; grey circles), ever using HA (black circles), and ever using ALDs (white circles). Note. Additional information is provided in Tables A3 and A4.
For ever-using ALDs (unfilled circles), the ORs in Figure 7 follow a pattern that differs considerably from those found for the use of hearing aids. For example, although the ORs for trouble hearing and age were again the largest, the sizes of the ORs for ALD use were considerably smaller than for hearing-aid use. In addition, the OR for sex was not significant, whereas the ORs for education level were significant for ALD use. Those with less than some college education had significantly lower odds of using ALDs than college graduates. Race/ethnicity was also significant, Non-Hispanics of Other races having greater odds of using ALDs than Non-Hispanic Whites.
Unmet HHC Needs
This section presents estimates of the percentage of those with hearing needs who are not currently using hearing aids or have never used hearing devices. Such individuals are considered here to have unmet HHC needs. Because not all those who have ever used either device will still be using devices and because not all will have obtained sufficient benefit to eliminate their HHC needs, the estimates of “unmet HHC needs” described here are likely to be conservative.
Figure 8 shows the prevalence of unmet HHC needs for males (blue, top) and females (pink, bottom) when those needs were defined based on either self-reported trouble hearing (right panels) or better-ear PTA4 ≥ 20 dB HL (left panels). Results are shown for meeting those HHC needs through current hearing aid use, by ever using hearing aids, or by ever using ALDs. Although there are some differences between males and females and between device types, the overall pattern of results in all four panels is very similar. Unmet HHC needs were greatest below 70 years of age and the prevalence did not vary greatly for adults in the age range 20–69 years. Unmet HHC needs decreased considerably for the oldest two age decades due primarily to the greater uptake of devices by these two age groups (Figure 6). Overall, across all U.S. adults 20 to 80 + years of age with hearing difficulties, measured either audiometrically or by self-report, about 80–85% have unmet HHC needs.
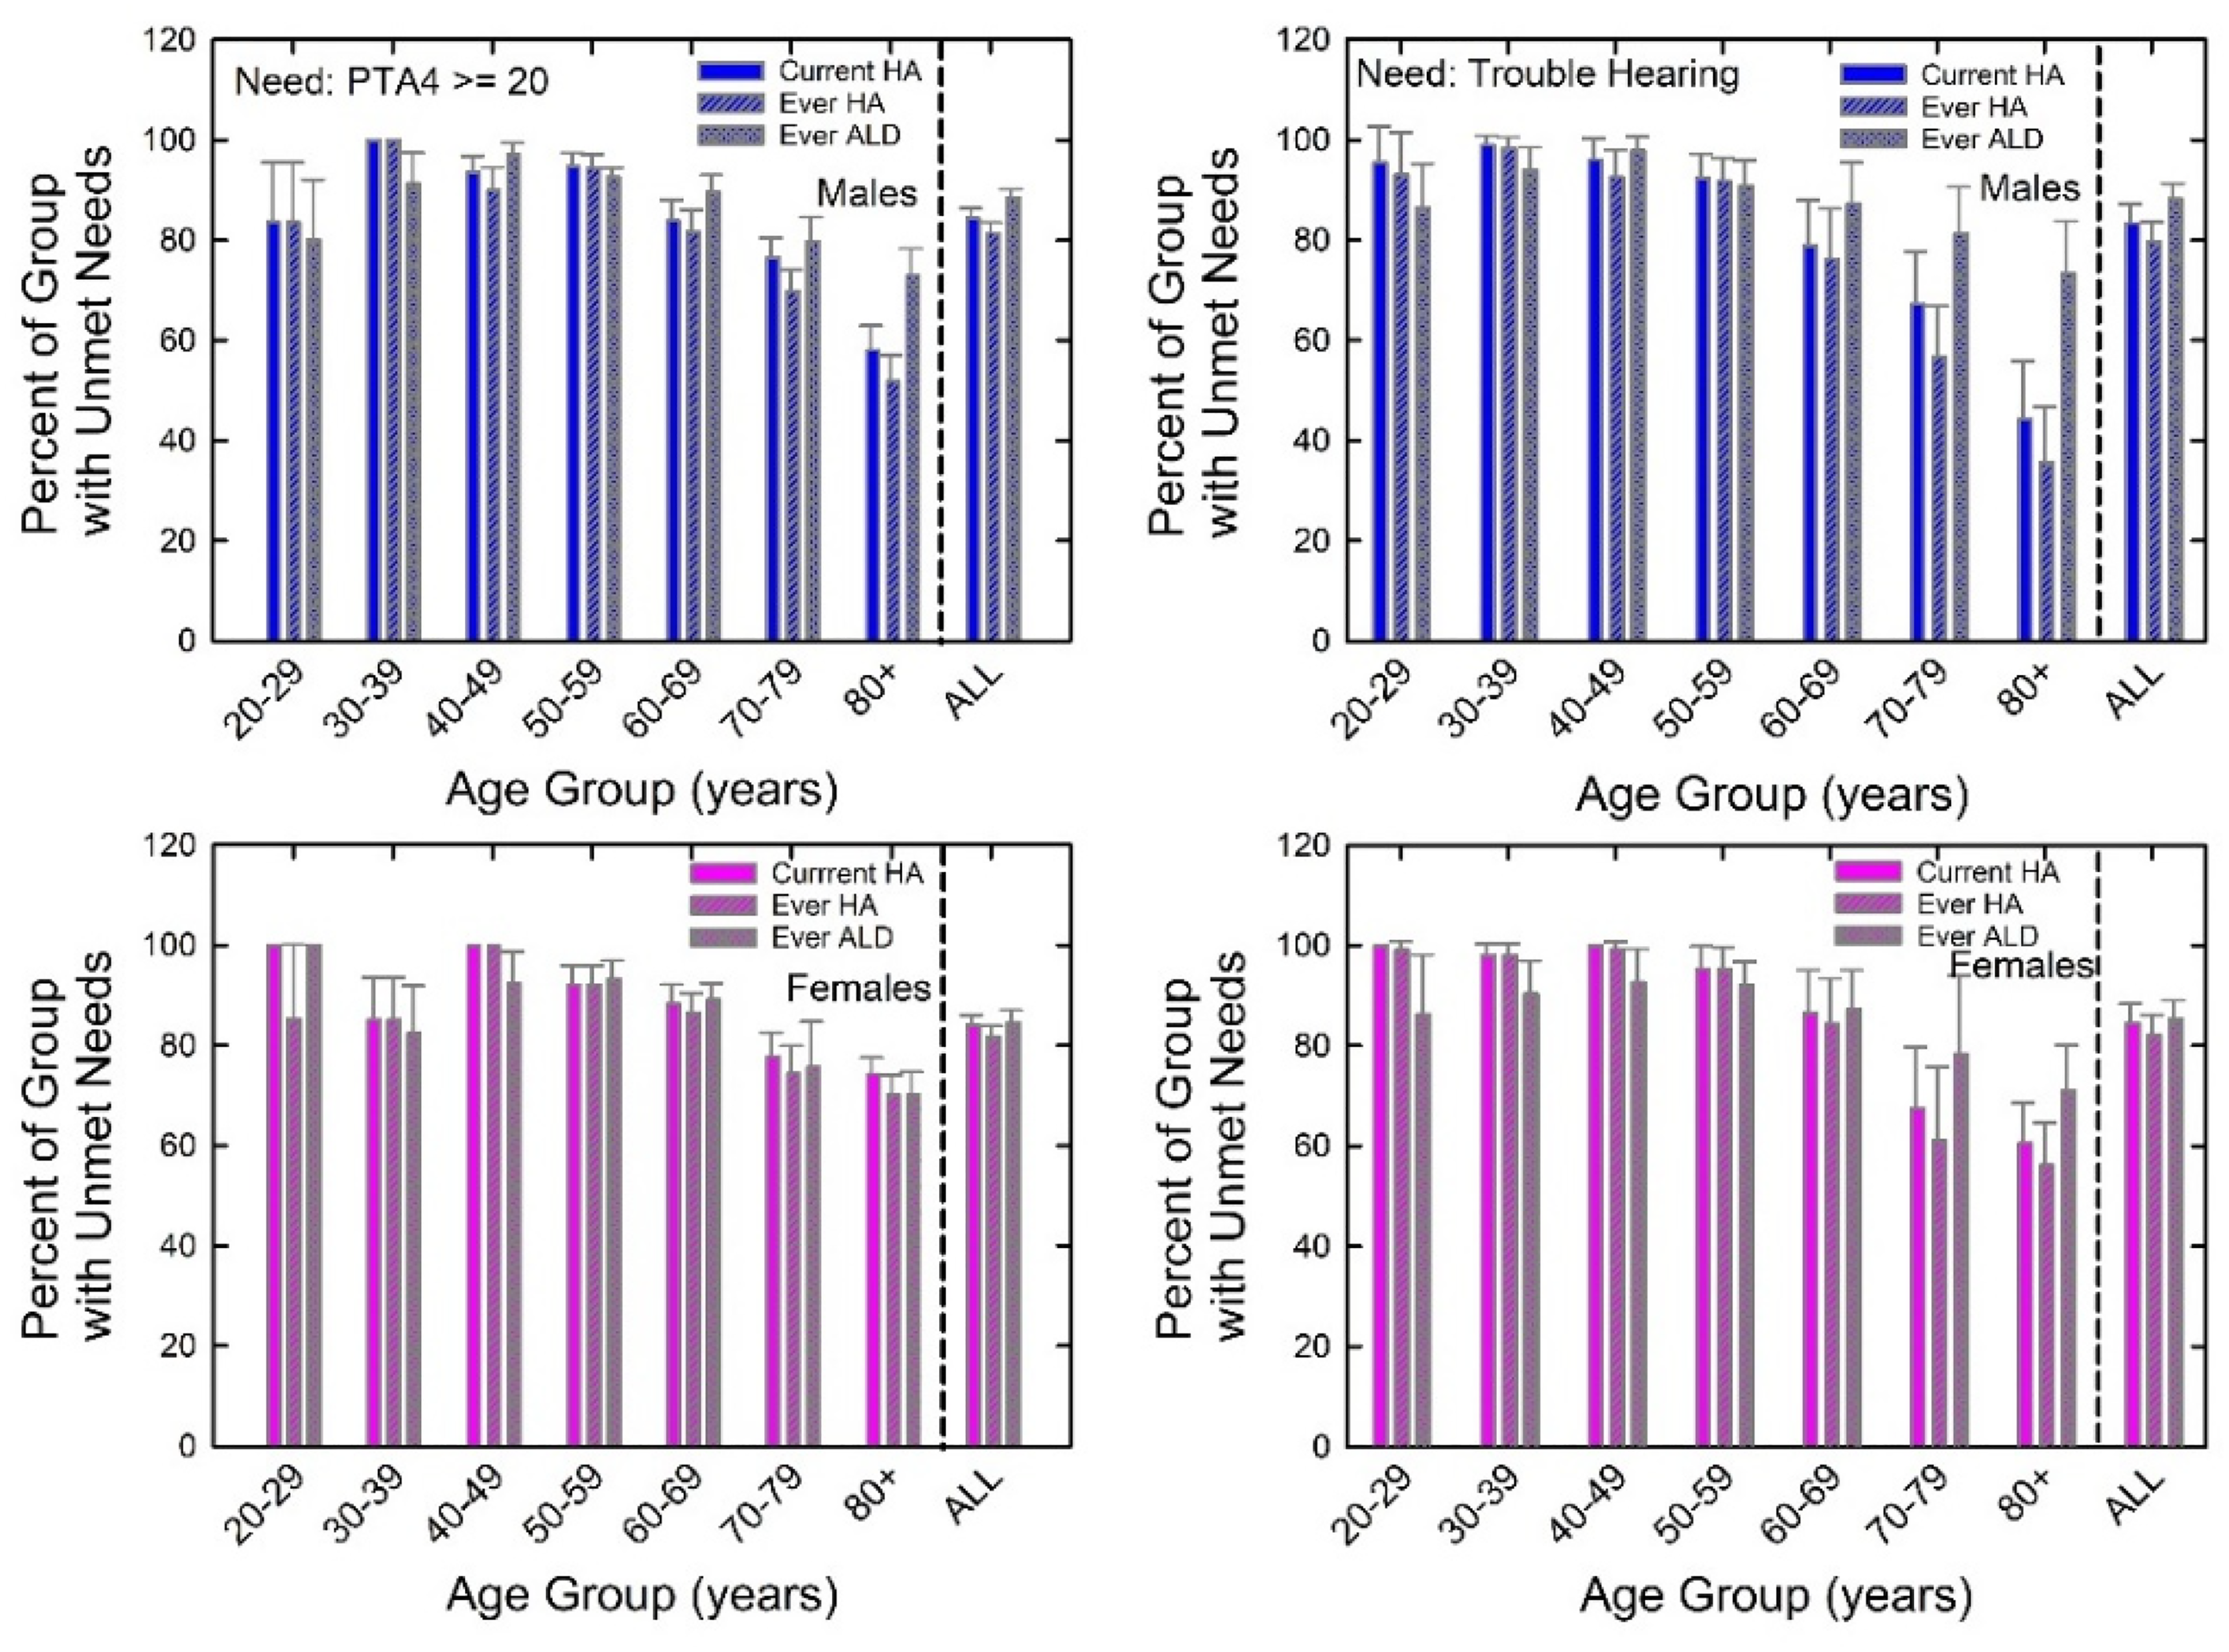
Prevalence of unmet HHC needs based on either self-reported hearing trouble (right panels) or audiometrically measured hearing impairment (left panels). Data are shown separately for males (top panels) and females (bottom panels) and for current hearing aid use, ever using hearing aids, or ever using ALDs. HA = hearing aid.
Figure 9 shows the prevalence of unmet HHC needs for varying degrees of audiometric hearing impairment (left panels) and different definitions of trouble hearing (right panels). Insufficient data were available for those with greater severities of hearing loss or hearing trouble. Unmet HHC needs are greatest among those with mild hearing loss and those reporting a little trouble hearing and unmet needs decrease as severity of hearing loss and hearing trouble increase. Even for moderate levels of impairment or trouble, 60–80% have HHC needs unmet by hearing-aid use. Regardless of hearing loss severity or amount of trouble hearing, ALDs are used much less frequently than hearing aids to meet those HHC needs.

As Figure 8, but with prevalence of unmet HHC needs as a function of severity of hearing loss (left) or trouble hearing (right).
With a focus on variables that might affect unmet HHC needs based on hearing-aid use, two additional logistic-regression analyses were performed. In both cases, need for help was defined audiometrically as better-ear PTA4 ≥ 20 dB HL. Of the 8,795 adults with complete audiograms, 1,768 had better-ear PTA4 ≥ 20 dB HL and 1,601 with complete data were included in the logistic-regression analyses of unmet HHC needs. Of the 1,601 adults with PTA4 ≥ 20 dB HL, those who met those HHC needs included 234 who had ever used hearing aids and 192 who were currently using hearing aids. The focus of these analyses was on the relatively smaller group, those with met HHC needs. What variables affected the odds for meeting HHC needs?
Figure 10 shows the results of the logistic-regression analyses of met HHC needs. For these analyses, variables affecting the odds for meeting HHC needs were identified among the 1,601 adults with hearing loss. Generally, the solutions for both current-use of ever-used hearing aids were very similar. Trouble hearing had the highest OR, those having perceived hearing trouble being 50–70 times more likely to currently be using or ever-used hearing aids than those without perceived trouble hearing. Age was the next strongest factor that emerged from these analyses, those 30 to 69 years of age having significantly lower odds for hearing-aid use than those 80 years of age and older. Neither the 20–29-year-olds nor the 70–79-year-olds had ORs that differed significantly from those 80 years of age and older. For the younger group, few had HHC needs based on PTA4 (Figure 4) and for the older group many met those needs with hearing aids (Figure 6). Race/ethnicity had some significant effects, reducing the odds for hearing-aid use for some groups relative to Non-Hispanic Whites (NHW), especially for current hearing-aid use. The presence of diabetes slightly increased the odds whereas the presence of hypertension slightly decreased the odds for hearing-aid use. Finally, there were no significant effects of sex, level of education, or family income.

Fully adjusted odds ratios ORs for the effect of several variables on met HHC needs either through current use of hearing aids (HA; grey circles) or ever using HA (black circles). Note. Additional information is provided in Tables A5 and A6.
Figure 11 presents the estimated numbers of adults with unmet HHC needs based on a total population estimate of 234.2 million adults in the U.S. in the age range 20 to 80 + years from 2011 through 2020. Unmet HHC needs were defined based on the audiogram (top panel) or trouble hearing (bottom panel) and never using hearing aids. The lowest number of adults with unmet HHC needs was found for an audiometric definition of need (top panel) with about 21 million males and 17 million females having unmet HHC needs. For unmet HHC needs based on trouble hearing (bottom panel), about 23 million males and 19 million females had unmet HHC needs.

Estimated number of adults with unmet HHC needs defined based on audiometric hearing loss (top) or perceived hearing trouble (bottom) and ever using HA as meeting those needs.
Regardless of how unmet HHC needs are defined, millions of U.S. adults with hearing difficulties have unmet HHC needs in the prevailing HHC system. An interesting feature of the data shown in Figure 11 is that the age range with the greatest number of males and females with unmet HHC needs is 50 to 69 years. Although the prevalence estimates of self-reported and audiometrically measured hearing difficulties were both highest among the oldest adults, these same adults took up hearing aids (and ALDs) at the highest rate. The net effect was for the oldest two age decades to have fewer adults with unmet HHC needs compared to those aged 50–69 years. Unmet HHC needs are lowest for those 20–39 years of age largely because their HHC needs are much lower for these younger adults (Figures 2 and 4).
Discussion
The prevalence of audiometrically defined hearing loss in U.S. adults from NHANES data previously made use of a criterion of PTA4 > 25 dB HL and, separately, a criterion of PTA at 3000, 4000 and 6000 Hz > 25 dB HL (e.g., Hoffman et al., 2010, 2012, 2017). Prevalence estimates for the two PTA4-based criteria and perceived hearing trouble for NHANES 2011–12, 2015–16, and 2017–20 are shown in Figure 12. The estimates for PTA4 ≥ 20 dB HL and trouble hearing are shown in Figures 2 and 4, respectively. As expected, for the PTA4-based criteria, the prevalence of hearing loss is higher for a criterion of ≥ 20 dB HL than > 25 dB HL. The prevalence approximately doubled for the lower criterion for adults in their 40 s, 50 s, and 60 s, the difference in prevalence estimates declining for the oldest two age decades. Overall, the prevalence of audiometrically defined hearing loss based on PTA4 ≥ 20 dB HL was about 60% higher than that based on a criterion of > 25 dB HL.

Prevalence of audiometric hearing loss and trouble hearing for males (top) and females (bottom). Two different audiometric criteria are shown, the one used here (PTA4 ≥ 20 dB HL) and that used previously by Hoffman et al. (2010, 2017; PTA4 > 25 dB HL) in their analyses of NHANES data.
The difference in prevalence between either PTA4 criterion and perceived trouble hearing is more complex. This complex relationship is illustrated using PTA4 ≥ 20 dB HL as the hearing-loss criterion. Below an age of 60 years, the prevalence of trouble hearing exceeds that based on PTA4. Prevalence of hearing loss for PTA4 > 20 dB HL for 60–69-year-olds roughly equals that for perceived hearing trouble. At ages 70 to over 80 years, the trend reverses, PTA4-based prevalence exceeding the prevalence of perceived hearing trouble. When confined to the WHO criterion of better-ear PTA4 ≥ 20 dB HL used here for audiometrically defined hearing impairment, 23.4% of males and 17.0% of females between the ages of 20 and 80-plus years had impaired hearing. Based on the population estimate of 234.2 million adults, 112.6 million males and 121.6 million females, between the ages of 20 and 80-plus years in the U.S. from 2011 to 2020, 26.3 million males and 20.7 million females have audiometrically defined hearing loss in the U.S. For perceived trouble hearing, overall prevalence estimates were 25.7% and 19.4% for males and females, respectively. This results in 28.9 million males and 23.6 million females with perceived trouble hearing in the U.S.
The prevalence values in Figure 12 for better-ear PTA4 > 25 dB HL are very similar to those of Hoffman et al. (2017) in their analysis of the NHANES 2011–12 dataset, although those earlier prevalence values did not extend beyond 69 years of age. When the present dataset was constrained to the same age range, 20 to 69 years, the prevalence of better-ear PTA4 > 25 dB HL was 9.4% (95 CI: 7.8%, 10.9%), 4.6% (3.7%, 5.6%), and 7.0% (5.9%, 8.0%) for males, females, and overall, respectively. These estimates are slightly lower than those in Hoffman et al. (2017) for the same criterion and age range. Hoffman et al. (2017) referred to the better-ear PTA4 criterion as the “bilateral speech-frequency” criterion and reported prevalence rates of 9.9%, 5.1%, and 7.5% for males, females, and overall, respectively.
The focus of the present analyses was not on the way in which audiometrically defined prevalence of impaired hearing varies with audiometric definition of impaired hearing. Rather, the current WHO definition of various hearing-impairment grades (Figure 3), including the use of better-ear PTA4 ≥ 20 dB HL as the boundary between normal and impaired hearing (Figure 4), was used to estimate prevalence values for males and females for each age decade. Because audiometric hearing loss has been variously defined in the literature, Table 2 provides population-weighted prevalence estimates for some of the more commonly used audiometric definitions. Whereas the fence between normal and impaired hearing in most prior studies was 25 dB HL, the values in Table 2 are all based on 20 dB HL.
Population-Weighted Prevalence Values and 95% CIs for Males, Females, and Total Population of Adults with Ages from 20 to Over 80 Years.

All values are percentages. LCL and UCL represent the lower and upper 95% confidence levels, respectively. N = 8,795 (4,292 males and 4,503 females) with complete audiograms. PTA4 = pure-tone average for 500, 1000, 2000, and 4000 Hz. PTA346k = pure-tone average for 3000, 4000, and 6000 Hz. WHO unilateral hearing loss defined as better-ear PTA < 20 dB HL and worse-ear PTA ≥ 35 dB HL (WHO, 2021).
Although the details of the audiometric definition of impaired hearing applied here differ from those in earlier analyses of NHANES datasets, the general pattern of findings across these reports is similar, including the effects of various demographic, health, and noise-exposure variables on the odds of having audiometrically defined hearing impairment. For example, Agrawal et al. (2008, 2009) and Hoffman et al. (2017) reported that age and sex increased the odds for impaired audiometric hearing significantly, the former having a much larger effect than any other variable examined. The same was observed in this report. Further, these earlier studies found the odds for hearing impairment based on better-ear PTA4 > 25 dB HL to be significantly greater for men than for women, for those with positive histories of diabetes, for those with lower levels of education, and for various types of noise exposure, all of which were also observed here for the lower fence of better-ear PTA4 ≥ 20 dB HL.
The effects of better-ear cerumen impaction and better-ear tympanogram abnormality were found to be significant for better-ear PTA4 ≥ 20 dB HL but not for trouble hearing. It is not surprising that these effects were observed for PTA4, as both factors are likely to increase hearing thresholds. Prior analyses that included these variables for NHANES data could not be found. When the better-ear PTA4 criterion was raised to 25 dB HL, as in all prior analyses of NHANES data, the OR for cerumen impaction was no longer significant whereas the OR for tympanogram abnormality remained significant. The lack of an effect of either variable on trouble hearing suggests that there were no obvious functional consequences associated with either cerumen impaction or tympanogram abnormality.
In addition to audiogram-based definitions of hearing difficulties, the present analyses examined self-reported hearing trouble. In prior studies for this same query, those respondents who reported “excellent” or “good” hearing were assigned to a “no-trouble” group and those who reported at least “a little trouble” hearing were assigned to a “trouble hearing” group. The present analyses validated this criterion using responses from the same 8,795 adults to two other self-report measures of hearing difficulties, one tied to difficulty conversing in noise and the other tied to hearing-related frustration while talking with others. The prevalence estimates for self-reported trouble hearing defined in this way and provided in this report (Figures 1, 2 and 12) generally agree with those from prior analyses of NHANES data. It should be noted, however, that these prior analyses of NHANES data for trouble hearing were confined to adults aged greater than 50 (Kamil et al., 2015), 60 (Goman et al., 2020), or 70 years (Choi et al., 2016; DeMario et al., 2022).
There are reports based on large datasets other than NHANES that included the same measure of trouble hearing analyzed here. These studies included adults whose age range was very similar to that in the present analyses, 20 to over 80 years. The results of three of these studies (Dillard et al., 2022; Marrone et al., 2019; Zelaya et al., 2015) are shown in Figure 13, along with the results from the present analyses. The prevalence of no trouble hearing (“excellent” or “good” responses) is nearly identical to that reported here for two of the three studies, all about 76%, with only Zelaya et al. (2015) showing somewhat higher prevalence (83.2%) than the present report. All told, the present results are consistent with the literature regarding the overall prevalence of self-reported trouble hearing. In addition, although the age spans analyzed across studies do not match exactly, the general trends as a function of advancing age and the differences in prevalence of self-reported hearing trouble between males and females in Marrone et al. (2019) and Dillard et al. (2022) were consistent with those effects observed here.
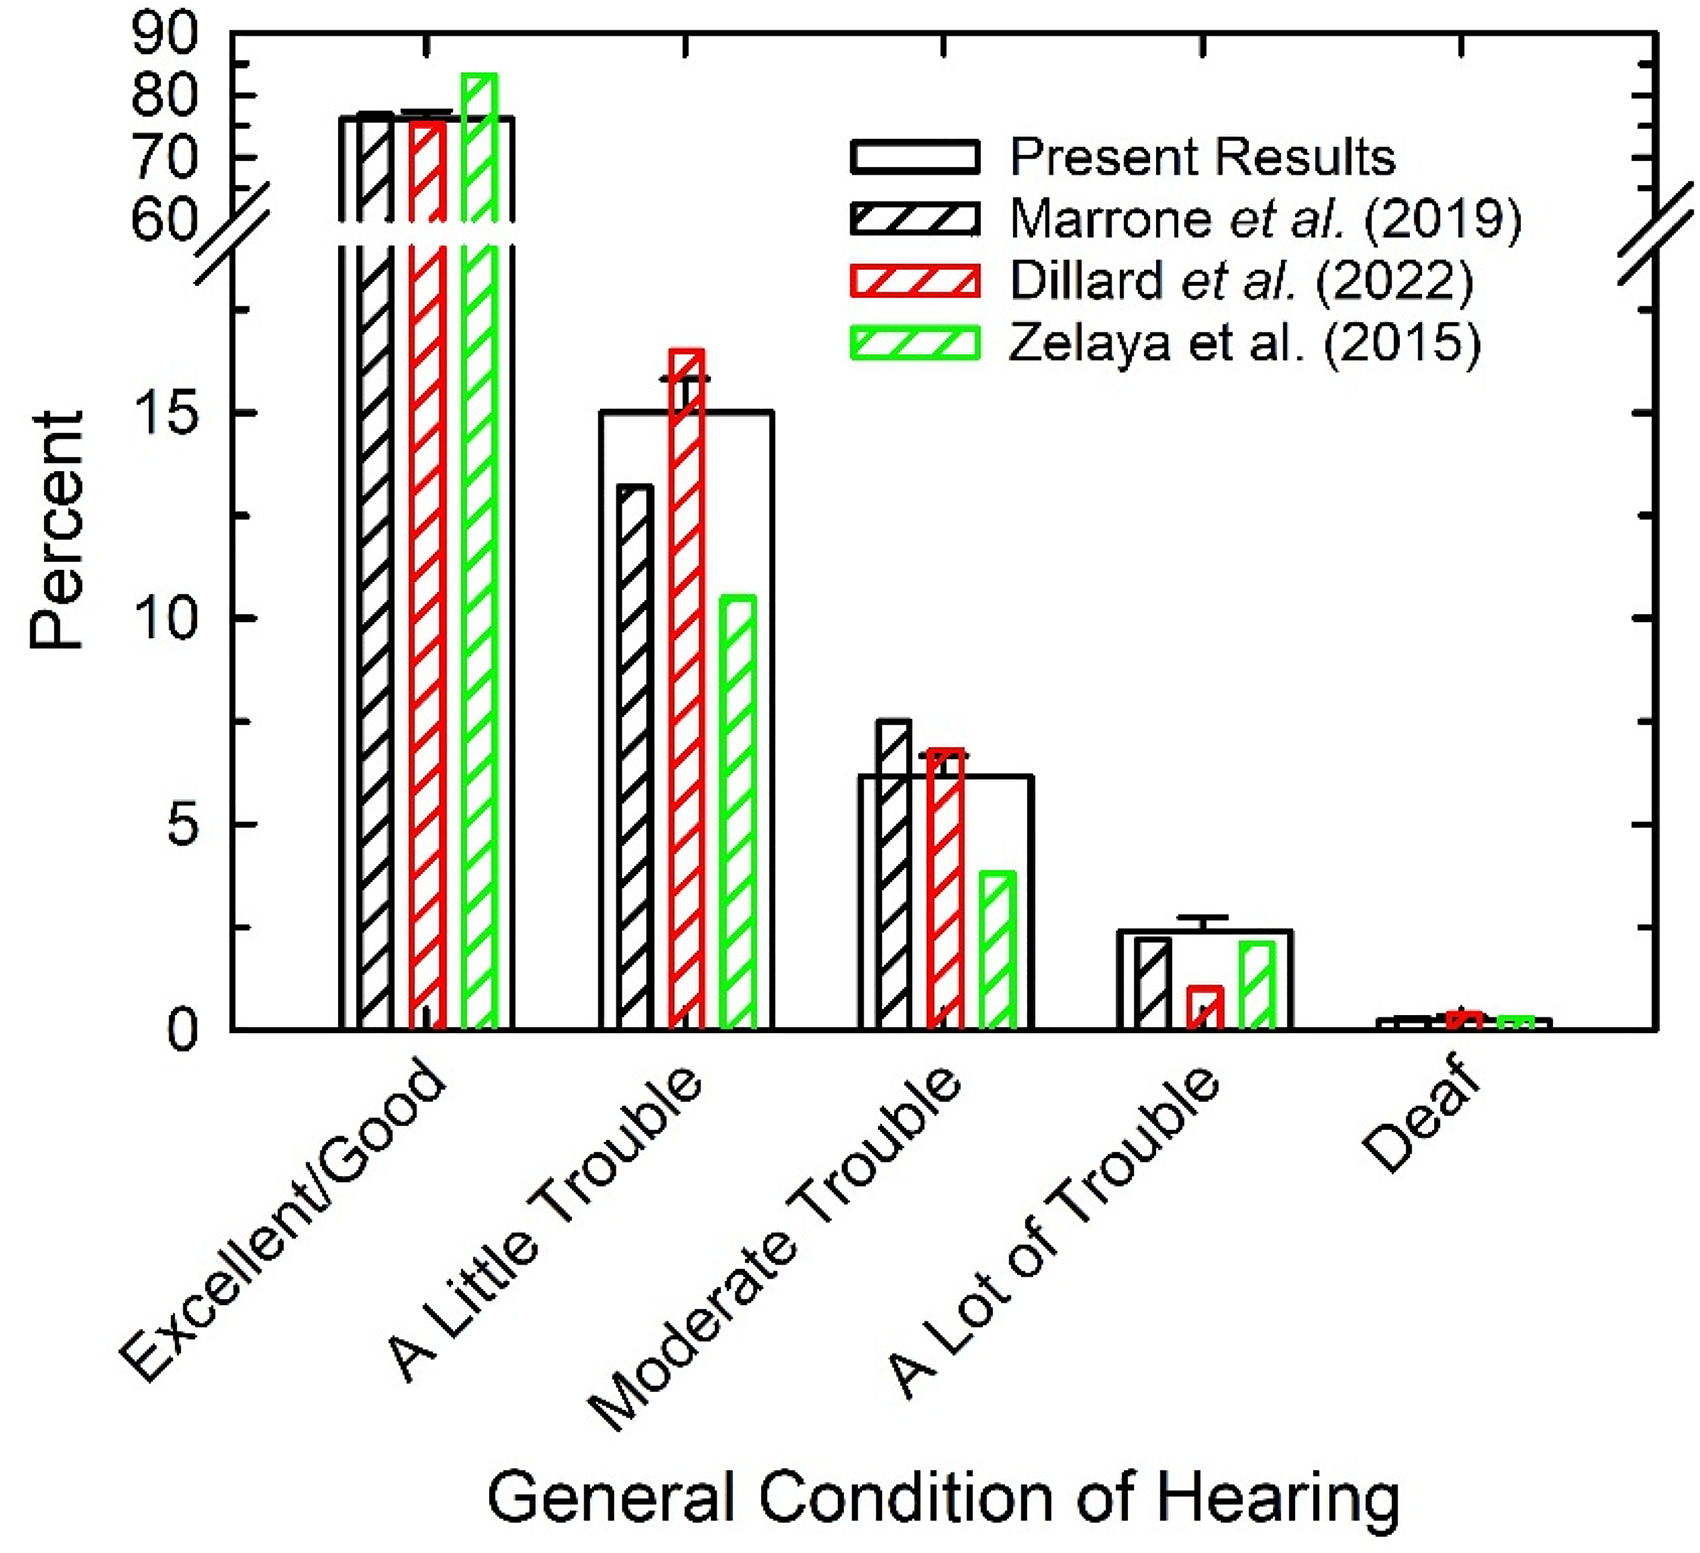
Comparison of present results (wide bars) to those from several population studies (narrow, striped bars) using the same question about trouble hearing.
The correlation of r = 0.61 between audiometrically defined hearing loss severity and perceived trouble hearing indicates some agreement between these measures, but the agreement is far from perfect. This was reflected in the different prevalence estimates for audiometric hearing loss and perceived hearing trouble shown in Figure 12. The difference between the two prevalence estimates varied with age decade. For those younger than age 60, most of whom have near-normal audiograms, many self-reported some degree of trouble hearing. For those above age 70, the difference reversed, many of those having audiometric hearing loss tending to less frequently report trouble hearing. Several population studies have identified mismatches between the self-reported and audiometric definitions of hearing difficulty (Choi et al., 2019; Kiely et al., 2012; Kim et al., 2017; Nondahl et al., 1998; Oosterloo et al., 2020; Salonen et al., 2011; Sindhusake et al., 2001; Swanepoel et al., 2013; Wiley et al., 2000), including several using NHANES data and the same self-report measure as here (Choi et al., 2016; Goman et al., 2020; Kamil et al., 2015). In most of these studies, the focus has been on adults aged 50 or 60 years and older. Overall, the mismatch between PTA4 and self-report is minimal at 50 or 60 years and increases with age in the direction of self-report measures suggesting less prevalent hearing difficulties than audiometric measures. Wiley et al. (2000) suggested several possible explanations for the lower prevalence of self-reported hearing difficulty relative to audiometrically defined hearing loss at older ages. One explanation is that reduced social contexts and work demands may make older adults less aware of their hearing difficulty. A second is that the high prevalence of hearing trouble at older ages makes those individuals less bothered by such difficulties. The difficulties are just accepted as a normal part of aging and the older adults cope better with these hearing difficulties than younger adults.
Figure 12 presents analyses of the prevalence of hearing difficulties defined either audiometrically or by self-report for the NHANES 2011–12, 2015–16, and 2017–20 combined dataset. When these prevalence estimates are compared to the literature over the same age range there is good agreement. If data are examined across the entire adult lifespan, as in Figure 12, the pattern of mismatch between the two measures of hearing difficulty reverses, such that those under 60 years of age tend to self-report more hearing trouble than is measured audiometrically. Even when the age range was restricted to 50 + years of age, other population studies have observed this reversal in the direction of the mismatch between self-report and audiometry for the youngest ages included (Kiely et al., 2012; Nondahl et al., 1998).
The literature on the mismatch between the results of audiometry and self-report is much more extensive if one includes evaluations of various approaches to hearing screening in older adults. In this research, various pure-tone screening criteria, typically involving one or two pure-tone frequencies and various fences for each, together with score criteria for brief self-report measures, were evaluated with the goal of identifying the presence of pure-tone hearing loss as measured with the complete audiogram and summarized by some form of PTA. The most widely investigated self-report screening tool in the U.S. has probably been the Hearing Handicap Inventory for the Elderly-Screener (HHIE-S; Lichtenstein et al., 1988; Ventry & Weinstein, 1982, 1983; Weinstein, 1986). The HHIE-S was also used in various population studies, some also including measures of pure-tone audiometry (Diao et al., 2014; Nondahl et al., 1998; Salonen et al., 2011; Sindhusake et al., 2001; Wiley et al., 2000). The value of self-report measures was evaluated taking the PTA as “the gold standard.”
Humes (2021a), using audiometric and HHIE-S data from over 10,000 adults aged 50 years or older, argued that audiometric hearing loss should not be the gold standard. Rather, the self-report measure was more comprehensive and likely tapped multiple domains of healthy function, as modeled by the WHO ICF (WHO, 2001), whereas pure-tone audiometry was confined to a single domain of healthy function (bodily impairment). As such, one would not expect perfect agreement between these two types of measures, and this was clear in the present data. Overall, most prior large-scale studies of self-report and audiometric measures of hearing difficulty have found about 70–80% agreement between the two when each has been dichotomized via a criterion cut-off score (Choi et al., 2016, 2019; Goman et al., 2020; Kamil et al., 2015; Kiely et al., 2012; Kim et al., 2017; Nondahl et al., 1998; Oosterloo et al., 2020; Salonen et al., 2011; Sindhusake et al., 2001; Swanepoel et al., 2013; Wiley et al., 2000).
The top panel of Figure 14 depicts the NHANES data in terms of positive/negative trouble hearing versus positive/negative PTA4 ≥ 20 dB HL. The red cell in the 2 × 2 matrix reflects the prevalence of cases where both measures were positive, 12.1%, whereas the green cell depicts the prevalence of cases where both measures were negative, 69.6%. The overall agreement between these two measures, 81.7%, is consistent with the literature across a wide range of audiometric and self-report measures of hearing difficulties.

The top panel shows the 2 × 2 agreement matrix between the audiometric (PTA4) and trouble-hearing measures, each either positive (Pos) or negative (Neg). M = millions. The bottom panel shows median responses for two self-report measures of hearing function. Squares: hearing frustration; Circles: difficulty in noise. The color coding of symbols matches the matrix in the top panel.
In the context of OTC hearing aids, the cells in the top part of Figure 14 depicting disagreement are of greatest interest. The orange cell shows the prevalence of trouble hearing in the absence of audiometrically defined hearing loss whereas the yellow cell shows the audiogram indicating hearing loss in the absence of self-reported trouble hearing. The OTC legislation and the draft final rule from the FDA rely on perceived mild-to-moderate hearing loss for candidacy. There is broad acceptance that individuals represented by the red cell, Pos/Pos, are candidates for help, and those represented by the green cell, Neg/Neg, are not, but how should the cases in the orange and yellow cells be interpreted?
By basing candidacy on perceived hearing difficulties, the FDA's final rule for OTC hearing aids essentially indicates that those in the orange cell should be treated like those in the red cell and be granted direct access to hearing help through hearing aids. The NHANES data in the lower panel of Figure 14 offer support for this position. The median responses for two self-report measures, one pertaining to difficulty conversing in noise and the other to frustration felt while talking to others, are shown for the subgroups represented in each of the four cells of the matrix in the top part of Figure 14. For the two cases of disagreement in outcomes, yellow and orange, the median responses for the subgroup represented in yellow are more like those of the consensus-negative group (green) whereas the median responses for the subgroup represented in orange are much closer to those of the consensus-positive or need-help subgroup (red). In sum, consistent with the OTC hearing-aid legislation and final FDA rule, those represented by the red and the orange cells, all those with perceived hearing trouble, should be considered candidates for assistance. This amounts to 22.4% or about 52.5 million US adults ranging in age from 20 to over 80 years, although a portion of these adults will have perceived hearing difficulties beyond “mild to moderate” and would be better served by conventional hearing aids.
Analysis of the combined dataset indicated that 17.7% (14.7%, 20.7%; 95% confidence interval) of those with self-reported hearing trouble had ever used hearing aids, 14.8% (12.0%, 17.7%) currently used hearing aids. Further, only 12.5% (10.2%, 14.9%) ever used ALDs. It has been argued that the reason the uptake of such devices is so low can be found in factors related to the poor affordability and accessibility of these devices (Donahue et al., 2010; Humes, 2020, 2021a), although many factors are involved. In the present analyses, income did not affect the uptake of devices (Figure 7). This was observed for the fully adjusted logistic-regression analyses. When family income was the only independent variable (unadjusted analyses), on the other hand, ORs for the lowest income (referenced to the highest as in Figure 7) were significantly lower than 1. Specifically, significant ORs of 0.29 (95% CI: 0.15, 0.57) and 0.25 (0.12, 0.53) were observed for ever-used and currently using hearing aids, respectively. This same OR for family income approached significance in the fully adjusted logistic-regression models shown in Figure 7 but was diminished with the addition of several covariates that may be related to income, such as age, race/ethnicity, and level of education.
The overall uptake of hearing aids among U.S. adults 20 to 80-plus years of age, regardless of hearing status, was about 5% and uptake increased steadily with age decade, reaching a maximum of about 30–40% among those ≥ 70 years of age. This is generally consistent with previous population-based studies of the prevalence of hearing-aid use (Bainbridge & Ramachandran, 2014; Chien & Lin, 2012; Dawes et al., 2014; Popelka et al., 1998). When restricting the analyses to just those with HHC needs, defined either audiometrically or by self-report, only about 15–20% of all those with HHC needs had those needs met by hearing aids or some combination of hearing aids and ALDs (Figures 8 and 9). Adults between 20 and 69 years of age (Figure 8) and those with mild hearing deficits (Figure 9) had the greatest unmet HHC needs. In terms of the number of individuals with unmet HHC needs, the largest groups were males and females 50–69 years of age (Figure 11). Tens of millions of adults across the adult lifespan were estimated to have unmet HHC needs in the prevailing HHC system. Almost a decade ago and based on population data from older adults living in Beaver Dam, Wisconsin, Nash et al. (2013) reached similar conclusions about the large unmet needs in HHC. Clearly, these unmet HHC needs have been commonplace for a long time. Perhaps the addition of another pathway to hearing help for millions of adults with unmet HHC needs will reduce their prevalence in the U.S. Replication of these analyses 5–10 years from now can be undertaken to evaluate the effect of the availability of OTC hearing aids on the prevalence of unmet HHC need.
A limitation of this study, and others like it that attempt to define hearing loss using a specific PTA and fence, is that the findings obtained are specific to the criteria for hearing loss that were applied. For audiometric hearing loss, these analyses applied the most recent criteria from the WHO (WHO, 2021). There has been renewed interest recently, however, in “sub-clinical” hearing loss or “hidden hearing loss” (see review by Kohrman et al., 2020). One way this has been explored is through even more stringent audiometric definitions of hearing loss, such as defining normal hearing as all thresholds from 500 to 8000 Hz being less than 15, 20, or 25 dB HL (e.g., Cruickshanks et al., 2020; Humes, 2021c; Ridley et al., 2018; Spankovich et al., 2018). As shown in Figure 12, lowering the PTA4 criterion for hearing loss from 25 to 20 dB HL affects prevalence. Further lowering of the hearing-loss criterion to capture sub-clinical hearing loss would increase prevalence further and may also affect the effects of various variables on prevalence.
Another limitation of these analyses is that the use of devices relied on self-report and recollection by the respondents, especially for those who reported ever using hearing aids or ALDs. In addition, the question about current hearing aid use was based on a simple Yes/No response. Although all three NHANES surveys included some measures of frequency of use, the measures were not consistent across surveys, which precluded further analyses of those responses across the combined dataset.
The association between the presence of hearing loss, defined as better-ear PTA4 ≥ 20 dB HL, and various demographic, health, and noise-exposure variables relied on logistic-regression analyses and the use of ORs, as is the case for many previous studies of this type. Such analyses, however, are not without limitations (e.g., Norton & Dowd, 2018). The ORs that emerge from such analyses diverge increasingly from an interpretation in terms of probabilities or relative risk as the prevalence of the dependent variable exceeds 10% (e.g., McNutt et al., 2003) with some suggesting that ORs should not be used at all when the prevalence is greater than 20–30% (Altman et al., 1998).
Conclusions
These analyses of the most recent NHANES data on audiometric hearing loss, perceived trouble hearing, and device usage update, confirm, and extend prior analyses of NHANES data for U.S adults. Regarding audiometrically measured hearing loss, the WHO (2021) hearing-impairment grade system was applied for the first time to U.S. national data. Overall, about 80% of U.S. adults aged 20 to 80-plus years had PTA4 < 20 dB HL in the better ear. Of those with PTA4 ≥ 20 dB HL, most cases were mild. The prevalence of hearing loss was greater for males than females of the same age and increased for both sexes with age. As shown in Table 2, alternative fences between normal and impaired hearing, including those based on the worse ear or higher pure-tone frequencies, yield higher estimates of hearing-loss prevalence for U.S. adults.
Self-reported trouble hearing, defined as having at least a little trouble hearing, was found in about 25% of U.S. adults between the ages of 20 and 80-plus years. The prevalence of trouble hearing was greater for males than females and increased for both with advancing age. Perceived trouble hearing increased the odds for device uptake and the resolution of unmet HHC needs considerably more than any other variable included in these analyses.
Overall, among those with audiometrically defined hearing loss or perceived trouble hearing, about 15% used hearing aids or ALDs to remedy their hearing difficulties. Thus, about 85% of U.S. adults with hearing difficulties had unmet HHC needs. This was generally true regardless of how need and the meeting of that need were defined. Unmet HHC needs were lowest among those 20–29 years of age and those 70 years of age or older. Unmet HHC needs were greatest among those 50 to 69 years of age and those with mild hearing difficulties (less severe hearing loss or less trouble hearing). Perhaps the introduction of OTC hearing aids with device candidacy based on perceived mild-to-moderate hearing trouble will improve the overall effectiveness of HHC in the U.S.
Supplemental Material
sj-xlsx-1-tia-10.1177_23312165231160978 - Supplemental material for U.S. Population Data on Hearing Loss, Trouble Hearing, and Hearing-Device Use in Adults: National Health and Nutrition Examination Survey, 2011–12, 2015–16, and 2017–20
Supplemental material, sj-xlsx-1-tia-10.1177_23312165231160978 for U.S. Population Data on Hearing Loss, Trouble Hearing, and Hearing-Device Use in Adults: National Health and Nutrition Examination Survey, 2011–12, 2015–16, and 2017–20 by Larry E. Humes in Trends in Hearing
Supplemental Material
sj-xlsx-2-tia-10.1177_23312165231160978 - Supplemental material for U.S. Population Data on Hearing Loss, Trouble Hearing, and Hearing-Device Use in Adults: National Health and Nutrition Examination Survey, 2011–12, 2015–16, and 2017–20
Supplemental material, sj-xlsx-2-tia-10.1177_23312165231160978 for U.S. Population Data on Hearing Loss, Trouble Hearing, and Hearing-Device Use in Adults: National Health and Nutrition Examination Survey, 2011–12, 2015–16, and 2017–20 by Larry E. Humes in Trends in Hearing
Supplemental Material
sj-xlsx-3-tia-10.1177_23312165231160978 - Supplemental material for U.S. Population Data on Hearing Loss, Trouble Hearing, and Hearing-Device Use in Adults: National Health and Nutrition Examination Survey, 2011–12, 2015–16, and 2017–20
Supplemental material, sj-xlsx-3-tia-10.1177_23312165231160978 for U.S. Population Data on Hearing Loss, Trouble Hearing, and Hearing-Device Use in Adults: National Health and Nutrition Examination Survey, 2011–12, 2015–16, and 2017–20 by Larry E. Humes in Trends in Hearing
Supplemental Material
sj-xlsx-4-tia-10.1177_23312165231160978 - Supplemental material for U.S. Population Data on Hearing Loss, Trouble Hearing, and Hearing-Device Use in Adults: National Health and Nutrition Examination Survey, 2011–12, 2015–16, and 2017–20
Supplemental material, sj-xlsx-4-tia-10.1177_23312165231160978 for U.S. Population Data on Hearing Loss, Trouble Hearing, and Hearing-Device Use in Adults: National Health and Nutrition Examination Survey, 2011–12, 2015–16, and 2017–20 by Larry E. Humes in Trends in Hearing
Supplemental Material
sj-xlsx-5-tia-10.1177_23312165231160978 - Supplemental material for U.S. Population Data on Hearing Loss, Trouble Hearing, and Hearing-Device Use in Adults: National Health and Nutrition Examination Survey, 2011–12, 2015–16, and 2017–20
Supplemental material, sj-xlsx-5-tia-10.1177_23312165231160978 for U.S. Population Data on Hearing Loss, Trouble Hearing, and Hearing-Device Use in Adults: National Health and Nutrition Examination Survey, 2011–12, 2015–16, and 2017–20 by Larry E. Humes in Trends in Hearing
Supplemental Material
sj-xlsx-6-tia-10.1177_23312165231160978 - Supplemental material for U.S. Population Data on Hearing Loss, Trouble Hearing, and Hearing-Device Use in Adults: National Health and Nutrition Examination Survey, 2011–12, 2015–16, and 2017–20
Supplemental material, sj-xlsx-6-tia-10.1177_23312165231160978 for U.S. Population Data on Hearing Loss, Trouble Hearing, and Hearing-Device Use in Adults: National Health and Nutrition Examination Survey, 2011–12, 2015–16, and 2017–20 by Larry E. Humes in Trends in Hearing
Supplemental Material
sj-xlsx-7-tia-10.1177_23312165231160978 - Supplemental material for U.S. Population Data on Hearing Loss, Trouble Hearing, and Hearing-Device Use in Adults: National Health and Nutrition Examination Survey, 2011–12, 2015–16, and 2017–20
Supplemental material, sj-xlsx-7-tia-10.1177_23312165231160978 for U.S. Population Data on Hearing Loss, Trouble Hearing, and Hearing-Device Use in Adults: National Health and Nutrition Examination Survey, 2011–12, 2015–16, and 2017–20 by Larry E. Humes in Trends in Hearing
Supplemental Material
sj-xlsx-8-tia-10.1177_23312165231160978 - Supplemental material for U.S. Population Data on Hearing Loss, Trouble Hearing, and Hearing-Device Use in Adults: National Health and Nutrition Examination Survey, 2011–12, 2015–16, and 2017–20
Supplemental material, sj-xlsx-8-tia-10.1177_23312165231160978 for U.S. Population Data on Hearing Loss, Trouble Hearing, and Hearing-Device Use in Adults: National Health and Nutrition Examination Survey, 2011–12, 2015–16, and 2017–20 by Larry E. Humes in Trends in Hearing
Supplemental Material
sj-xlsx-9-tia-10.1177_23312165231160978 - Supplemental material for U.S. Population Data on Hearing Loss, Trouble Hearing, and Hearing-Device Use in Adults: National Health and Nutrition Examination Survey, 2011–12, 2015–16, and 2017–20
Supplemental material, sj-xlsx-9-tia-10.1177_23312165231160978 for U.S. Population Data on Hearing Loss, Trouble Hearing, and Hearing-Device Use in Adults: National Health and Nutrition Examination Survey, 2011–12, 2015–16, and 2017–20 by Larry E. Humes in Trends in Hearing
Footnotes
Acknowledgments
This work was supported, in part, by Indiana University, including access to and use of the high-performance computing center.
Declaration of Conflicting Interests
The author(s) declared no potential conflicts of interest with respect to the research, authorship, and/or publication of this article.
Funding
The author(s) received no financial support for the research, authorship, and/or publication of this article.
Supplemental Material
Supplemental material for this article is available online.
References
Supplementary Material
Please find the following supplemental material available below.
For Open Access articles published under a Creative Commons License, all supplemental material carries the same license as the article it is associated with.
For non-Open Access articles published, all supplemental material carries a non-exclusive license, and permission requests for re-use of supplemental material or any part of supplemental material shall be sent directly to the copyright owner as specified in the copyright notice associated with the article.