
Abstract
Dynamic range compression serves different purposes in the music and hearing-aid industries. In the music industry, it is used to make music louder and more attractive to normal-hearing listeners. In the hearing-aid industry, it is used to map the variable dynamic range of acoustic signals to the reduced dynamic range of hearing-impaired listeners. Hence, hearing-aided listeners will typically receive a dual dose of compression when listening to recorded music. The present study involved an acoustic analysis of dynamic range across a cross section of recorded music as well as a perceptual study comparing the efficacy of different compression schemes. The acoustic analysis revealed that the dynamic range of samples from popular genres, such as rock or rap, was generally smaller than the dynamic range of samples from classical genres, such as opera and orchestra. By comparison, the dynamic range of speech, based on recordings of monologues in quiet, was larger than the dynamic range of all music genres tested. The perceptual study compared the effect of the prescription rule NAL-NL2 with a semicompressive and a linear scheme. Music subjected to linear processing had the highest ratings for dynamics and quality, followed by the semicompressive and the NAL-NL2 setting. These findings advise against NAL-NL2 as a prescription rule for recorded music and recommend linear settings.
Introduction
Compression in Music Production
Dynamic range refers to the level difference between the highest and lowest-level passages of an audio signal. Dynamic range compression (or dynamic compression) is a method to reduce the dynamic range by amplifying passages that are low in intensity more than passages that are high in intensity. Dynamic compression can serve different purposes in the music production process. It may have an aesthetic purpose in the mastering process to make the mix more coherent and to minimize excessive loudness changes within a song (Katz & Katz, 2003). It may also have a pragmatic purpose if it is employed to adapt the dynamic range of music to the technical limitations of recording or playback devices. Dynamic compression, however, can and has infamously been used to increase the loudness of a song. It is widely believed in the music industry that loudness levels and record sales are correlated (Vickers, 2011). A very strong compressor called a limiter is employed to reduce peak levels. A so-called makeup gain then amplifies the whole signal until the peaks reach full scale again. This method increases the overall energy of the signal but often introduces distortion (Kates, 2010) and compromises signal quality. Even when distortion is not perceptible, highly compressed music can become physically or mentally tiring over time (Vickers, 2011).
Compression in Hearing Aids
Hearing aids incorporate dynamic range compression to compensate for higher absolute hearing thresholds and the effects of loudness recruitment, which are commonly experienced by people with sensorineural hearing loss. Loudness recruitment is an abnormally rapid growth in loudness that accompanies increases in suprathreshold stimulus intensity (Villchur, 1974). A hearing aid must amplify soft passages more than loud passages so as to increase audibility while maintaining a comfortable listening experience. Fortunately, hearing aids provide some flexibility in the extent to which compression is applied. Important compression parameters are attack time, release time, compression ratio (CR), compression threshold, and number of channels (Giannoulis, Massberg, & Reiss, 2012). The parameterizations vary across hearing-aid manufacturers (Moore, Füllgrabe, & Stone, 2011) and may also depend on the detected signal class, such as speech or music.
There are established prescription rules that define gain targets for speech as a function of frequency, sound level, and hearing loss. CAMEQ (Moore, 2005; Moore, Glasberg, & Stone, 1999) and its successor CAM2 (Moore, Glasberg, & Stone, 2010) are fitting recommendations from the University of Cambridge. The later version CAM2 uses a revised loudness model for the gain calculations (Moore & Glasberg, 2004). Furthermore, the gain recommendations were extended from frequencies up to 6 kHz in CAMEQ to frequencies up to10 kHz in CAM2. In general, the gains between 1 and 4 kHz are between 1 and 3 dB lower in CAM2 than in CAMEQ (Moore & Sek, 2013).
Another established fitting method is DSL—Desired Sensation Level—from the National Centre for Audiology at Western University, Canada (Scollie et al., 2005). The DSL prescriptions were originally developed to address the specific amplification needs of children (Seewald, Ross, & Spiro, 1985). A later version of DSL, DSL v5 Adult, supports hearing instrument fitting for adults (Jenstad et al., 2007; Scollie et al., 2005).
The National Acoustic Laboratories in Australia provide the prescription rule NAL-NL1 (Dillon, 1999) and its successor NAL-NL2 (Dillon, Keidser, Ching, Flax, & Brewer, 2011; Keidser, Dillon, Flax, Ching, & Brewer, 2011). NAL-NL1 is based on the assumption that speech is fully understood when all speech components are audible. NAL-NL2 accounts for the fact that as the hearing loss gets more severe, less information is extracted even when it is audible above threshold (Keidser et al., 2011). NAL-NL2 recommends gains for frequencies up to 8 kHz, whereas NAL-NL1 is limited to 6 kHz (Moore & Sek, 2013). NAL-NL2 prescribes more low- and high-frequency gain and less mid-frequency gain than NAL-NL1 (Johnson & Dillon, 2011). In addition, the gender and hearing-aid experience of the patient can be taken into account for the gain precalculation with NAL-NL2.
Johnson and Dillon (2011) compared the latest prescription rules CAM2, NAL-NL2, and DSL v5 Adult with regard to insertion gain, loudness, and CR. For speech at a level of 65 dB sound pressure level (SPL), DSL v5 Adult provides most gain in the high frequencies. Regarding overall loudness, CAM2 is louder than DSL and NAL-NL2. With regard to the CRs, CAM2 and NAL-NL2 provide generally more compression than DSL v5 Adult. For sloping hearing loss, however, the CR of DSL v5 Adult is higher than the CR of NAL-NL2.
These prescription rules were primarily designed for speech and have not been adapted for music. If the dynamic range of music is different than the dynamic range of speech, then the established prescription rules may be inappropriate for music. Further, different genres of music might be best handled using their own prescription rules.
Music Perception With Hearing Aids
A recent Internet-based survey by Madsen and Moore (2014) showed that many hearing-aid users experience problems with their hearing aids when listening to music. Many of these problems may be attributed to distortions introduced by the hearing aid. Hockley, Bahlmann, and Fulton (2012) argued that live music will often generate distortions in hearing aids due to the presence of high sound levels and a large dynamic range.
Peer-Reviewed Research Exploring the Effect of Different Compression Settings on Music Perception in Hearing-Impaired Listeners.
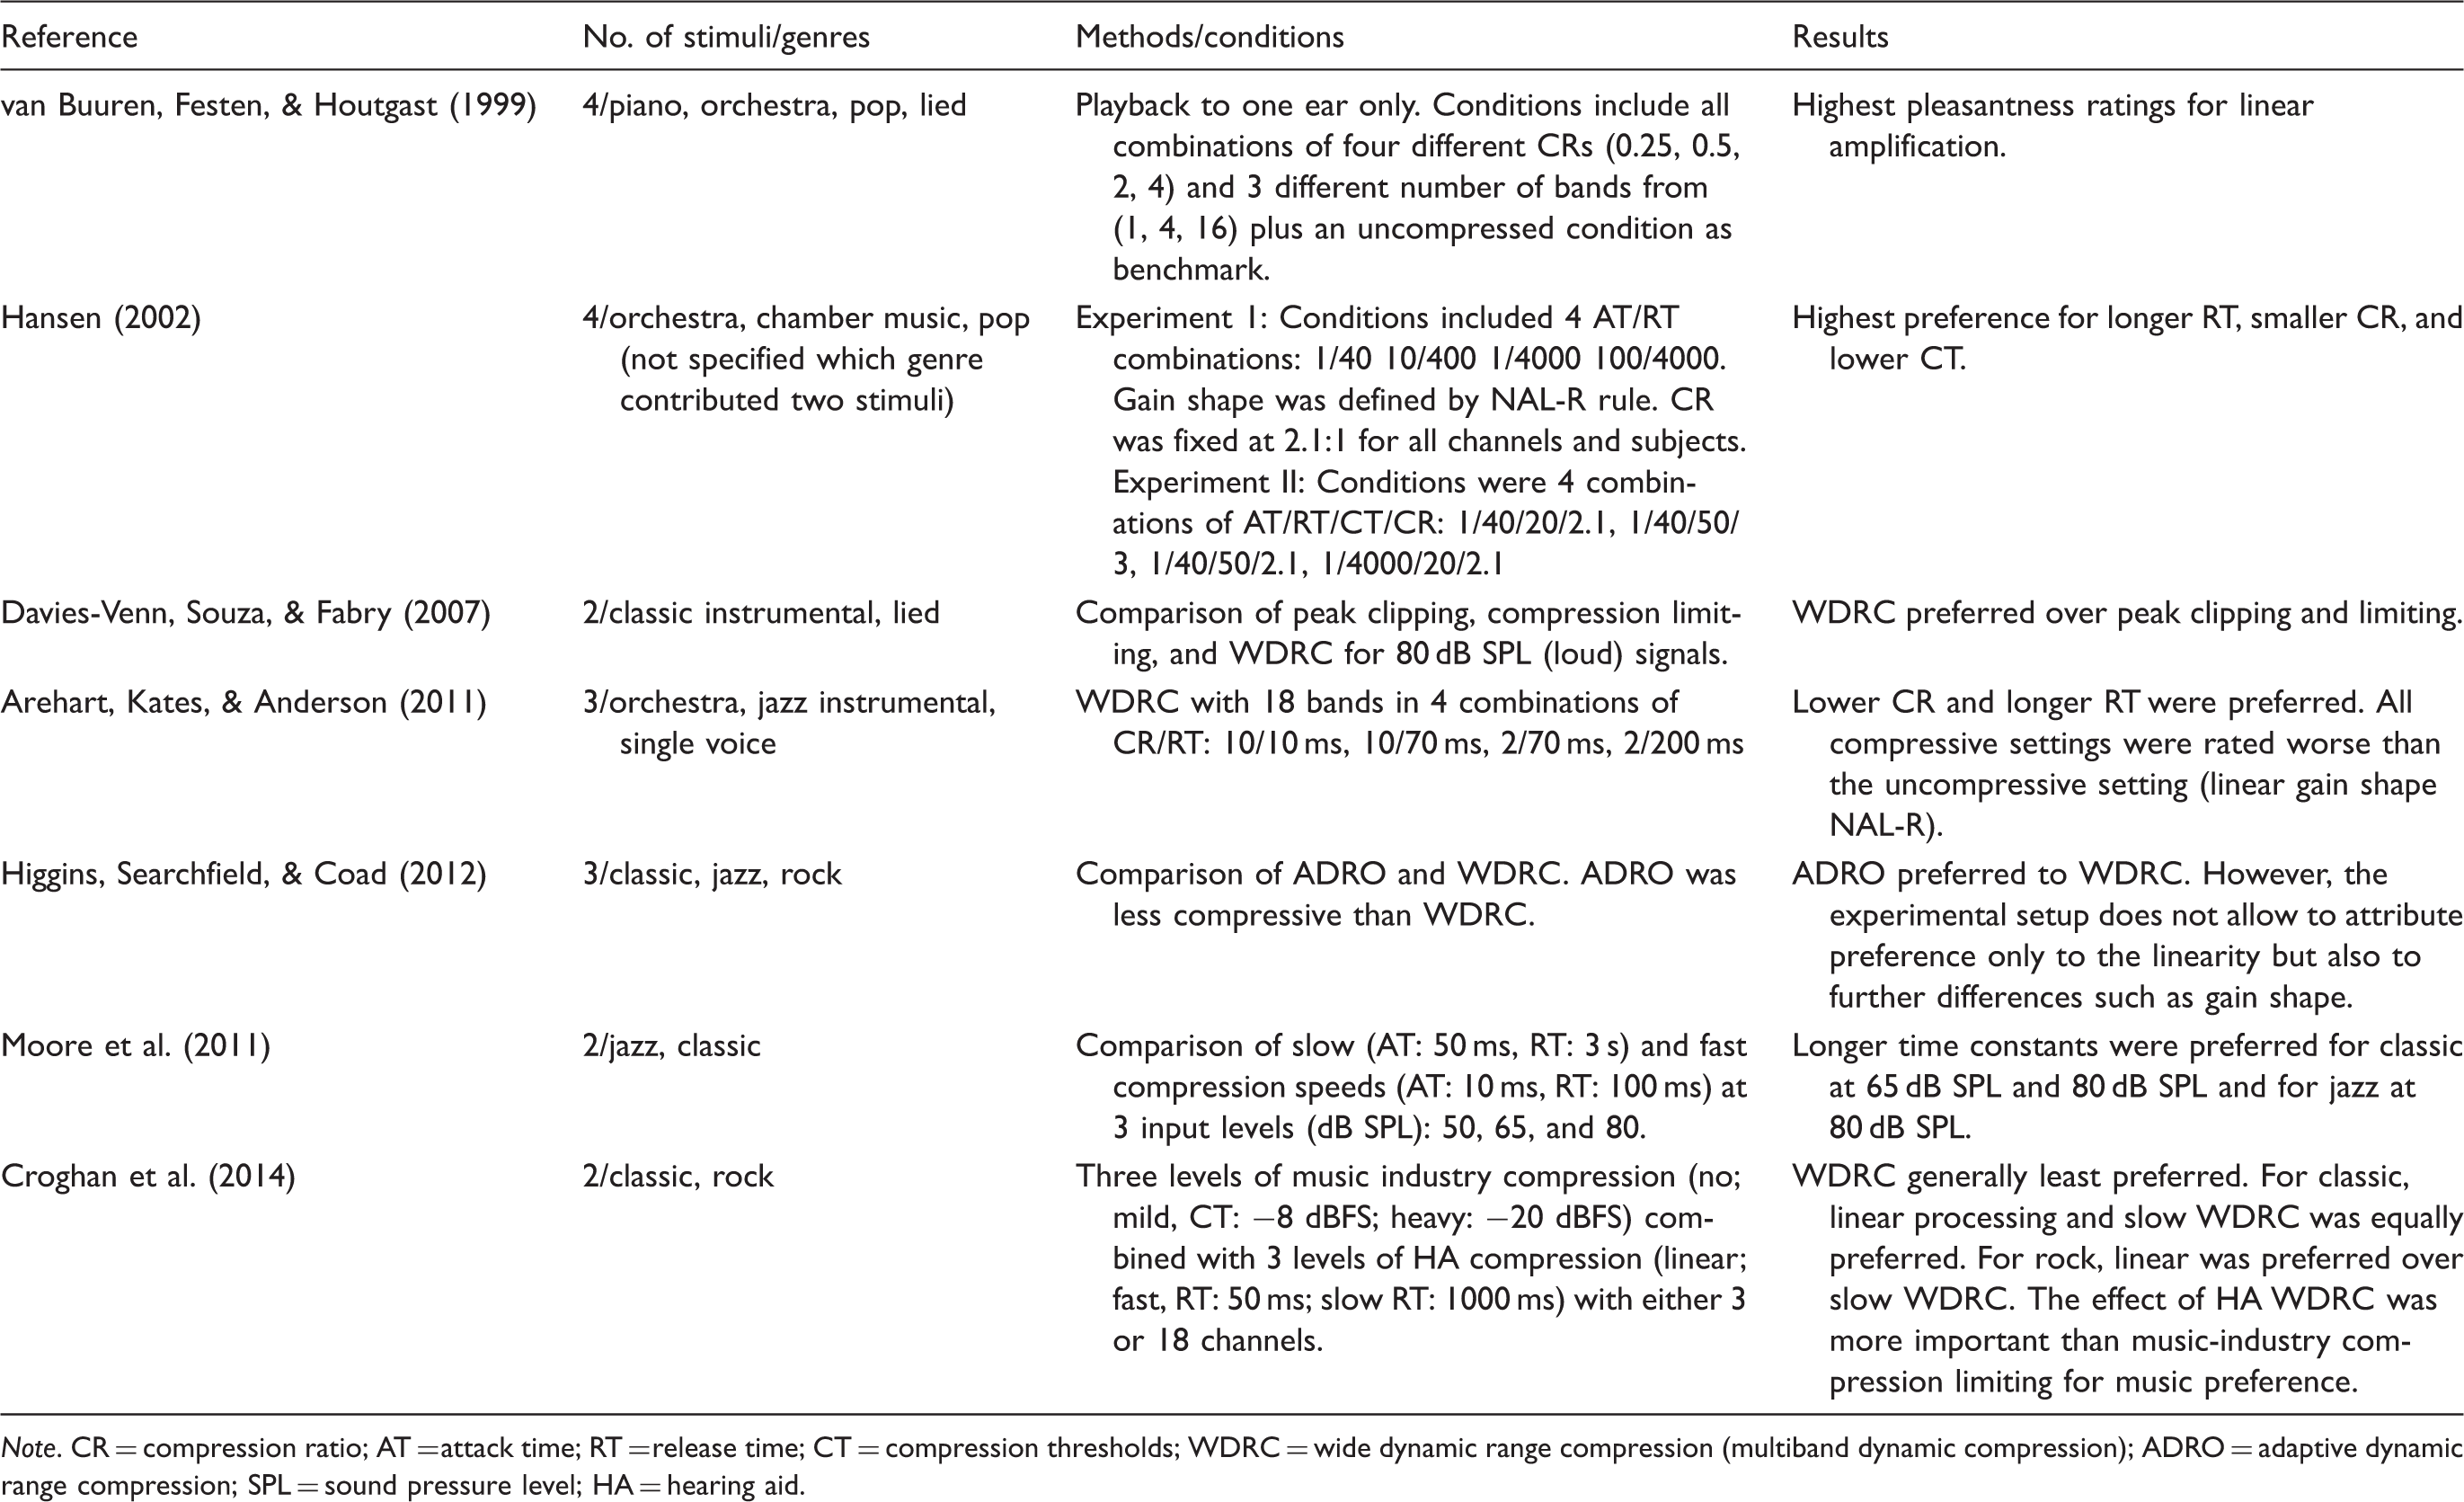
Note. CR = compression ratio; AT = attack time; RT = release time; CT = compression thresholds; WDRC = wide dynamic range compression (multiband dynamic compression); ADRO = adaptive dynamic range compression; SPL = sound pressure level; HA = hearing aid.
Nevertheless, the size of the audio corpora used in the studies listed in Table 1 was consistently small, and it is thus difficult to generalize the results, given the broad diversity of music that exists in the real world. For these reasons, we chose to undertake a formal study of dynamic range across a broad range of recorded music. 1
Dynamic Range of Recorded Music
Dynamic properties of recorded music may vary with genre due to differences in various practices including instrumentation and mastering. Previous surveys of dynamic range have focused on differences in dynamic range across eras rather than across genres (Deruty & Tardieu, 2014; Ortner, 2012; Vickers, 2010, 2011). Insights regarding variability in dynamic range across genres may inform the optimization of compression schemes for music.
Experiment 1: Dynamic Range of Music Across Genres
Stimuli
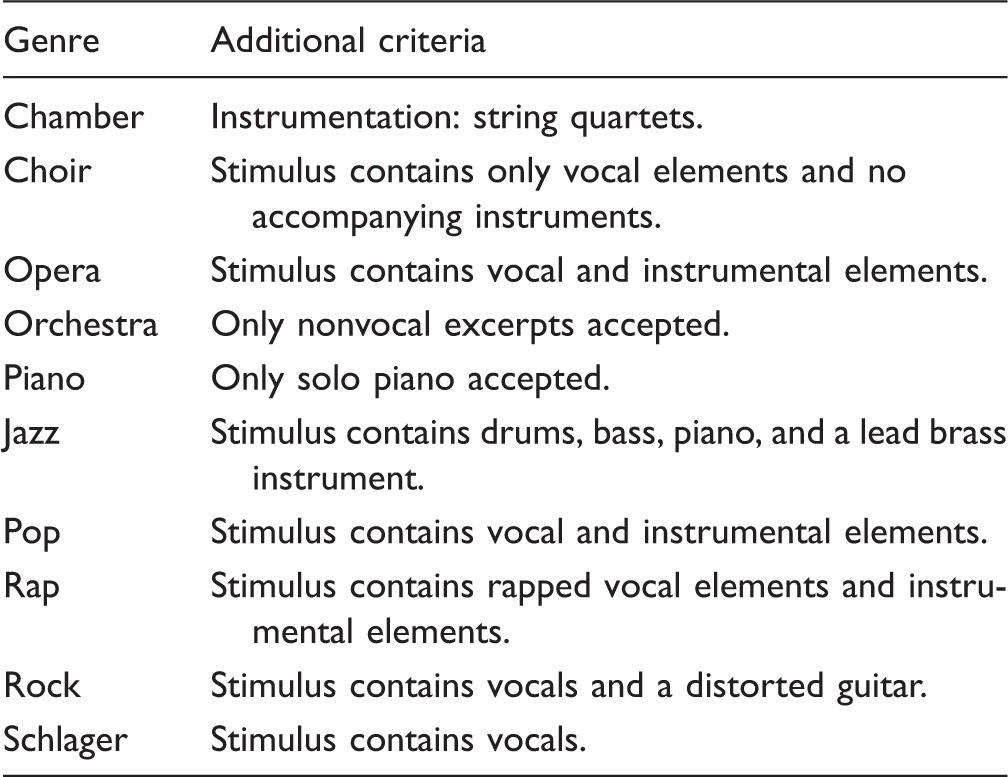
The music corpus used for analysis contained 100 songs in each of 10 genres: chamber music, choir, opera, orchestra, piano music, jazz, pop, rap, rock, and schlager. 2 Song selection for the corpus was constrained to release dates between 2000 and 2014 to minimize the impact of the historic rise in compression standards that occurred prior to this era (Deruty & Tardieu, 2014; Ortner, 2012). All songs were commercially available and were retrieved in CD quality with 44.1-kHz sampling rate and 16-bit resolution. The songs were chosen from a wide range of composers and labels to avoid a bias from a single composer or mastering engineer. For the dynamic-range analysis, a 45-s segment was excerpted from the center of each song, converted to mono and normalized in root mean square (RMS) level.
Additional Criteria for Each Genre That the Songs and Stimuli (45-s Segments) Had to Meet Beyond the iTunes Genre Classification.
For comparative purposes, speech stimuli of one female and one male native speaker of 14 different languages including Chinese, English, Spanish, French, Japanese, German, Italian, Portuguese, Hungarian, Bulgarian, Polish, Dutch, Slovenian, and Danish were added to the audio corpus. All monologues are translations of the same original German text. The monologues were recorded in professional studios in noise-free environments with a 1-m distance between the speaker and microphone. The recordings were provided by Phonak and are available in the Phonak iPFG fitting software.
Analysis
There are several definitions for measuring the dynamic range of music (Boley, Danner, & Lester, 2010). The EBU-Tech 3342 (2011) recommendation from the European Broadcasting Union defines loudness range as the difference between the 95th and 10th percentiles measured with overlapping windows of 3-s duration. Another common measure, the crest factor, is defined as the sound level difference between some estimation of peak level and some estimation of central tendency (e.g., average). The exact determination of the peak or time-averaged level, however, varies among studies (Croghan, Arehart, & Kates, 2014; Deruty & Tardieu, 2014; Ortner, 2012). The IEC 60118-15 (2008) recommendation was developed to characterize signal processing in hearing aids. It uses a standardized test signal that is composed of short speech segments from female Arabic, English, French, German, Mandarin, and Spanish speakers as hearing-aid input signal to analyze the signal processing. The processed signal is partitioned into third-octave bands, and the dynamic range analysis is conducted for each frequency band individually. The analyzing window is set at 125 ms with 50% overlap. The signal duration for analysis specified in the standard is 45 s. The dynamic range is usually reported for the 30th, 65th, and 99th percentiles.
The IEC standard was used as the method of analysis in this experiment. It is the most appropriate method for dynamic range analysis in the context of hearing-aid signal processing, as it uses window lengths that correspond with the time resolution of loudness perception (Chalupper, 2002; Moore, 2014) and provides a frequency-dependent analysis. It is therefore possible to analyze the dynamic range of any kind of acoustic signal including music. All stimuli were RMS equalized prior to analysis to allow for averaging across segments within genres.
Results
The results of the dynamic range analysis for each genre (100 samples) and speech (28 samples) are depicted in Figure 1. The percentiles are reported in dB SPL and shown across frequency in kHz.
Dynamic range of speech and 10 different music genres. The lines represent percentiles in dB (SPL) across frequency in kHz (99th: upper dashed line, 90th: upper solid line, 65th: thick line, 30th: lower solid line, and 10th: lower dashed line).
The percentiles of the modern genres (pop, rap, rock, and schlager) cluster together more than the percentiles of the classical genres (chamber, choir, opera, orchestra, piano), with the extent of clustering in jazz falling somewhere in between. Within the classical genres, opera and choir show higher differences between the highest and lowest percentiles than chamber, orchestra, and piano, especially in the frequency region between 0.5 and 2 kHz.
Figure 2 shows a dynamic range comparison of all genres calculated as the difference between the 99th and 30th percentile. According to this analysis, speech is generally largest in dynamic range in all frequency bands followed by the classical genres, jazz, and the modern genres. Speech is only locally surpassed by chamber music in the lowest two frequency bands ([110 Hz to 140 Hz]; [140 Hz to 177 Hz]) and by orchestra and opera in the lowest band.
Dynamic range comparison between different music genres and speech across frequency. The dynamics are calculated as the difference between the 99th and 30th percentiles according to the IEC 60118-15 standard.
The findings indicate that the dynamic range of music is generally smaller than the dynamic range of speech in quiet. The differences in dynamic range across genres can be attributed to acoustic properties such as instrumentation and to genre-dependent compression preferences. A further investigation to reveal the extent to which acoustic properties or compression preferences contribute to overall differences in dynamic range, however, is beyond the scope of this article.
Conclusion
The dynamic range of recorded music across genres based on an audio corpus of 1,000 songs was found to be smaller than the dynamic range of monologue speech in quiet. Samples from modern genres such as pop, rap, rock, and schlager generally had the smallest dynamic range, followed by samples from jazz and classical genres such as chamber, choir, orchestra, piano, and opera. Only in the lower frequencies was the dynamic range of speech surpassed by the dynamic range of music, and then only in the case of chamber music, opera, and orchestra.
Experiment 2: Effect of CR on Music Perception
Rationale
Dynamic compression reduces the dynamic range of a stimulus to provide audibility for low-level passages without reaching uncomfortable loudness levels for high-level signals. Signals with a small dynamic range need less compression than signals with a large dynamic range to ensure audibility and comfortable listening levels. Based on the analysis, the dynamic range of music and particularly the dynamic range in samples from modern genres are smaller than those found in monologue speech in quiet. We therefore hypothesize that less compression is preferable for music relative to speech, especially for music from modern genres. 3
To test our hypotheses, we assessed the sound quality of music stimuli from a set of genres in three different conditions: no compression (linear), full compression (NAL-NL2), and semicompression (half the CR of NAL-NL2). Apart from the CR, all other compression parameters remained equivalent across conditions. To keep the session time for the participants below 2 hr, we tested only half of the genres from Experiment I: choir, opera, orchestra, pop, and schlager. We predicted that the linear condition would provide the best sound quality for the stimuli from the modern genres (pop and schlager) and that the semicompressive condition would provide the best quality for the stimuli from the classical genres (choir, opera, and orchestra). In addition to sound quality, participants were asked to provide direct judgments of dynamics. Dynamics was defined as the perceptual correlate to dynamic range. The dynamics ratings were used to verify whether the differences in dynamic range across the three dynamic compression schemes were perceptible. Potential differences between conditions in spectral shape and loudness were controlled, and participants were additionally asked to provide direct judgments of loudness.
Participants
Thirty-one hearing-impaired listeners (ages 48–80, mean age 69) were recruited from the internal database of Sonova AG headquarters, Stäfa, Switzerland. The audiometric data were assessed within 3 months of the first test date. All participants were Swiss and native German speakers.
The participants’ music experience was assessed with a questionnaire according to Kirchberger and Russo (2015). The questionnaire asks participants a series of questions about music training and activity to arrive at an overall measure of music experience.
Characteristics of the Test Participants: Audiometric Data (dB HL), Age (Years), Hearing Aid Experience/HAE (Years), Music Experience/ME (Range From −3: Low to 4: High), and Coupling (Dome: o. = Open, cl. = Closed, po. = Power; Rec./receiver: s = Standard, p = Power).

Note. NT indicates a hearing threshold that was not tested.
Test Conditions
In the experiment, participants compared the effect of linear, semicompressive, and compressive parameterizations of hearing aids on the perception of 20 music segments. In the compressive condition, the compression parameters of the participant’s individual NAL-NL2 fitting were used. In the linear and the semicompressive condition, the CR of the compressive condition was modified to
Control of spectral shape and level
Dynamic compression can change the overall level of a signal. Moreover, in multiband dynamic compression systems, such as that which can be found in state-of-the-art hearing aids, the gain calculation and application differs across bands. As a consequence, multiband dynamic compression can change the level of each band independently and therefore also modify the spectral shape of a signal (Chasin & Russo, 2004). The experiment, however, aims at investigating the perception of different dynamic ranges. Changes in spectral shape across conditions would impose a bias. To limit this potential bias, controls were put in place so that within each band, the same gain was applied (on average) in the linear, semicompressive, and compressive setting. Specifically, the gain curves of the three different conditions within each band were aligned to intersect at the RMS level of the input in the corresponding band (Figure 3). As the intersection was already defined by the compressive gain curve (NAL-NL2 fitting) and the RMS levels of the stimuli, the linear and semicompressive gain curves were adjusted so that they intersected at the same point. The RMS levels of the stimuli across bands were measured with the same setup as described later in section ‘Test Stimuli’. The measurements were retrieved from the hearing aid so that any potential inaccuracies of the transfer functions for the loudspeakers, the head, and the microphones were accounted for. To further increase the precision, the RMS measurements were conducted for both ears so that two different RMS sets were available for the right and left hearing aid correspondingly.
Schematic gain curves within a compression band for the linear, semicompressive, and compressive condition. The compression ratio of the semicompressive condition (CRsemi = Δgain/Δinput) is half the compression ratio of the compressive condition (CRcomp = 2 * Δgain/Δinput).
The gain curve alignment was carried out manually for both conditions, each band (20), segment (20), participant (31), and both ears resulting in 2 × 20 × 20 × 31 × 2 = 49,600 manually adjusted curves.
Control of loudness
We further controlled the loudness of all stimuli with the dynamic loudness model (DLM) by Chalupper and Fastl (2002). In contrast to other loudness models such as the well-established Cambridge loudness model developed by Moore (2014), DLM supports the loudness calculation of nonstationary signals in hearing-impaired listeners. To simulate each participant’s individual hearing loss, the air-conduction thresholds, bone-conduction thresholds, and uncomfortable loudness levels at 0.5, 1, 2, and 4 kHz were entered into the model. As the lengths of the stimuli were between 9 and 16 s, it was necessary to average the loudness values of the model across time. The long-term loudness of the whole stimulus was determined according to Croghan, Arehart, and Kates (2012) as the mean of all long-term loudness levels that were above two phons (corresponding to absolute threshold). If loudness differences between the three conditions of a music segment were greater than one phon, the linear or semicompressed versions were amplified so that the deviations were within one phon of the compressed version. Figure 4 illustrates the loudness curves for one segment and participant combination (Segment 3, Participant 29).
Example loudness curves of the linear, semicompressive, and compressive version (here for participant 29 and stimulus 3).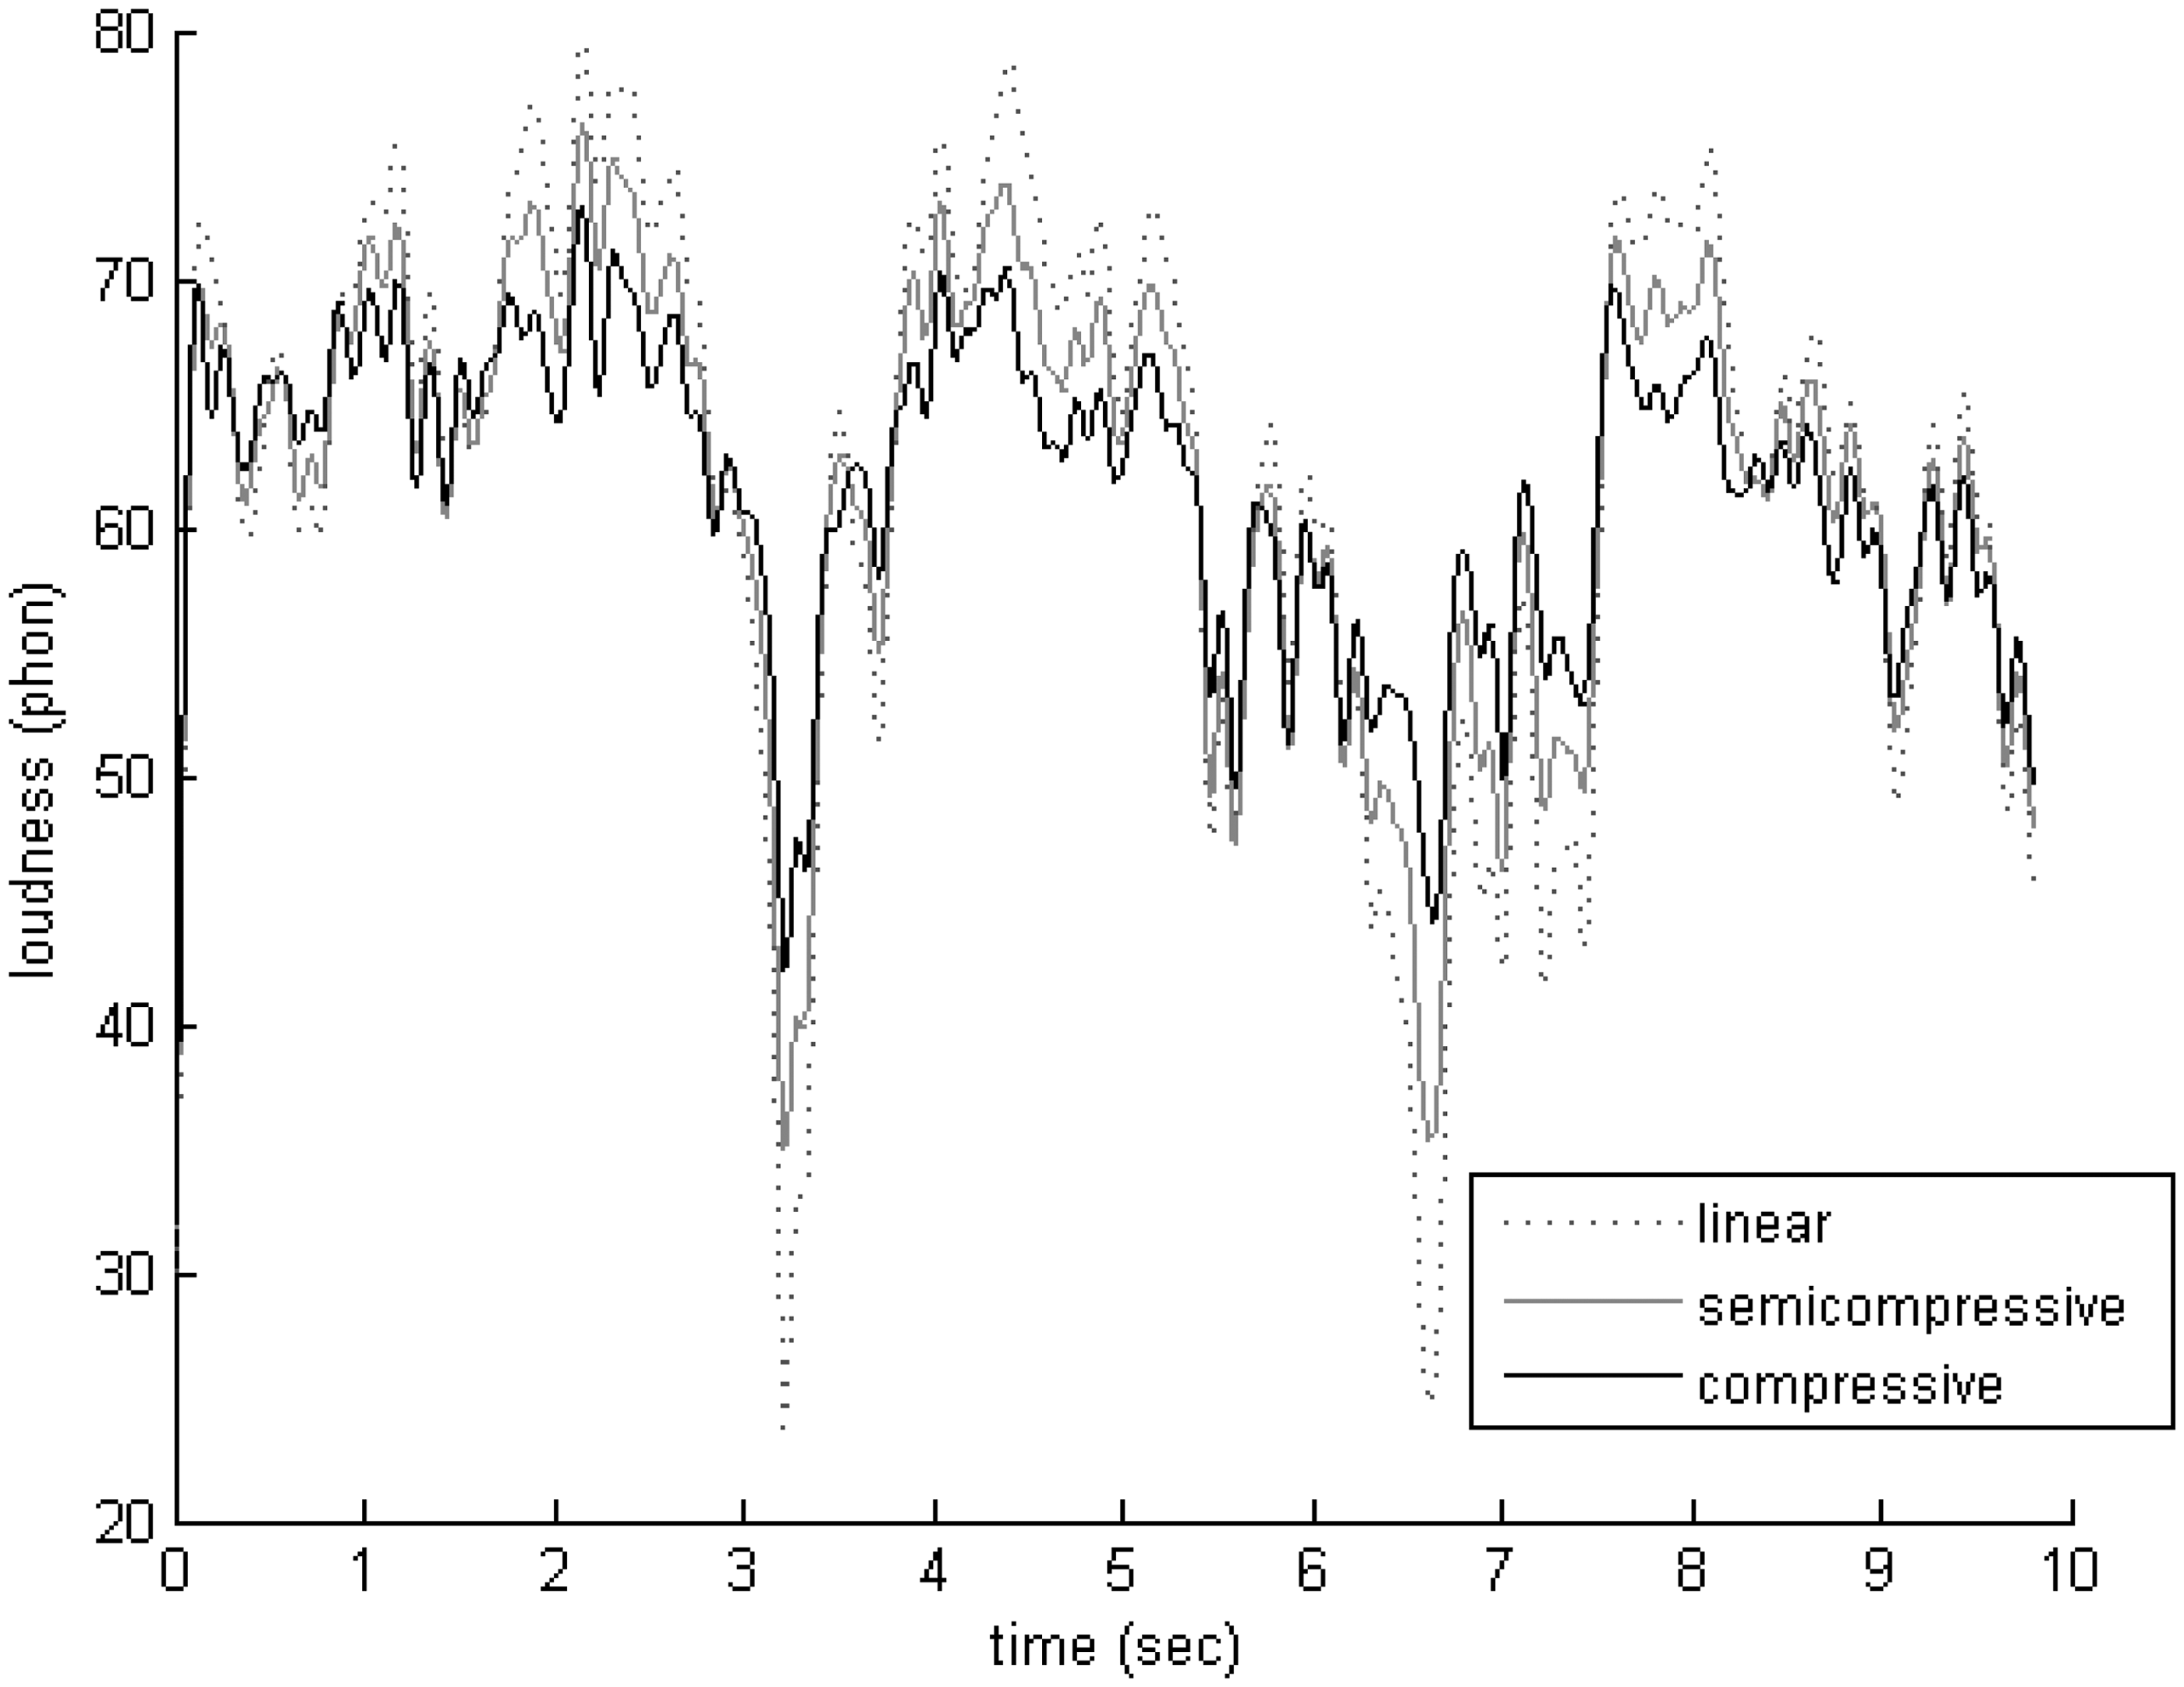
Test Stimuli
Twenty songs (four from each genre choir, opera, orchestra, pop, and schlager) were used from the audio corpus described in the first experiment. Segments were selected at points consistent with musical phrasing. The average dynamic range of the segments of each genre was similar to the dynamic range of the larger sample used in Experiment I (Figure 5).
4
Further details about the segments are provided in Table 4.
Dynamic range of the test sample in Experiment 2 (left column) and the audio corpus in Experiment 1 (right column) for the genres choir, opera, orchestra, pop, and schlager. The lines represent percentiles in dB (SPL) across frequency in kHz (99th: upper dashed line, 90th: upper solid line, 65th: thick line, 30th: lower solid line, and 10th: lower dashed line). Details About the 20 Music Segments of Experiment 2 (Music Taste: Participant’s Average Music Taste Ratings [−1: Do Not Like; 1: Like]).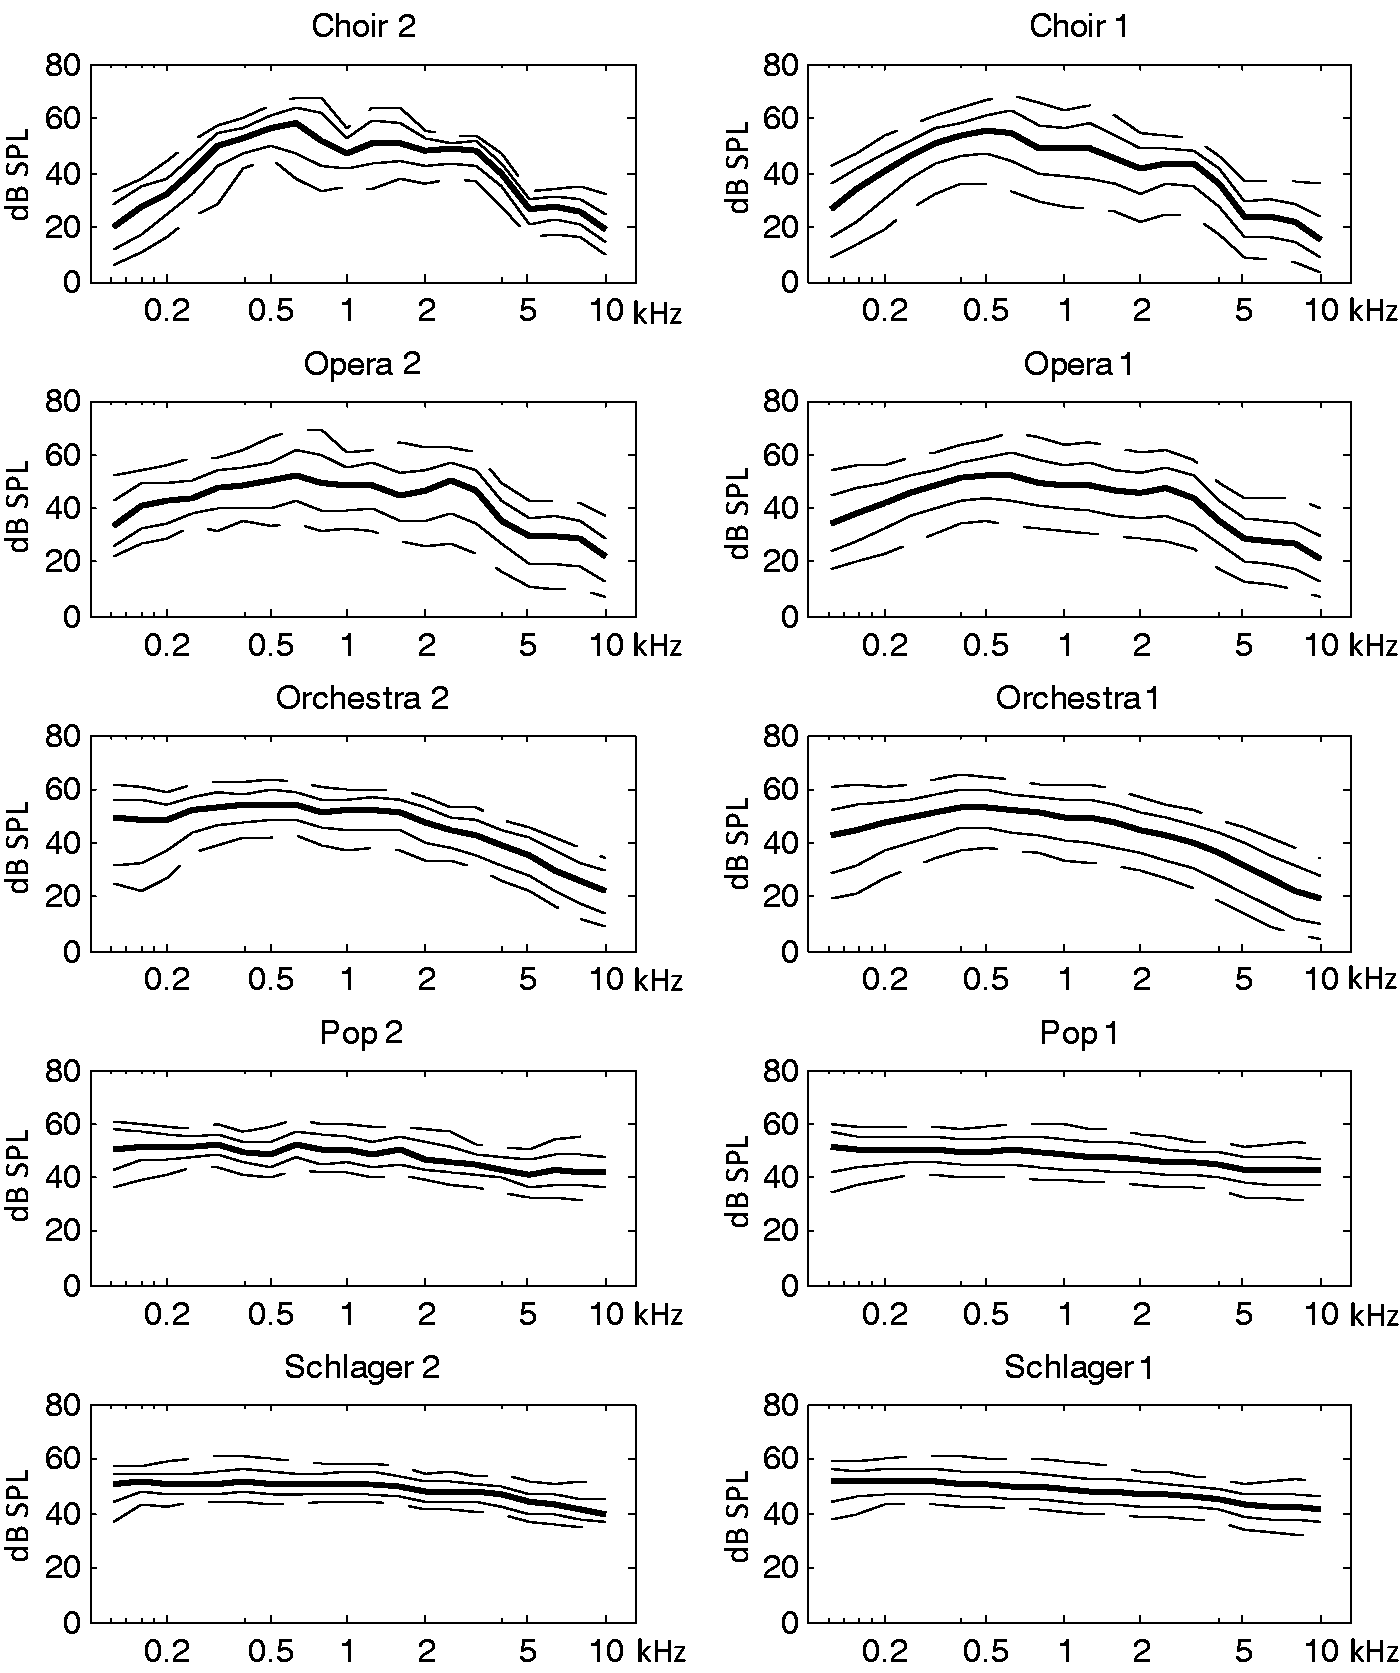

The test stimuli for each participant were generated by recording the music segments with a KEMAR manikin (model 45BB by G.R.A.S.) that had hearing aids attached to the ears. Music segments were played back in stereo via two loudspeaker pairs in 1.2 m distance at an angle of 30° and −30°, as common practice in audio engineering (Dickreiter, Dittel, Hoeg, & Wöhr, 2014). Each loudspeaker pair consisted of a mid- to high-range speaker (Meyer Sound MM-4-XP) and an aligned subwoofer (Meyer Sound MM-10-XP). The output level of each music segment was normalized to 65 dB SPL to ensure realistic and comparable listening levels (Croghan et al., 2012, 2014). The stimuli were prepared for each participant individually. Exact copies of the participant’s hearing aids were fitted to the KEMAR, including the coupling (open, closed, or power dome); receiver (standard or power); and individual fitting. For each of the 60 test stimuli (20 segments × 3 conditions), the corresponding hearing-aid parameterizations were uploaded to the hearing aids prior to recording the individual stimulus. Recordings were made in stereo with microphones located in both KEMAR ears at the position of the eardrums. The recordings were equalized before further processing to compensate for the ear resonance of the KEMAR and the frequency response of the Sennheiser HD 600 headphones that were used for playback in the test sessions.
Listening Test
The participants conducted listening tests on two separate occasions to compare the linear, semicompressive, and compressive parameterizations. The setup of the music test was a double-blind multistimulus test method similar to a Multiple Stimuli with Hidden Reference and Anchor (MUSHRA) setup as described in the recommendation ITU-R BS 1534-1 (2001). In each trial, participants had to rate 3 stimuli on a scale from 0 to 100. The three stimuli differed in dynamic range and were processed by a linear, a semicompressive, or a compressive (NAL-NL2) hearing-aid setting.
Participants were asked to make judgments along two dimensions: sound quality and dynamics. Dynamics was explained as the difference between loud and soft passages. The scales used for the ratings ranged from poor to good for sound quality and from low to high for dynamics. Participants were instructed to focus on the relative differences between the conditions within one trial rather than trying to make absolute ratings across trials. Participants were assigned to one of two groups and carried out 20 trials per dimension, one trial for each music segment. Group A started with judgments about the sound quality dimension, while Group B started with judgments about the dynamics dimension. Allocation of participants to the two groups was controlled in a manner that minimized differences in age, hearing loss, or music experience.
The tests were implemented in MATLAB and displayed as a graphical user interface on a touch screen in front of the participants. The stimuli were randomly assigned to one of the three channels: A, B, or C (cf. Figure 6). The stimuli were looped endlessly, and the transitions from the end to the beginning of each loop were not noticeable, as the music segments were selected to preserve musical phrasing.
Example screen of the main test.
Participants were freely able to switch between channels (stimuli) at any given time. A 5-ms cross-fade was applied while channel switching to avoid switching artifacts such as pops.
Although loudness was well controlled in the experiment, we additionally asked participants to compare the loudness of the test stimuli across conditions. In 20 trials, participants had to compare and rate the loudness of the linear, semicompressive, and compressive version of a music segment on a scale from 0 to 100. Scale ends were labeled from soft to loud. Participants were instructed not to focus on singular events but on the stimuli as a whole to provide an overall impression of loudness.
Finally, participants indicated their music taste by rating how much they liked the music segments. They listened to the semicompressed versions of the music segments and rated them on an absolute three-step scale (−1: do not like, 0: neutral, 1: like).
Results
Quality
For the statistical analysis, the IBM SPSS Statistic 22 software program was used. The quality ratings were subjected to a repeated-measures analysis of variance (ANOVA) with session (test, retest); condition (linear, semicompressive, compressive); and genre (choir, opera, orchestra, pop, schlager) as within-subjects factors. In cases where sphericity was violated, Greenhouse-Geisser corrections were used if the epsilon test statistic was lower than .75; otherwise, the Huynh-Feldt corrections were applied as proposed by Girden (1992). There was no effect of session, F(1, 30) = 0.115, p = .737, but a significant effect of condition, F(1.2, 38.5) = 21.09, p < .001, and genre, F(4, 120) = 2.705, p = .034. There were no interactions between session and condition, F(1.39, 41.6) = 0.130, p = .800; session and genre, F(2.49, 74.5) = 0.728, p = .514; or condition and genre, F(5.5, 164.4) = 1.746, p = .120. The linear condition was rated highest in quality (60.53) followed by the semicompressive (54.30) and the compressive condition (47.43; Figure 7). A Bonferroni-corrected post-hoc comparison of the conditions revealed significant differences between all pairwise comparisons: linear versus semicompressive, F(1, 30) = 13.08, p = .001; linear versus compressive, F(1, 30) = 24.25, p = .001; and semicompressive versus compressive, F(1, 30) = 21.74, p = .001.
Ratings and standard error for the data on dynamics, quality, and loudness in the linear, semicompressive, and compressive condition.
Dynamics
For the data on dynamics, the same statistical analysis was applied as for the data on quality. There was no effect of session, F(1, 30) = 0.067, p = .798, but a significant effect of condition, F(1.1, 32) = 49.17, p < .001, and genre, F(2.52, 75.5) = 4.030, p = .015. There was no interaction between session and condition, F(1.45, 43.5) = 0.060, p = .890, or session and genre, F(2.84, 85.3) = 0.981, p = .402, but a significant interaction between condition and genre, F(3.5, 105.9) = 3.47, p = .014. The linear condition had the highest ratings for dynamics (63.63), followed by the semicompressive (52.32) and the compressive condition (43.88; Figure 7). The mean difference scores are displayed in Figure 7. A Bonferroni-corrected post-hoc comparison of the conditions revealed that differences were significant for all pairwise comparisons: linear versus semicompressive, F(1, 30) = 51.73, p < .001; linear versus compressive, F(1, 30) = 50.61, p < .001; and semicompressive versus compressive, F(1, 30) = 39.52, p < .001. With regard to the interaction between condition and genre, the differences in dynamics between the linear and the compressive condition were largest for opera (Δ = 23.12) followed by orchestra (Δ = 21.02), choir (Δ = 20.01), pop (Δ = 18.55), and schlager (Δ = 16.05).
Loudness
An ANOVA was carried out with condition (linear, semicompressive, compressive) and genre (choir, opera, orchestra, pop, schlager) as within-subject factors.
There was a significant effect of condition, F(1.1, 33.5) = 26.99, p < .001, and genre, F(2.16, 64.7) = 4.030, p = .020, but no interaction between condition and genre, F(5.1, 153.7) = 2.157, p = .06. The linear condition was rated loudest (56.81), followed by the semicompressive (51.35) and the compressive condition (47.94). A Bonferroni-corrected post-hoc comparison of the conditions revealed significant differences between all pairwise comparisons: linear versus semicompressive, F(1, 30) = 29.28, p < .001; linear versus compressive, F(1, 30) = 14.68, p = .001; and semicompressive versus compressive, F(1, 30) = 28.11, p < .001.
Discussion
Quality
The findings confirmed the hypothesis that less compression benefits the perception of quality. The quality of the linearly processed stimuli was judged to be best, followed by the semicompressive and the compressive setting. Against the background that the participants were acclimatized to hearing aids fitted with the compressive setting, the results appear even stronger. On the basis of the mere-exposure effect (Bradley, 1971; Gordon & Holyoak, 1983; Ishii, 2005; Szpunar, Schellenberg, & Pliner, 2004; Zajonc, 1980), we would expect a bias toward the compressive scheme that participants had grown accustomed to during the acclimatization period.
The results from this study are consistent with results from previous studies in confirming that less compression for music is beneficial for sound quality. A reason why the least compressive condition consistently yielded the best sound quality might be that the primary focus in music listening is enjoyment rather than intelligibility (Chasin & Russo, 2004). Dynamic compression introduces distortion (Kates, 2010). Listeners might be more sensitive to distortion introduced by compression in music than in speech. Therefore, the trade-off between audibility for soft parts and introducing distortion might shift toward less distortion and therefore to even less compression than the dynamic properties might suggest.
The optimal compression strength, however, varied on an individual level. Seven participants judged the quality of the semicompressive or compressive processing superior to the linear processing. To understand the reason for these perceptual differences, participants were asked after the tests to verbally describe their subjective quality criteria. While instrument separation, liveliness, clarity, bandwidth, and intelligibility of lyrics were assessed as positive factors, inaudible passages or loudness peaks were mentioned as detrimental for sound quality. The latter criterion was shared among all four participants who gave the highest quality ratings for the compressive conditions.
Dynamics
The perception of dynamic differences between the linear, semicompressive, and compressive conditions completely align with the experimental manipulations. Participants rated the linear version highest in dynamics, followed by the semicompressed and the compressed versions. As the pairwise comparisons between versions were significant and there was also no effect of session, it can be assumed that participants reliably perceived differences between the three dynamic conditions.
Furthermore, perceptual differences between the conditions varied across genre. The effect of compression was perceptually bigger for genres with a larger original dynamic range such as opera and orchestra than in less dynamic genres such as pop or schlager.
The fact that participants were asked to judge dynamics as well as quality may have biased participants to consider quality in terms of dynamics. We ran the repeated-measures ANOVA with a between-subjects factor that divided the participants into two subsets: One subset contained the participants who started with evaluating differences in dynamics (N = 15), and the other subset contained the participants who started with evaluating differences in quality (N = 16). The analysis revealed that the effect of order was not significant, F(1.2, 38.5) = 2.562, p = .120.
Loudness
Although loudness was equalized between conditions prior to the experiment using the DLM loudness model by Chalupper and Fastl (2002), participants rated the stimuli in the linear condition significantly louder than in the semicompressed condition and softest in the compressed condition. Two reasons might have contributed to this deviation: First, our approach to average loudness in phons as proposed by Croghan et al. (2012) might underestimate the long-term loudness perception of dynamic stimuli in hearing-impaired listeners. Second, loudness judgments for stimuli with a length of approximately 10 s are extremely difficult. By design, the linear stimuli have the loudest passages but also the softest passages compared with the semicompressive or compressive stimuli. Participants may overvalue loud passages when trying to determine an average for the overall loudness perception of the stimuli.
To outweigh a potential effect of loudness differences between conditions on quality ratings, an experimental post-hoc repeated-measures ANOVA was conducted in which the loudness scores were subtracted from the quality test scores. As with the original analysis, the differences in the linear condition were highest (3.75), followed by the semicompressive (2.90) and the compressive condition (−0.16). The differences between conditions were significant, F(1.4, 42.9) = 4.81, p = .022.
General Discussion
The present study analyzed the dynamic range of an audio corpus of 1,000 recorded songs and 28 monologue speech samples in quiet. A genre-specific analysis revealed that the recorded music samples of all genres generally had smaller dynamic ranges than the speech samples. As a consequence, a further study was conducted in which the compression of the NAL-NL2 prescription rule was compared with linear and semicompressive processing. There was a significant trend that linear amplification yielded the best sound quality, followed by semicompressive and compressive (NAL-NL2) processing.
The current study was based on recorded music. Live music, singing, or practicing an instrument are other forms of music consumption. Further research is required to analyze the acoustic properties in these auditory scenes and to adjust the dynamic compression in hearing aids accordingly. An ongoing challenge for hearing aids is the processing of high-level peaks that are often experienced in live music (e.g., Ahnert, 1984; Cabot, Center, Roy, & Lucke, 1978; Fielder, 1982; Sivian, Dunn, & White, 1931; Wilson et al., 1977; Winckel, 1962).
The genre-based classification as performed in this study is one approach to organize music. Further fragmentation might reveal systematic differences in dynamic range within genres (e.g., Baroque vs. Romantic orchestra music) that should be addressed by hearing-aid signal processing. Ideally, the compression parameters would adapt to individual songs or even adapt within a song. Streaming services could potentially incorporate information about the dynamic range so that the hearing aids can optimize the compression accordingly. A short delay in playback (look-ahead time) would also allow the possibility of continually adjusting the compression parameters.
There is a secondary finding from the analysis of compression in recorded music that is also worth noting. As may be seen in Figure 1, the spectra of the modern genres, speech, and the classical genres are distinct. The high frequencies are particularly prominent in the modern genres, followed by speech and then classical genres. Because of these differences, one common multiband dynamic compression setting may apply too little gain for modern genres or too much gain for classical genres in the high-frequency bands. It may be that benefit would be gained by setting the compression curves differently for each of these three signal categories.
Footnotes
Acknowledgments
We particularly want to thank Dr. Markus Hofbauer and Dr. Peter Derleth for their valuable support and our fruitful discussions. We further wish to thank the participants for taking part in this study and for appearing to each session as scheduled. We also thank our colleagues for letting us occupy the laboratory facilities for a long time of fitting and measurements.
Declaration of Conflicting Interests
The authors declared no potential conflicts of interest with respect to the research, authorship, and/or publication of this article.
Funding
The authors disclosed receipt of the following financial support for the research, authorship, and/or publication of this article: The research protocol for this study was approved by grant (KEK-ZH. Nr. 2014-0520) from the Ethics Committee Zurich, Switzerland and was registered at ![]() (ID: NCT02373228). Financial support for this research was provided by ETH Zürich, Phonak AG, and the Natural Sciences and Engineering Research Council of Canada.
(ID: NCT02373228). Financial support for this research was provided by ETH Zürich, Phonak AG, and the Natural Sciences and Engineering Research Council of Canada.