
Abstract
Online restaurant reviews contain expressions of customer expectations in prose as well as in star ratings that indicate overall customer satisfaction. In prose, one way customers communicate that expectations are or are not met is through a grammatical construction called adversative connectives (ACs) (i.e., constituents such as but, although, however, and even though). In the present study, we examine the relationship between star ratings and customers’ use of ACs by employing a combination of content analysis, mixed-effects models, and thematic analysis in a corpus of nearly 35,000 online reviews for restaurants located in the United States. The results reveal an important way customers communicate their (dis)satisfaction online. Specifically, the statistical modeling indicates that the ACs used and the content they emphasize have a significant relationship with star ratings. Restaurant owners can use these findings to focus on the most important information in customer reviews, especially when they are sifting through many reviews or through reviews for which no summative rating is provided.
Keywords
Online reviews play an important role in the economic success of restaurant owners across the world. In France, restaurant owners reported in interviews that many factors can affect how much online reviews influence a restaurant’s revenue, but 20 out of 27 (74%) of those restaurant owners reported that online reviews had a noticeable or strong impact on revenue (Beuscart et al., 2016, p. 463). One survey in the United States reported that 98% of consumers read online reviews for local businesses, with 76% of consumers reporting that online reviews play an important or very important role in their decisions to use the products or services of companies within the food and drink sector (Pitman, 2022). In Thailand, interviews indicated that 16 out of 30 (53%) consumers find that the sentiment (positive or negative) of online comments influences their decisions to visit a pub or restaurant, with 17 out of 30 (57%) consumers reporting that the star rating affects their decisions (Chanvenukool, 2017). Additional insight into how consumers communicate in online reviews could benefit restaurant owners, whose livelihoods are affected by the reviews.
To aid restaurant owners in their efforts to understand reviews and improve their businesses based on the content of reviews (Beuscart et al., 2016), researchers have analyzed the lexical elements of reviews, such as keywords. In an analysis of co-occurring keywords in a set of Yelp reviews, researchers found that in the age of COVID-19, reviews with keywords focusing on a lack of compliance with safety protocols had lower-star ratings, while reviews with keywords focused on dining and take-out had higher-star reviews (Kostromitina et al., 2021). Similar methods have found that low-star reviews tend to focus on service; middle-star reviews tend to focus on the quality of the food; and high-star ratings focus more broadly on service, food, and experience (Keller & Kostromitina, 2020). In the present study, we build on these studies and other previous research to help restaurant owners make improvements to their restaurants through a greater understanding of their restaurants’ reviews. The goal for this study is to extend previous research by analyzing additional linguistic characteristics of customer reviews (i.e., adversative connectives or ACs) that achieve a pragmatic effect of evaluation.
Literature Review
To situate this study in relation to previous research, this literature review will focus on studies related to linguistic analysis of online reviews, to ACs and customer expectations, and to ACs and emphasis.
Linguistic Study of Reviews
A robust body of literature exists examining reviews from a linguistic perspective. Such research is diverse and covers areas as different as sentiment analysis of narrative framing (Jurafsky et al., 2014), multimodal semiotic analysis comparing genres of reviews (Chik & Vásquez, 2017), the relationship between platforms’ affordances and the expression of negativity (Ruytenbeek et al., 2021), and pragmatic analysis of the (in)directness of complaints (Depraetere et al., 2021). Particularly worth noting is Vásquez’s (2014) treatment of the discourse of reviews in which she undertook a mixed- and multi-method linguistic study of several data sets of reviews for hotels (Tripadvisor), consumer goods (Amazon), films (Netflix), recipes (Epicurious), and restaurants (Yelp). Vásquez (2014) addressed many topics, especially the nature of evaluation in the context of online reviews through the use of various linguistic devices. Particularly relevant to the present study is Vásquez’s (2014) finding that in consumer reviews, the AC but is used to juxtapose differing perspectives and to build a sense of objectivity on the part of the reviewer (pp. 50–51). Vásquez (2011, 2014) notes that reviewers frequently use a positive statement contrasted by a subsequent negative statement and separated by an AC, which is a phenomenon that we investigate further in the present study.
Adversative Connectives and (Customer) Expectations
ACs are defined as “expressions that indicate semantic relations of contrast or concession between text spans” (Zhang, 2021, p. 3). ACs include single words such as but and however and multiword units such as in contrast and on the other hand. Halliday and Matthiessen (2004) affirm that ACs semantically require two types of elements: (1) an expectation and (2) a contrast to that expectation. Others have expressed this idea as the expression of an expectation and the denial of expectation (Beaver & Clark, 2008; Lakoff, 1971). For instance, consider this example from the Yelp restaurant reviews corpus (Keller & Kostromitina, 2020) used in the present study: Example 1 Drinks were good as usual
Here, the bolded AC conveys that the preceding statement was an expectation that was met regarding beverages, but what follows describes an expectation that contrasts with the met beverage expectation—an unmet expectation regarding the service in the restaurant. As will be discussed later, the expectation expressed prior to the AC is not what is important. Rather, the focus is on what comes afterwards, which describes how the expectation was not met.
The AC construction consists of three parts: the first constituent, the second constituent, and the connective itself. A constituent is defined as a word or group of words that functions as a single unit, such as a phrase, clause, or even a whole sentence (see, e.g., Biber et al., 1999). In Example 1, the first constituent is the whole clause preceding however, the AC is however, and the second constituent is the whole clause following however. Note that the location of however in the example sentence could have appeared in multiple locations (e.g., “the staff’s service, however, needs improvement” or “the staff’s service needs improvement, however”). Regardless of where the AC is placed, the order of the two constituents can remain the same.
Establishing expectations is oftentimes an important part of the pragmalinguistic act of evaluation. In evaluation, attitudinal stance can be signaled through grammatical devices including connectives (Biber et al., 1999, pp. 966–969; see also, Biber, 2006). Because ACs presuppose the establishment of expectations, they can be useful tools in evaluative language like online reviews (Lu et al., 2021) and in communicating customer (dis)satisfaction.
Customer satisfaction has been conceptualized as “an evaluation of the surprise inherent in a product acquisition and/or consumption experience” (Oliver, 1981, p. 27). Oliver (1980) found evidence that a customer’s post-consumption satisfaction could be modeled as a function of the customer’s expectations of a product or service and the customer’s post-consumption perception of how well the product or service met those expectations. According to Engler et al.’s (2015) interpretation of and framework for online product ratings, online ratings can serve as a proxy for customer satisfaction because they capture customer product expectations and customer evaluation of product quality. Broadly, this model of expectations and evaluation of experience is known as the expectancy-disconfirmation paradigm (EDP), described by Yüksel and Yüksel (2001) in this way: The EDP implies that consumers purchase goods and services with prepurchase expectations about anticipated performance. The expectation level then becomes a standard against which the product is judged. That is, once the product or service has been used, outcomes are compared against expectations. If the outcome matches the expectation, confirmation occurs. Disconfirmation occurs where there is a difference between expectations and outcomes. A customer is either satisfied or dissatisfied as a result of a positive or negative difference between expectations and perceptions. Thus, when service performance is better than initially expected, there is a positive disconfirmation between expectations and performance that results in satisfaction, and when service performance is as expected, there is a confirmation between expectations and perceptions that results in satisfaction. In contrast, when service performance is not as good as expected, there is a negative disconfirmation between expectations and perceptions, which causes dissatisfaction. (p. 108)
Importantly, this resulting evaluation—whether positive or negative disconfirmation of initial expectations—has been found to be one of the strongest correlates of customer satisfaction across numerous studies (Szymanski & Henard, 2001), including for non-durable goods (Churchill & Surprenant, 1982).
Despite the function of ACs in communicating expectations (and whether expectations were met) and the possibility of consumers using ACs in online evaluative discourse, little research has investigated whether ACs communicate positive or negative disconfirmation of initial expectations and whether ACs correlate to customer satisfaction as measured through online ratings.
Adversative Connectives and Emphasis in Online Reviews
In addition to conveying expectations, ACs also help organize ideas. Quirk et al. (1972) described an organizational principle called “end weight” as “the tendency to reserve the final position for the more complex parts of a clause or sentence” (pp. 943–944). Since its early description (Behaghel, 1909), end weight has proven to be an important organizing principle in language across many language families, registers, and time periods (see, e.g., Eitelmann, 2016) at the clausal, sentential, and discoursal levels—not just for organizing complex information but also for emphasizing information that is important. In business and professional writing, then, end weight can help to explain why good writers place new information or the information they want to emphasize at the end of a sentence (Strunk, 2018; Williams & Bizup, 2016). Thus, it is frequently the case that when a connective is involved, the second constituent is more important than the first because of the way the constituent affects the reader’s interpretation of the text. Consider Example 2 from renowned Jewish philosopher-linguist Kripke (2017, p. 103) in the context of a job appointment.
Example 2 a. He is a classicist, b. He is a Jew,
Kripke (2017) points out that in the first example, the speaker “is arguing against the proposed appointment, or at the very least, intending to cast important doubt on it”; whereas in the second, “the speaker is still anti-Semitic, but he is much more likely to be arguing that the appointment should nevertheless be made” (p. 103). Thus, the second constituents connected by the ACs can be powerful indicators of the most important information that the speaker or writer wants to convey. Similarly, Horn (2022, p. 7) provides the following illustrative pair of sentences: Example 3 a. They’re smart b. They’re lazy
Note how the contents of the two sentences are practically identical, but the ordering of the ideas surrounding the AC entails two different meanings, and the two entailed meanings follow the contents of the second constituent. Importantly, some ACs are mobile because they are adverbial, such as however, nevertheless, and although. In Example 3, therefore, a different AC could have appeared at the end of the second constituent, such as in this modified example: “They’re smart. They’re lazy, however.” Regardless of where the AC appears, the end weight of the two constituents remains constant based on their order, with the second constituent bearing the weight. Such ordering indicates important semantic information that could help restaurant owners better understand their restaurants’ online reviews and the effect those reviews might have on potential customers.
Previous studies have established that the order in which positive or negative reviews are presented to potential customers influences their perceptions of the company being reviewed. When an equal number of positive or negative reviews are presented to potential customers, the customers perceived the company more positively or negatively depending on, correspondingly, whether the list of reviews both begins and ends positively or negatively (Purnawirawan et al., 2012). Within the list of reviews, the reviews presented in a negative-positive sequence tends to elicit a greater willingness to buy (Wang et al., 2022). Other experimental research suggests that one-sentence reviews presenting positive and then negative statements connected by an AC are perceived as more negative than reviews that do not include ACs (Lu et al., 2021).
We use the present study to build on these studies by examining the information packaging (i.e., end weight) of reviews—and thus the emphasis of the information within reviews—from the perspective of how a restaurant owner could interpret the reviews. Specifically, we quantitatively examine the polarity of the sentiment of all second constituents in AC constructions within reviews and its association with star ratings. In addition, we qualitatively examine themes communicated within individual second constituents in AC constructions to provide restaurant owners with some sense of the customers’ expectations communicated within the study’s data set.
Research Questions
As suggested in our literature review, more research is needed to determine whether ACs are used by restaurant customers to emphasize positive and negative disconfirmation information within the sentences of their full reviews and whether that emphasis associates with star ratings (i.e., overall customer satisfaction). Researching these two points could help restaurant owners better understand how their customers communicate their satisfaction or dissatisfaction online and thereby help owners improve their restaurants. Therefore, in this study we pose the following research questions (RQ):
(1) What is the relationship between polarity of sentiment of second constituents in AC constructions and star ratings in restaurant reviews?
(2) What specific aspects of the dining experience affected the association between the sentiment of second constituents and the star ratings?
Methods
Corpus of Data
Because the goal of this study was to analyze restaurant reviews, we used a data set consistent with that objective. The corpus of data used for this study was a subsample of the Yelp Academic Challenge Round 13 (YAC13) data set derived by Keller and Kostromitina (2020) to represent recent, independent, non-chain restaurants that were not affiliated with a hotel or resort. The YAC13 data set contains Yelp reviews data with rich metadata for a wide range of businesses, but in order to specifically represent the restaurant population of interest, several filtering criteria were used.
Because Yelp star ratings are less important for chain restaurants (Luca, 2011), Keller and Kostromitina’s (2020) focused on non-chain restaurants by removing the reviews of all businesses with non-unique business IDs and with names from Technomic’s 2018 list of 250 top-performing restaurant chains in North America. We restricted the time period for reviews to 2018 and 2019 so that only recent reviews were included. This enabled us to examine reviewer behavior under more typical economic conditions than those during COVID-19. The data set did not include businesses with the tags “resort” or “hotel” in its business categories, and any remaining business with “restaurant” as a business category was maintained. This was done to mitigate confounding variance in star ratings attributable to the quality of the associated hotels. This reduced the original data set of over 6,600,000 separate reviews down to 863,081 reviews. We further reduced the sample to balance the data across three stratifying variables: year (two levels: 2018 and 2019), star rating (five levels: 1–5), and price (three levels: $, $$, and $$$). This process produced a total of 30 strata (2 years by 5 stars by three price levels). From each stratum, 1,800 reviews were sampled, resulting in 54,000 reviews and 7,032,273 word tokens (mean per review = 130.23 tokens; SD = 118.30).
Concordance Sampling
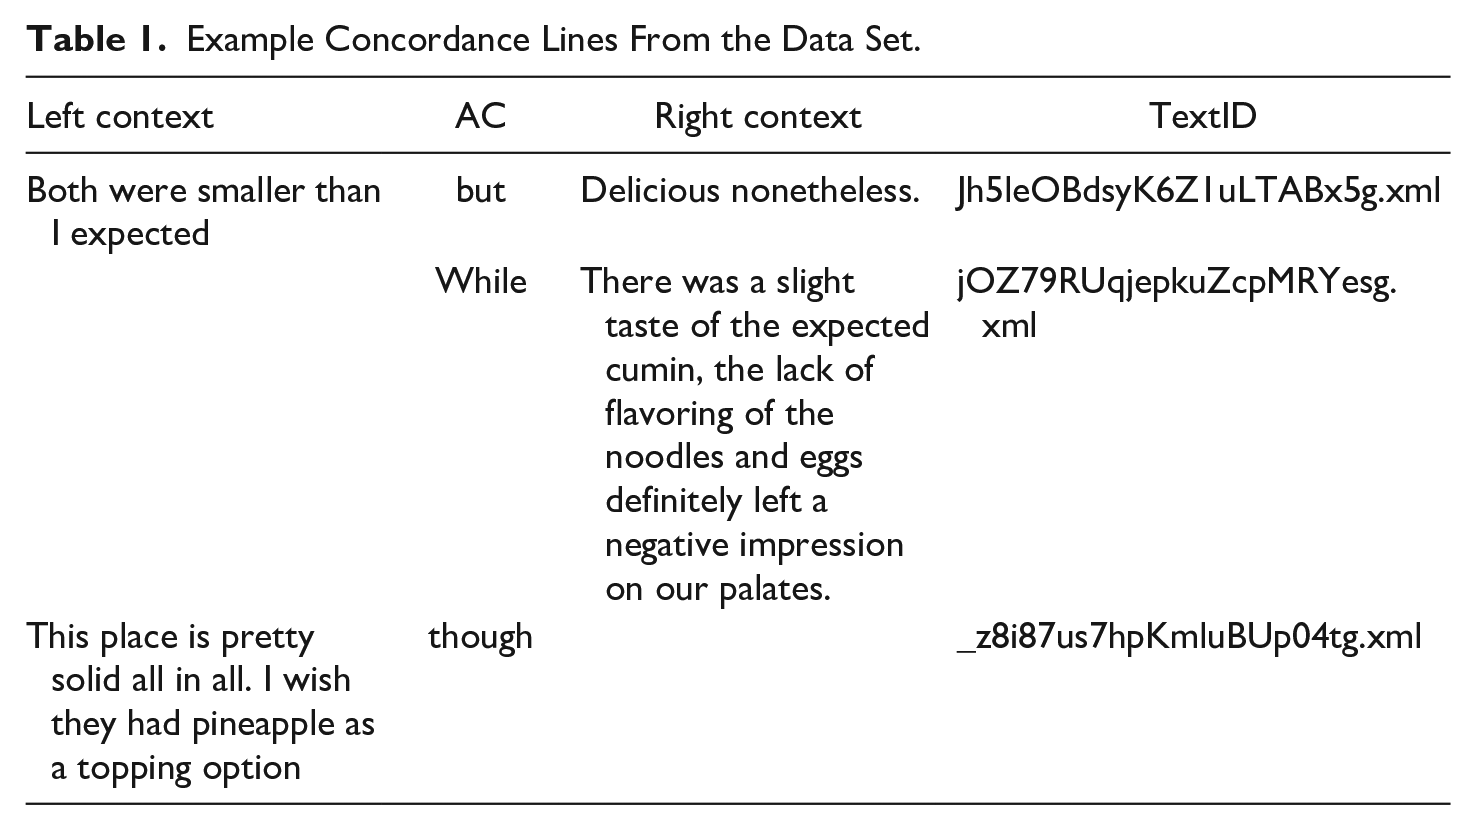
We searched the corpus for each occurrence of the following 17 AC forms: although, at the same time, but, conversely, however, in comparison, in contrast, instead, nevertheless, on the contrary, on the other hand, rather, still, though, whereas, while, and yet. This list of ACs was derived from Zhang (2021), who recently attempted to study all English ACs in learner language. Querying these terms resulted in 83,172 instances of potential ACs from 34,935 reviews. We then randomly sampled 1,000 reviews for further analysis. For each instance of ACs in the 1,000 sampled reviews, a concordance line (i.e., the AC with up to 30 words of context on either side of the word) was produced. Examples of concordance lines are shown in Table 1. As noted in the literature review, the AC does not always occur between the two constituents. Because ACs can function grammatically as conjunctive adverbs as well as conjunctions, they are fairly flexible in their syntactic placement.
Example Concordance Lines From the Data Set.
Manual Coding
To answer RQ #1, we needed to (1) determine the polarity of the sentiment of each second constituent, (2) ensure that the connectives were functioning adversatively, and (3) verify that the second constituents were evaluating the restaurant. We opted for manual coding using content analysis (Neuendorf, 2017) over automatic methods (e.g., sentiment analysis) for a few reasons. First, highly accurate sentiment analysis requires a context-dependent lexicon, which does not yet exist for restaurant reviews (Huang et al., 2020). Second, rule-based sentiment analysis was difficult to apply because of the messiness of the data; because the data were Yelp reviews, many—perhaps most—contained non-standard spelling, punctuation, and usage. Third, machine-learning sentiment analysis would be difficult to apply to this particular data set because we were unable to find an appropriate training data set. Fourth, after reviewing the concordance lines, we observed that not all ACs functioned as ACs. For example, the AC while might act concessively or temporally, and judgments needed to be made to ensure that temporal uses were not included in the data set. Last, the customers’ evaluations were not always based solely on actions caused by the restaurant (e.g., a reviewer might tell the story of a friend knocking over a glass of water, which was not the restaurant’s fault), and automatic methods would not have been sophisticated enough to make judgments in such circumstances. As an alternative for automatic sentiment analysis, we investigated the possibility of conducting manual content analysis of the data. Importantly, Neuendorf (2017, pp. 31, 170) observes that quantitative content analysis need not be used for analyzing only manifest content (e.g., counting the presence or absence of words associated with a sentiment); it can also be used for analyzing latent content (e.g., making judgments about word functions). Given that the coding of the data involved making judgments about latent content, we determined that content analysis would be more appropriate than other methods for assessing the polarity of the sentiment of the second constituents. Therefore, we followed established content-analysis procedures (Neuendorf, 2017), including developing a codebook, establishing reliability in a pilot study, and establishing final reliability in 10% of the final data.
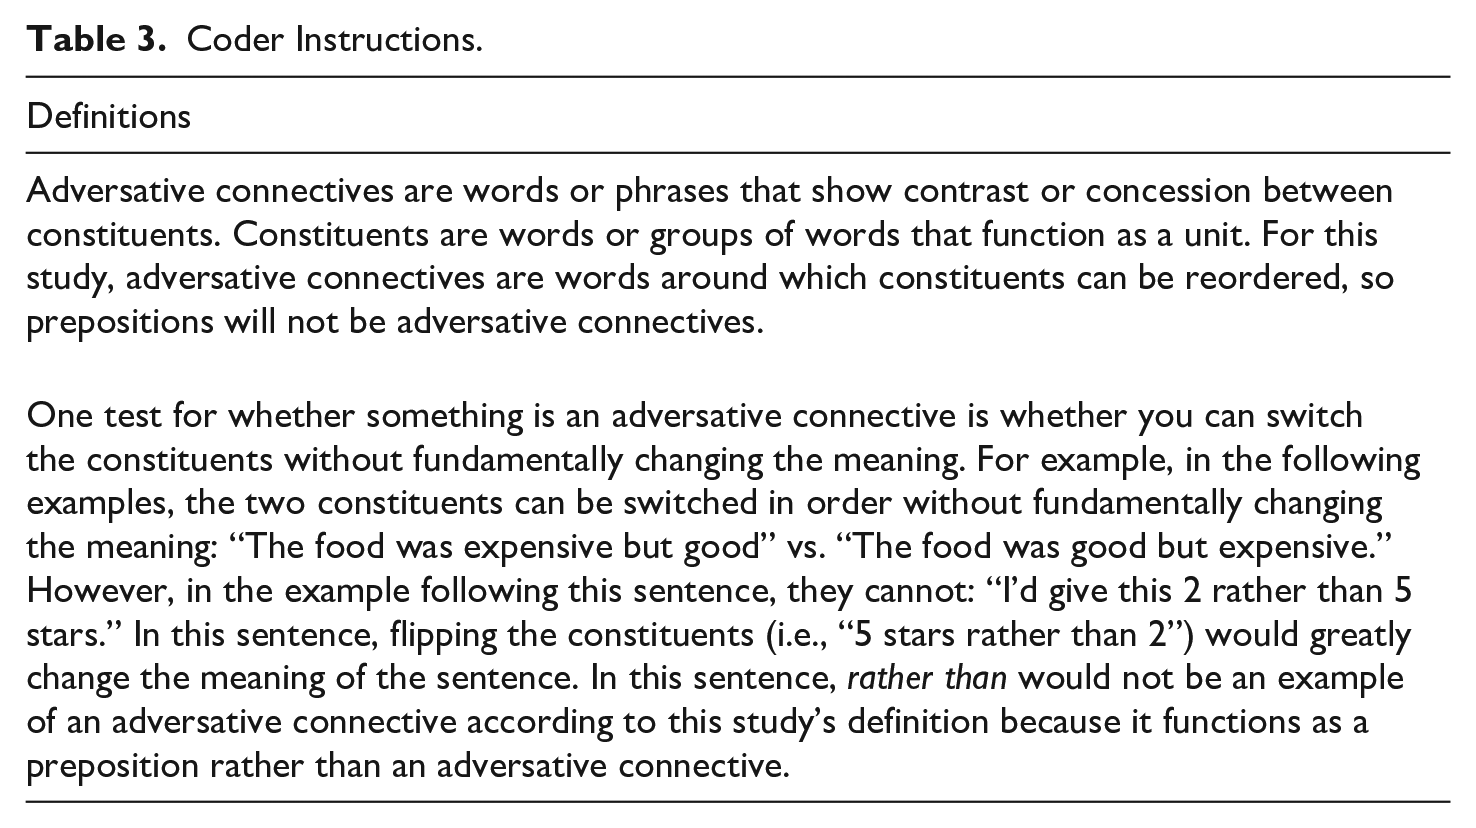
Codebook development for quantitative content analysis follows a deductive process to ensure an a priori research design before the final analysis of the data begins (Neuendorf, 2017, p. 18). Specifically, we used the existing theory of ACs, end weight, and polarity of the sentiment in online reviews (Behaghel, 1909; Kripke, 2017; Lu et al., 2021; Purnawirawan et al., 2012; Quirk et al., 1972; Wang et al., 2022; Zhang, 2021) to develop the final codebook (Table 2) and coder instructions (Table 3). This design enabled us to assess the reliability of the codebook independent of ourselves, an important component of quantitative content analysis (Neuendorf, 2017, p. 9).
Final Codebook.
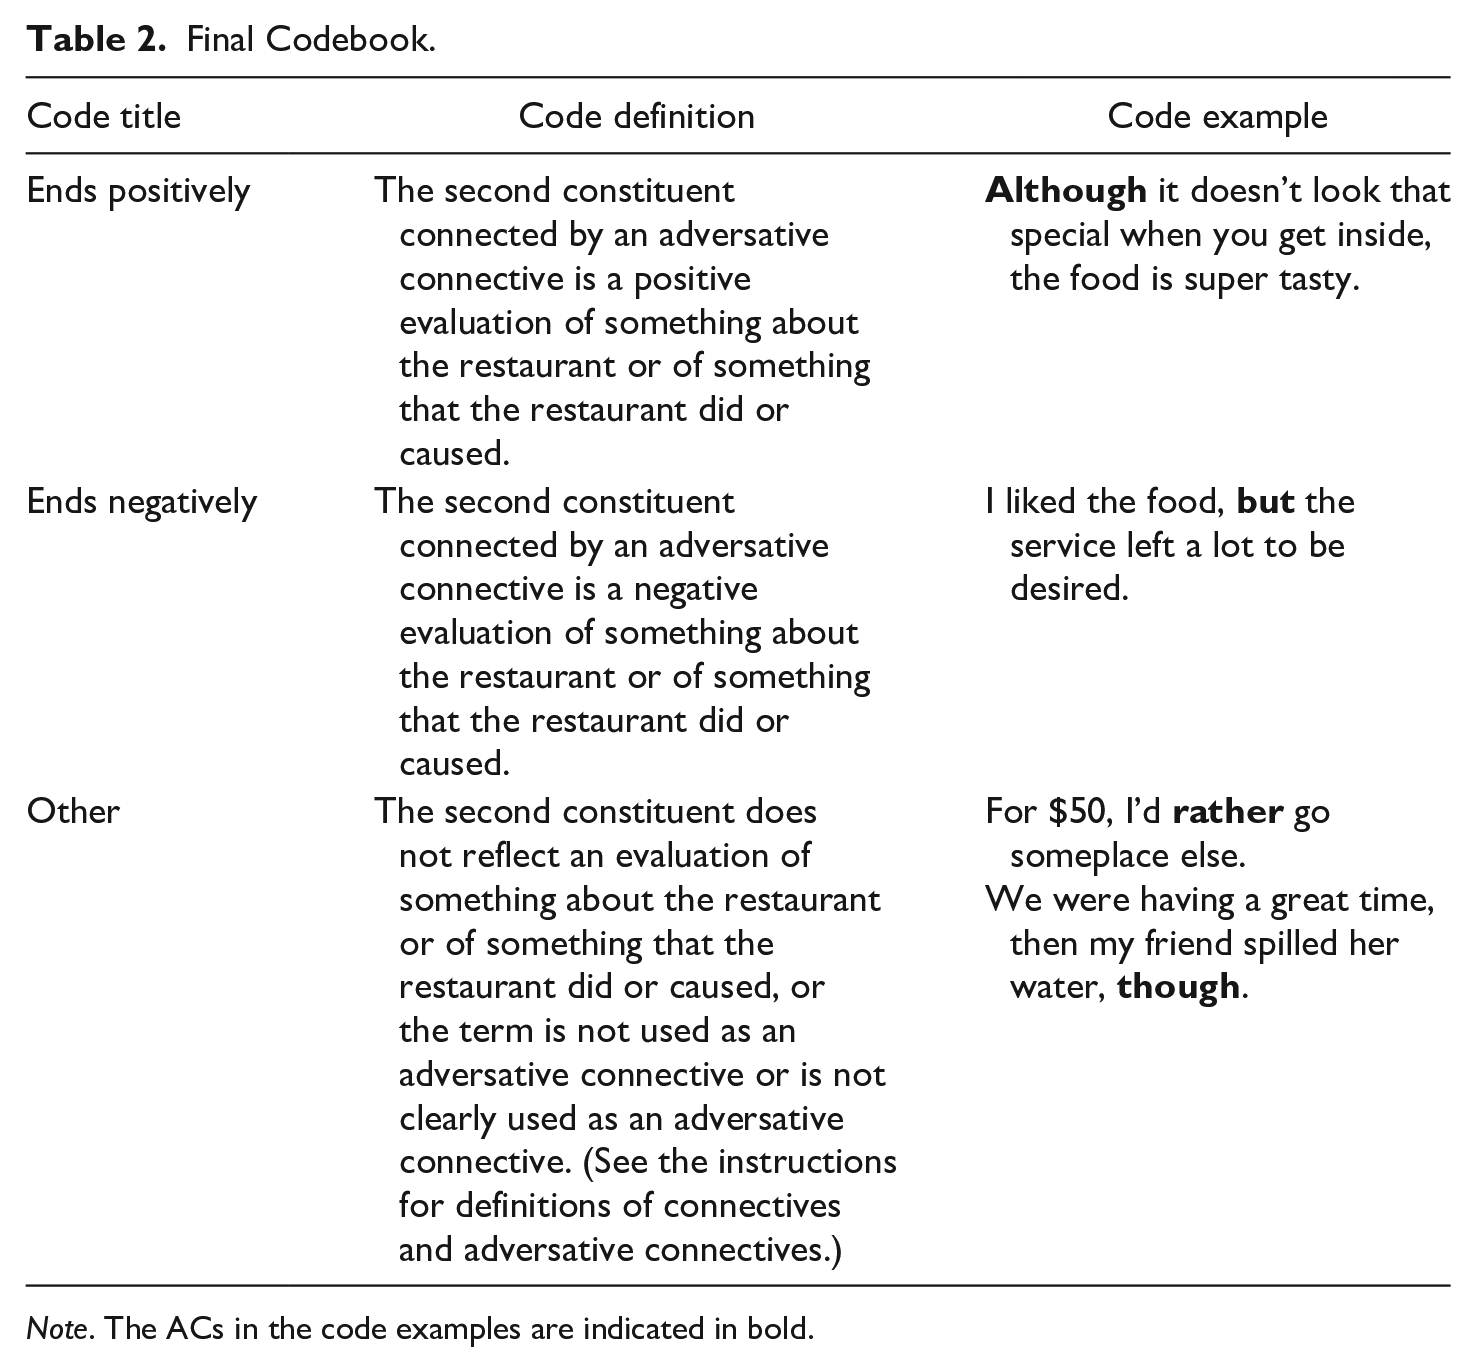
Note. The ACs in the code examples are indicated in bold.
Coder Instructions.
To assess the reliability of the codebook, a pilot assessment of 10% of the pilot-study data was conducted with two independent, undergraduate coders. Both coders had previously taken undergraduate courses in linguistics. Coders were provided with a sample of concordance lines, such as the ones in Table 1, as well as the full reviews from which the concordance lines were taken. Coders were trained, which involved coders reviewing the codebook with the researchers, practicing with the researchers the coding of several concordance lines, practicing independently on a set of concordance lines, reviewing and discussing their coding in comparison to the codebook, and clarifying the codebook until achieving a level of comfort in performing the task independently.
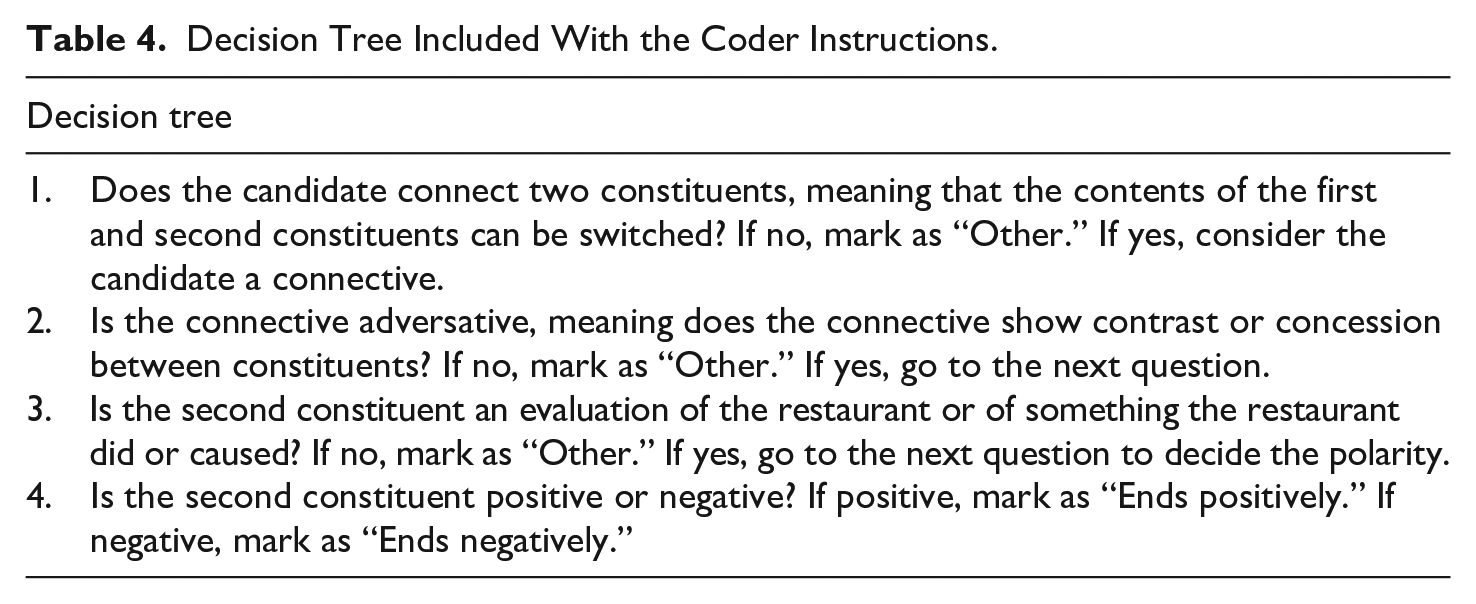
Independent coding agreement was measured using Cohen’s kappa, which Cohen (1960) has defined as “the proportion of joint judgments in which there is agreement, after chance agreement is excluded” (p. 46). Previous research has established generally accepted ranges for intercoder agreement strength: .0–.20 as “slight,” .21–.40 as “fair,” .41–.60 as “moderate,” .61–.80 as “substantial,” and .81–1.0 as “almost perfect” (Landis & Koch, 1977, p. 165). To ensure reliability of the codebook, this study aimed to achieve a Cohen’s kappa of .81 or higher. One coding round in the pilot assessment resulted in 89.6% agreement, which translated to a satisfactory Cohen’s kappa reliability statistic of .84. Following Neuendorf’s (2017) content analysis process, we then completed a secondary, final assessment using sample data from the final dataset. Five rounds of final coding, each conducted using a new 10% sample of the final dataset, were needed to achieve reliability. The agreement in the five rounds was 86.6, 89.7, 85.34, 87.60, and 88.51%, translating to respective Cohen’s kappa statistics of .79, .80, .75, .80, and .82. Given the complexity of the coding, we developed a decision tree prior to the final round of the coding that helped coders achieve the reliability level of .82. The decision tree accompanying the coder instructions can be found in Table 4.
Decision Tree Included With the Coder Instructions.
Analysis
For each review, the rate of occurrence of positive and negative second constituents in AC constructions per 1,000 words was calculated to account for reviews of varying length. These values were then modeled against star ratings of the reviews as a proxy of overall customer satisfaction (Engler et al., 2015) to determine the amount of variability in star ratings that AC constructions could account for. Star ratings were treated similarly to Likert-type data on an ordinal scale (Allen & Seaman, 2007; Göb et al., 2007).
All statistical tests were conducted in R version 4.0.2 (R Core Team, 2022). All variables of interest were visualized using the base R plot() function to visually diagnose whether the variables were appropriate for the statistical test in which they were used, and descriptive statistics were generated for all variables. A Brant test was also conducted to ensure the data met the assumption of proportional odds.
To answer RQ #1, a mixed-effects ordinal logistic regression was performed to explain the star rating of each review. A mixed model was used because observations were not independent with respect to several variables (e.g., restaurants with more than one review in the data set), so we needed to control for that variability with random effects. With star rating as an ordinal dependent variable in the model, the model treated restaurant, reviewer, price, and coder as random effects and the rate of occurrence of positive second constituents and negative second constituents as fixed effects.
In order to test the meaningfulness of the model, a null model was initially run and then compared against models of interest using a likelihood ratio test for cumulative links models. All ordinal regression models were run using the ordinal package (Christensen, 2019). If random effects were found to have a standardized estimate and variance of less than 0.0001, they were removed from the model with the assumption that they were contributing no meaningful variance and were only making the model unnecessarily complex. The assumption of multicollinearity was checked using Pearson correlations for continuous variables and Spearman correlations for ordinal variables with a threshold for multicollinearity of values beyond +/−0.9; multicollinearity was also checked by computing the variance inflation factor (VIF) with a threshold of values higher than 2.5 (Alison, 1999). Cohen’s (1988) heuristics for interpreting effect sizes in behavioral sciences research were used for interpreting the meaningfulness of results. The assumption of proportional odds was checked through a Brant-Wald test, using the MASS and brant packages in R (Ripley et al., 2022; Schlegel & Steenbergen, 2020). An alpha level of p < .001 was applied. The assumption of monotonic relationship between star rating and the independent variables was checked via scatterplot.
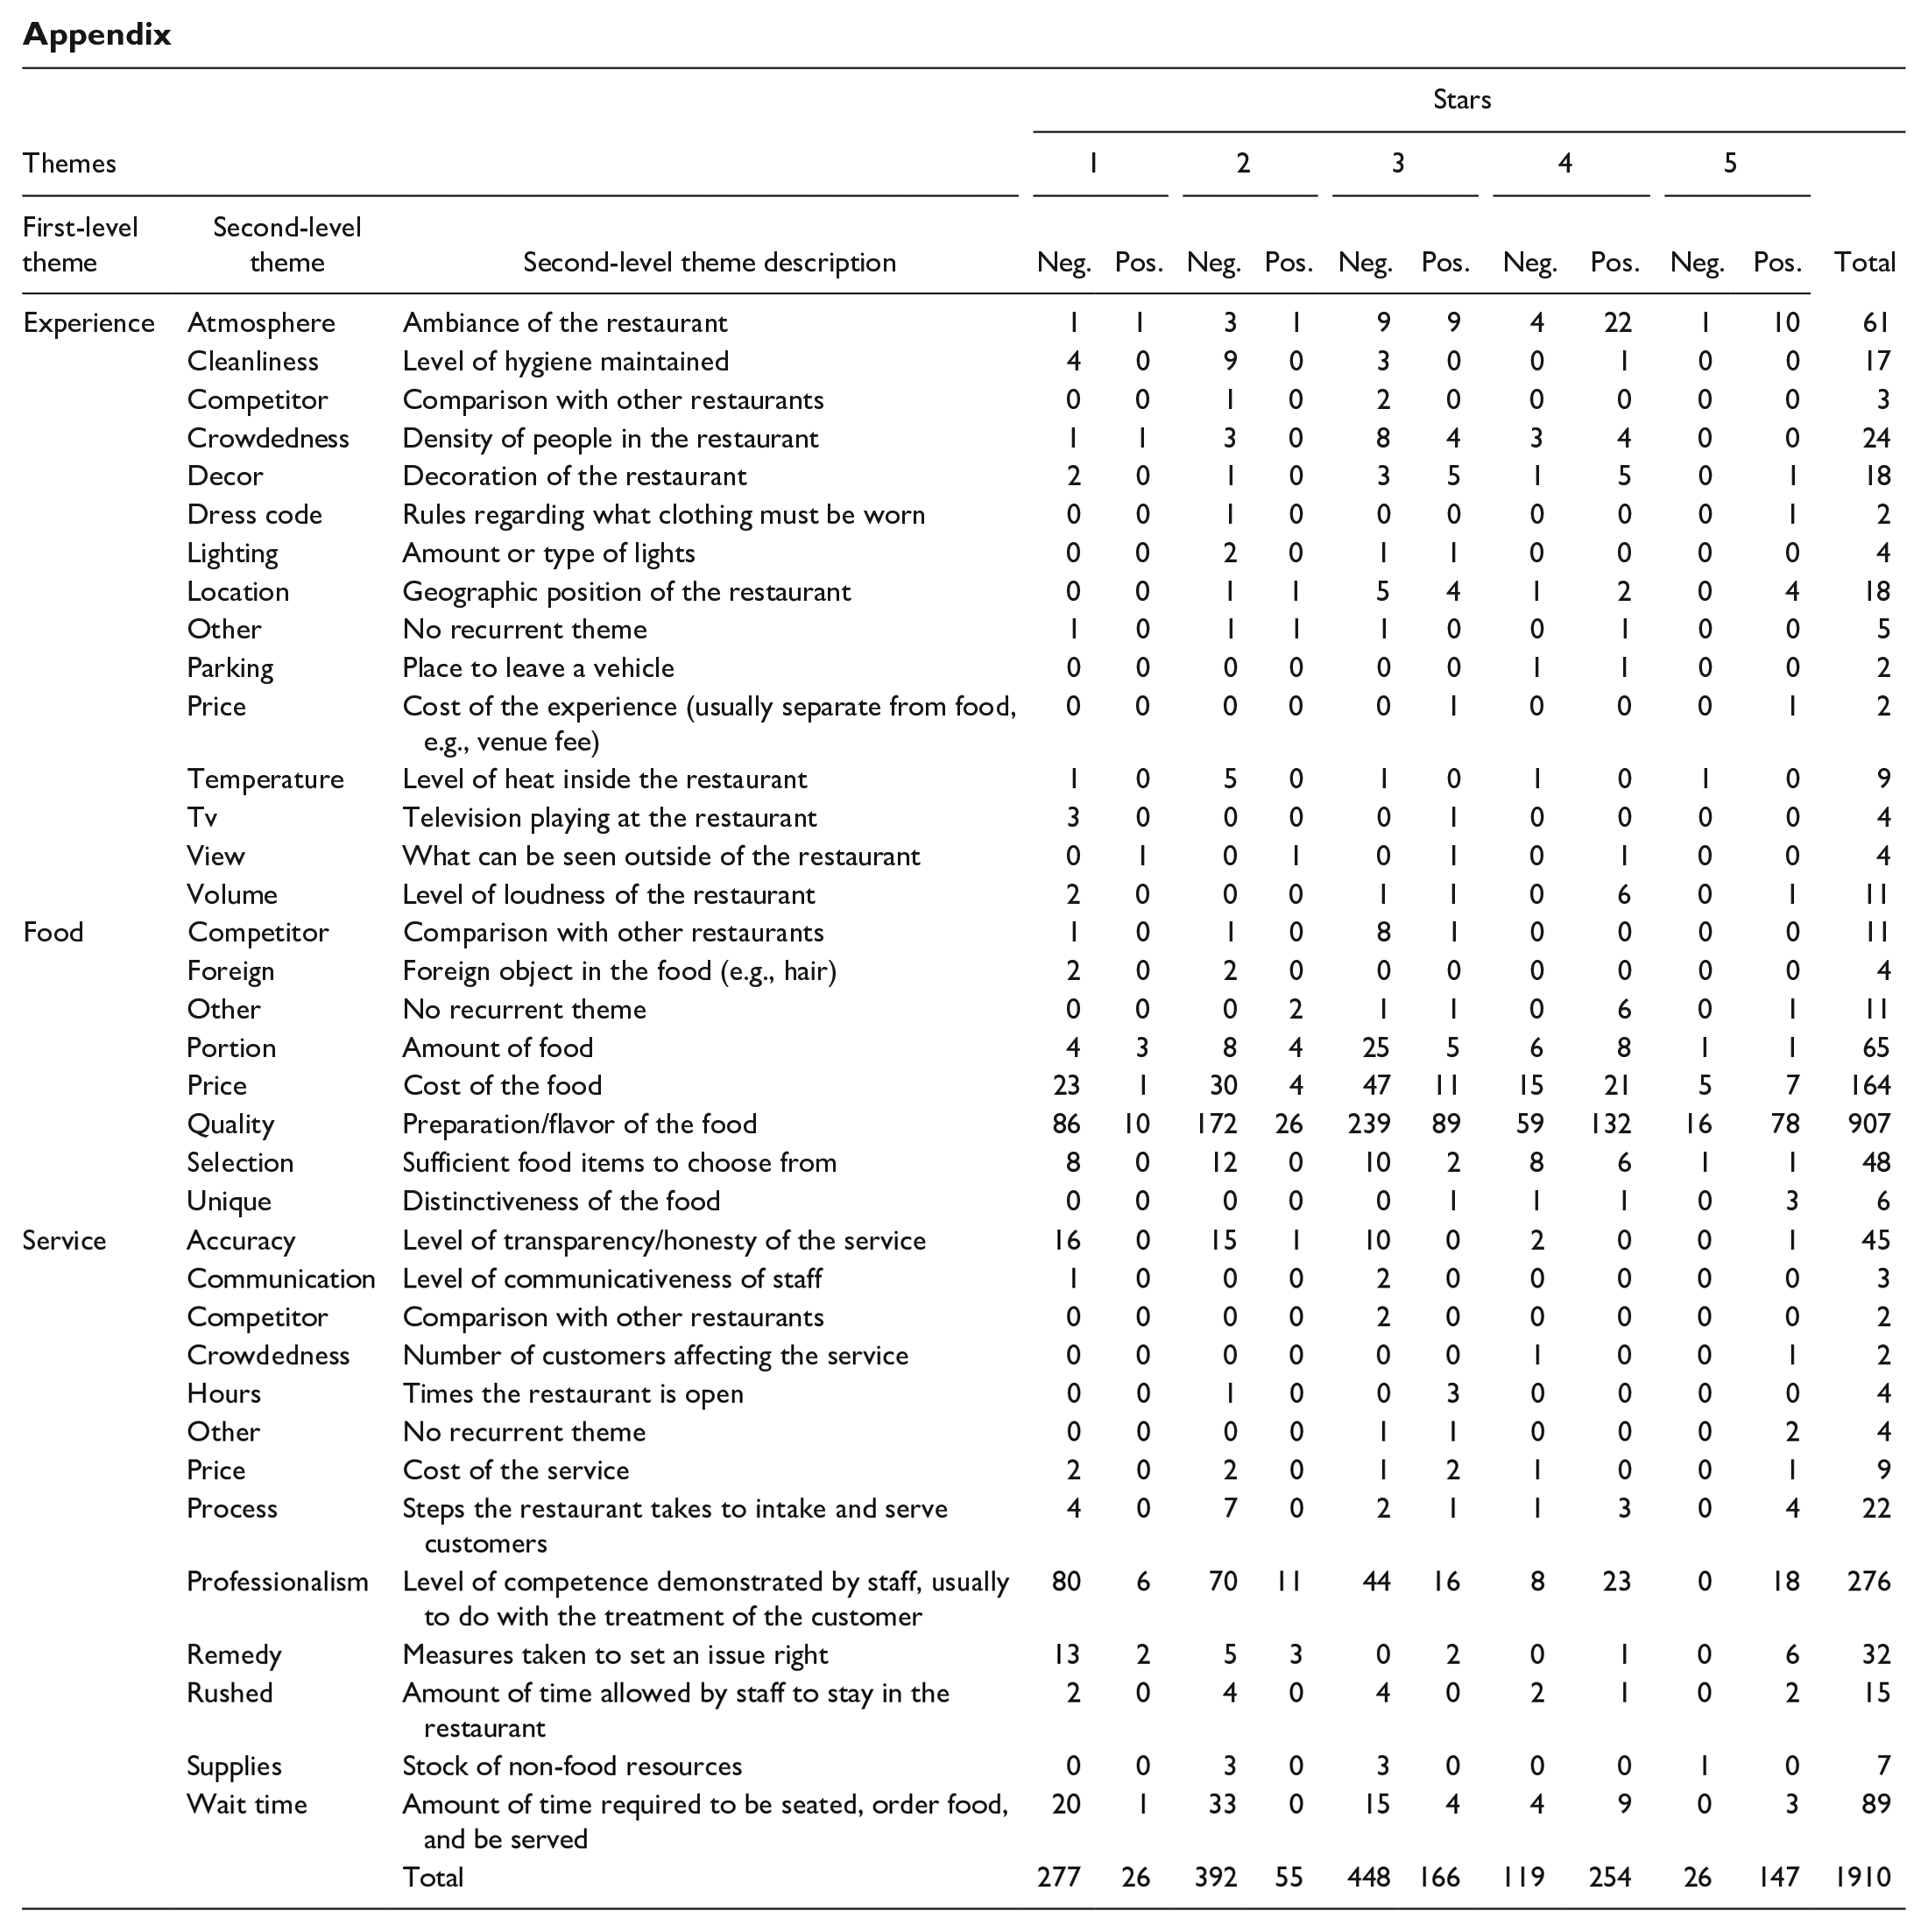
Following the statistical analysis, all concordance lines were further qualitatively examined in order to answer RQ #2. This was done to analyze the situational and linguistic patterns in second constituents in AC constructions. This analysis provided insights into the connections between the second constituents and the star ratings and enabled us to present the results in a more meaningful and orderly manner. Each of the 1,672 sampled concordances (i.e., those coded as “Ends positively” or “Ends negatively” in the codebook found in Table 2) was analyzed using thematic analysis (Braun & Clarke, 2006). In doing thematic analysis, each concordance was read by one of the principal investigators and coded at two levels. The first level was whether the second constituent was related to food, service, or experience (Keller & Kostromitina, 2020). The second level was coded according to the topic of the second constituent. These codes were iteratively combined to produce themes. (See the Appendix for a list of the first and second themes.) To assess reliability in coding, a 10% sample of the concordance lines was coded by both principal investigators, resulting in 83.5% percentage agreement, which translated to a .83 Cohen’s kappa. The first and second level codes were then counted, and descriptive statistics for these two code levels were produced to characterize the nature of the second constituents at each star-level rating. By summarizing the data like so, the various ways in which expectations were or were not met by the restaurant could be characterized.
Results
To present the results of these analyses, we first provide descriptive statistics of the rate of occurrence of positive and negative second constituents in the data set, followed by a brief discussion of the analytical assumptions. We then present the results of the regression analysis, which answered RQ #1, as well as the results of the thematic analysis, which answered RQ #2.
Descriptive Statistics
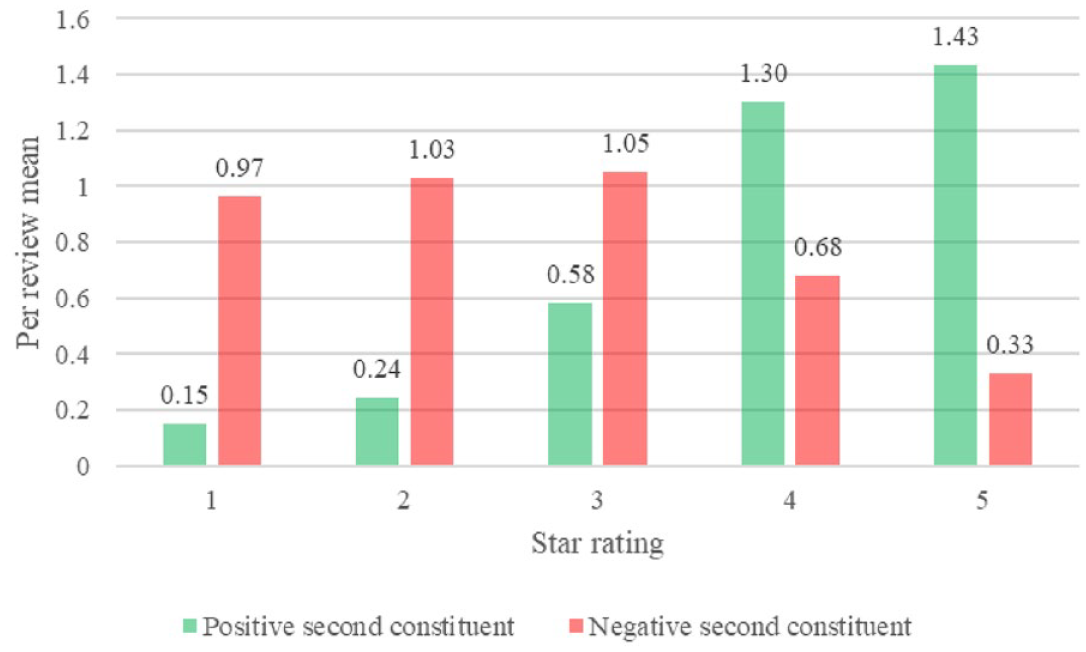
Figures 1 and 2 show relevant information about the relationship of positive and negative second constituents and star rating. Figure 1 shows the rate of occurrence of positive and negative second constituents at each level of star rating per thousand words. Figure 2 shows the proportions of positive and negative second constituents at each star level. Above the columns, it shows the total raw number of positive and negative second constituents at each star level. Within the colored portion of each column, it shows the raw number of each type of constituent at each star level. At a review level (see Figure 3), positive second constituents occur at an average rate of 0.66 times per review (SD = 0.98), and negative second constituents occur at an average rate of 0.89 times per review (SD = 0.72). These occurrences equate to an average of 1.54 (rounded) constituents total per review.
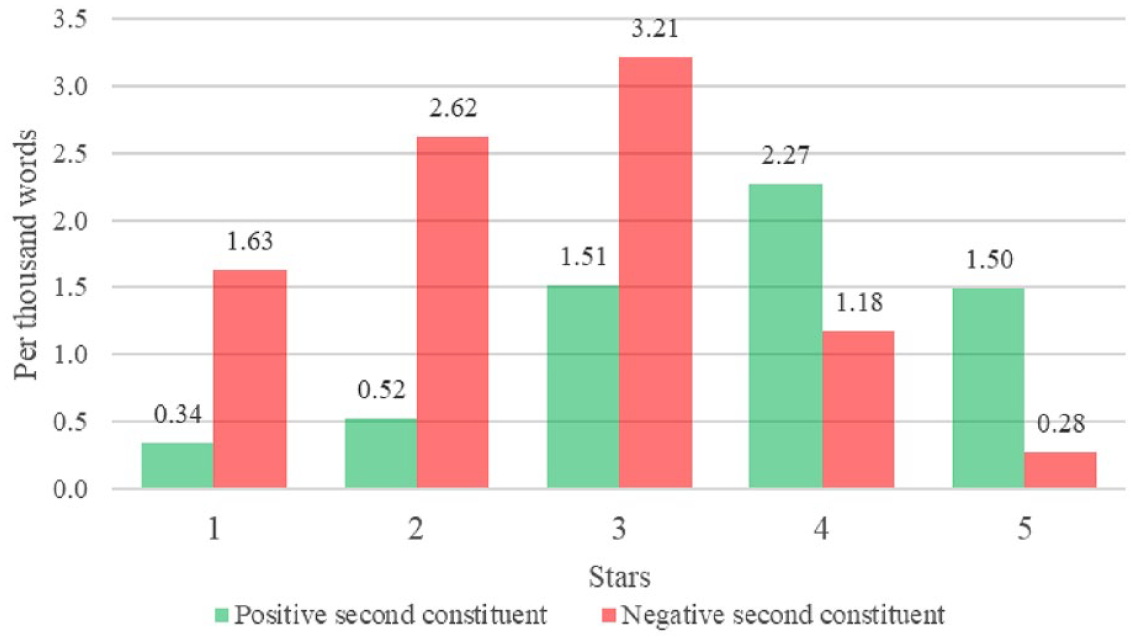
Rate of occurrence of positive and negative second constituents per thousand words at different star rating levels.
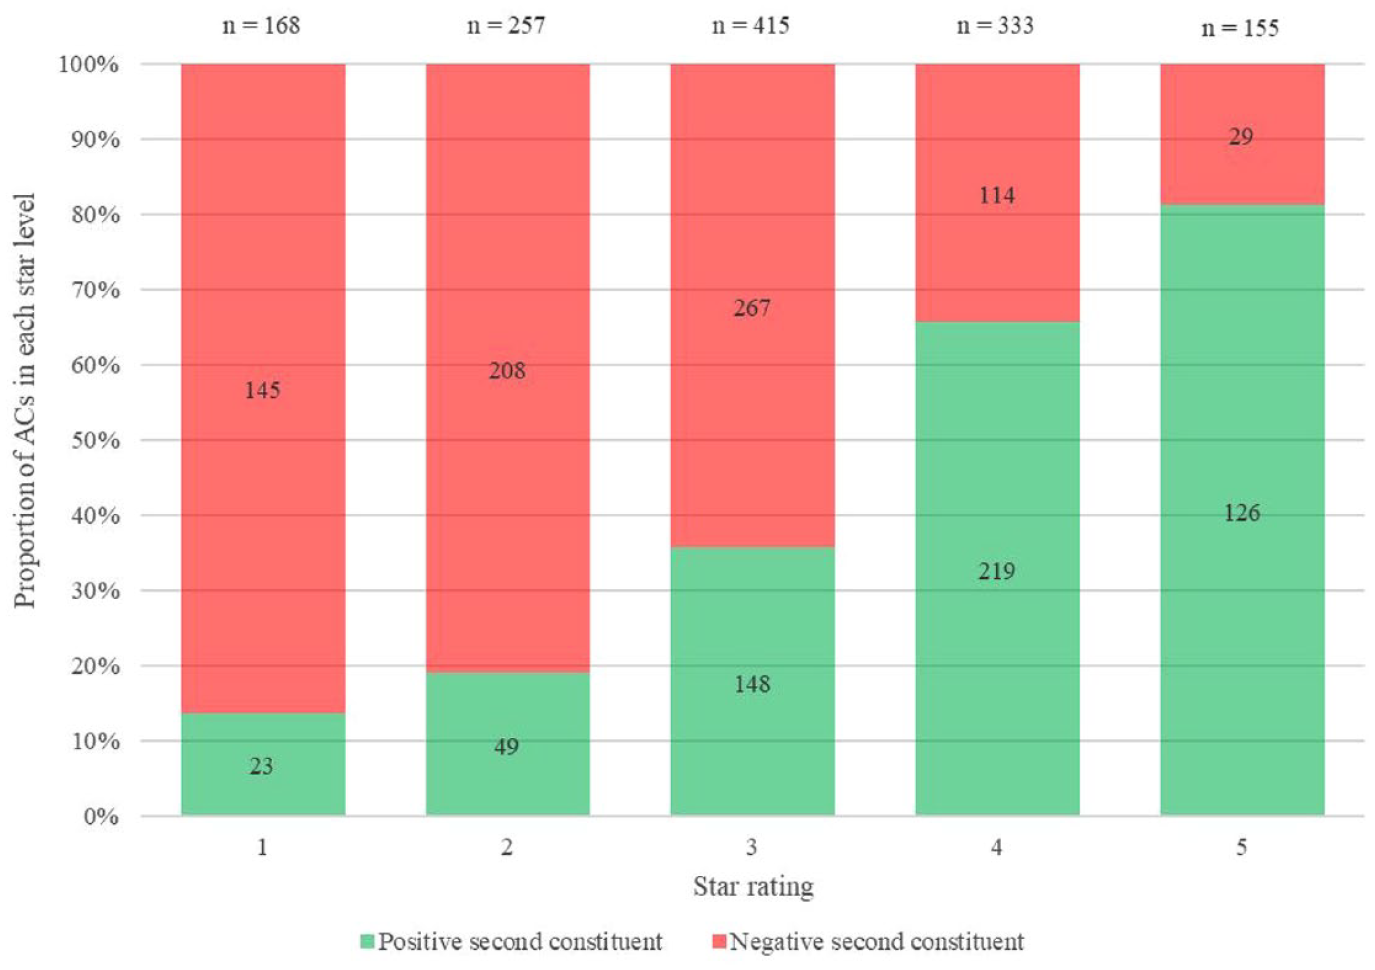
Proportion and total numbers of positive and negative second constituents at different star rating levels.
Mean number of positive and negative second constituents per review across star level ratings.
Assumptions
Relationships between all variables of interest were found to be monotonic. No issues with multicollinearity were detected through either correlations or VIF. The assumption of proportional odds held according to the results of the Brant test.
According to the Spearman method, star rating correlated with normed negative second constituents at rho(860) = −0.31, p < .001, indicating a significant relationship with a medium effect. Star rating correlated with normed positive second constituents at rho(860) = 0.56, p < .001, indicating a significant relationship with a large effect. According to the Pearson method, positive second constituents correlated with negative second constituents at r(860) = −0.29, p < .001, indicating a significant relationship with a medium effect. The results of the assumption checks revealed no issues. No variables were found to have problematic correlations or multicollinearity through either correlation or VIF tests. The Brant test indicated that the parallel regression assumption held. This indicates that even though the regression is ordinal, the estimates can be interpreted directly across all levels of the star-rating variable. Additionally, because these assumptions held, the results of the statistical tests were directly interpreted.
Regression Results (RQ #1)
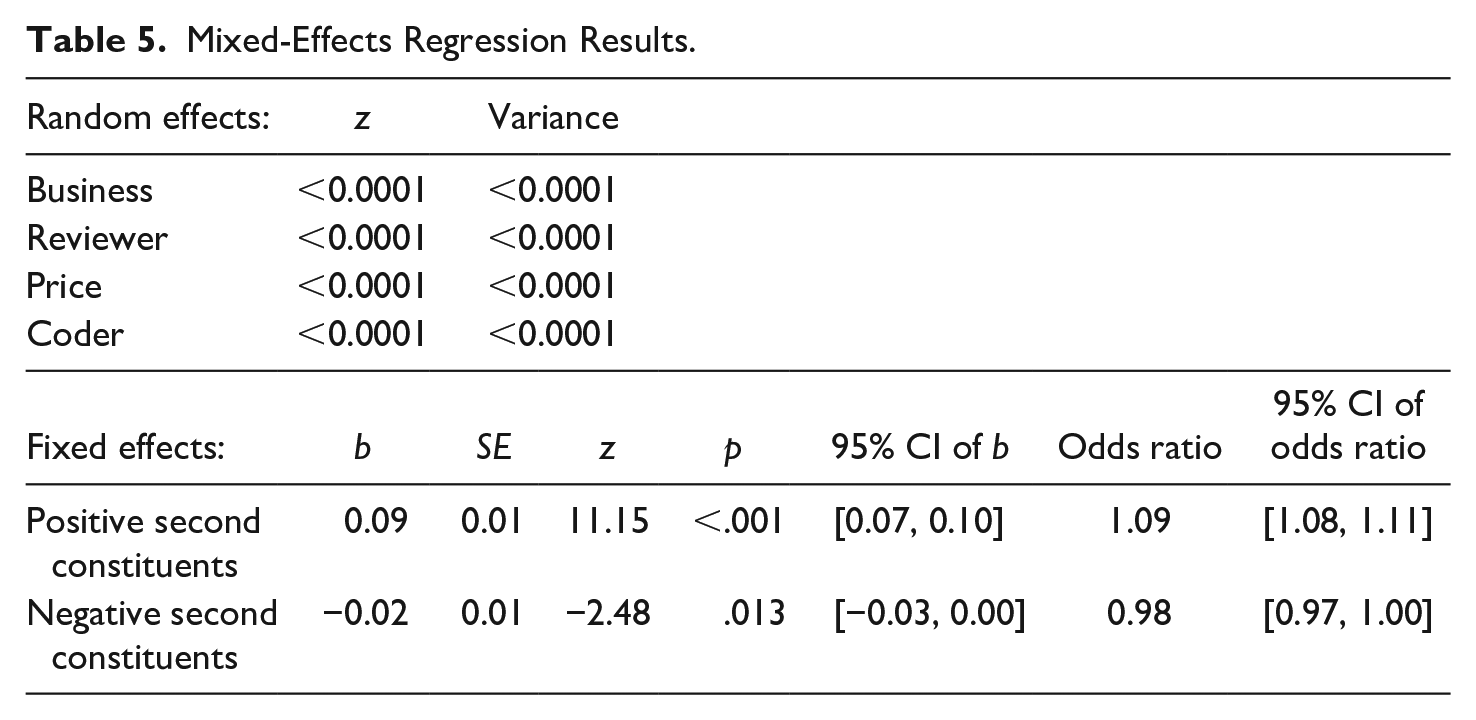
The mixed-effects regression results showed that none of the random effects were meaningful to the overall model as the random effects’ estimates and variance were less than .0001 (see Table 5). Also, when comparing the mixed-effects model and the fixed-effects, there were no differences with respect to values for the positive and negative second constituents, again indicating no meaningfulness of the random effects (see Tables 5 and 6). Therefore, in the interest of parsimony, interpretations were taken from the fixed-effects model.
Mixed-Effects Regression Results.
Fixed-Effects Regression Results.
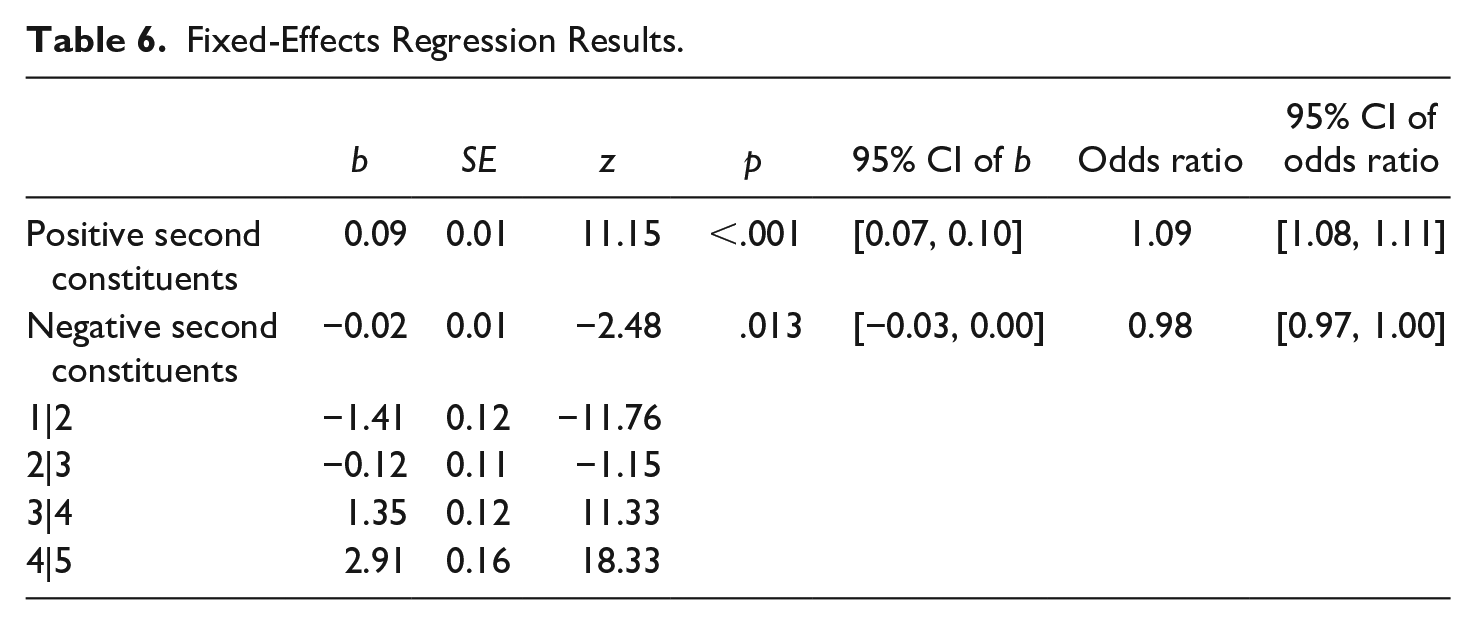
As shown in Table 6, the fixed effects model reveals a significant positive association between second constituents and star rating with an estimate of 0.09. This indicates that for every unit change in positive second constituents per thousand, the odds of an increase of star rating increases by 9% (i.e., e0.09). The model also reveals a non-significant negative association between negative second constituents and star rating, with an estimate of −0.02. This indicates that for every unit change in negative second constituents per thousand, the odds of a star rating change in the negative direction increases 2% (i.e., e–0.02).
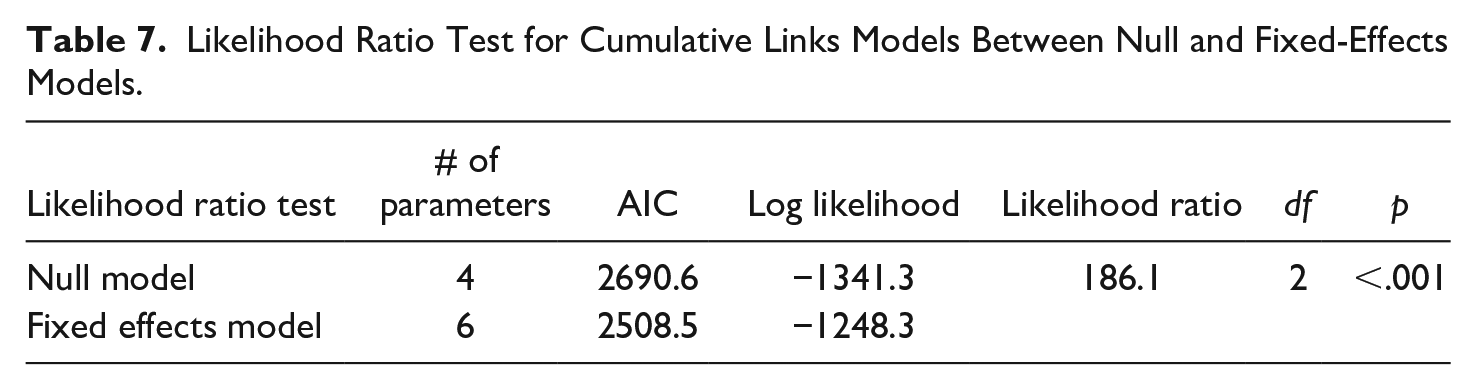
The meaningfulness of ACs was again confirmed as the likelihood ratio test showed that the fixed effects model was supported 186.1 times more strongly than the null model—a highly improbable result (see Table 7), which provides a great deal of evidence to reject the null hypothesis, meaning that the model containing AC constructions provides significantly and meaningfully accounts for predicting star rating.
Likelihood Ratio Test for Cumulative Links Models Between Null and Fixed-Effects Models.
Thematic Analysis Results (RQ #2)
Thematic analysis provided a better understanding of what specific aspects of the dining experience affected the association between the sentiment of second constituents and the star ratings. Figure 4 describes the percentage of negative and positive second constituents, broken out by star rating and by first-level thematic codes: food, service, and experience. Overall trends include similar distributions at lower-star ratings (1 and 2) and at higher-star ratings (3, 4, and 5). At the lower ratings, second constituents focus proportionally more on service, especially on negative service experiences. At higher ratings, second constituents focus proportionally more on food. In addition, in the 4- and 5-star reviews, proportionally more second constituents describe positive service and experience. In all three first-level thematic categories, second constituents shift to be proportionally positive between the 3- and 4-star reviews.
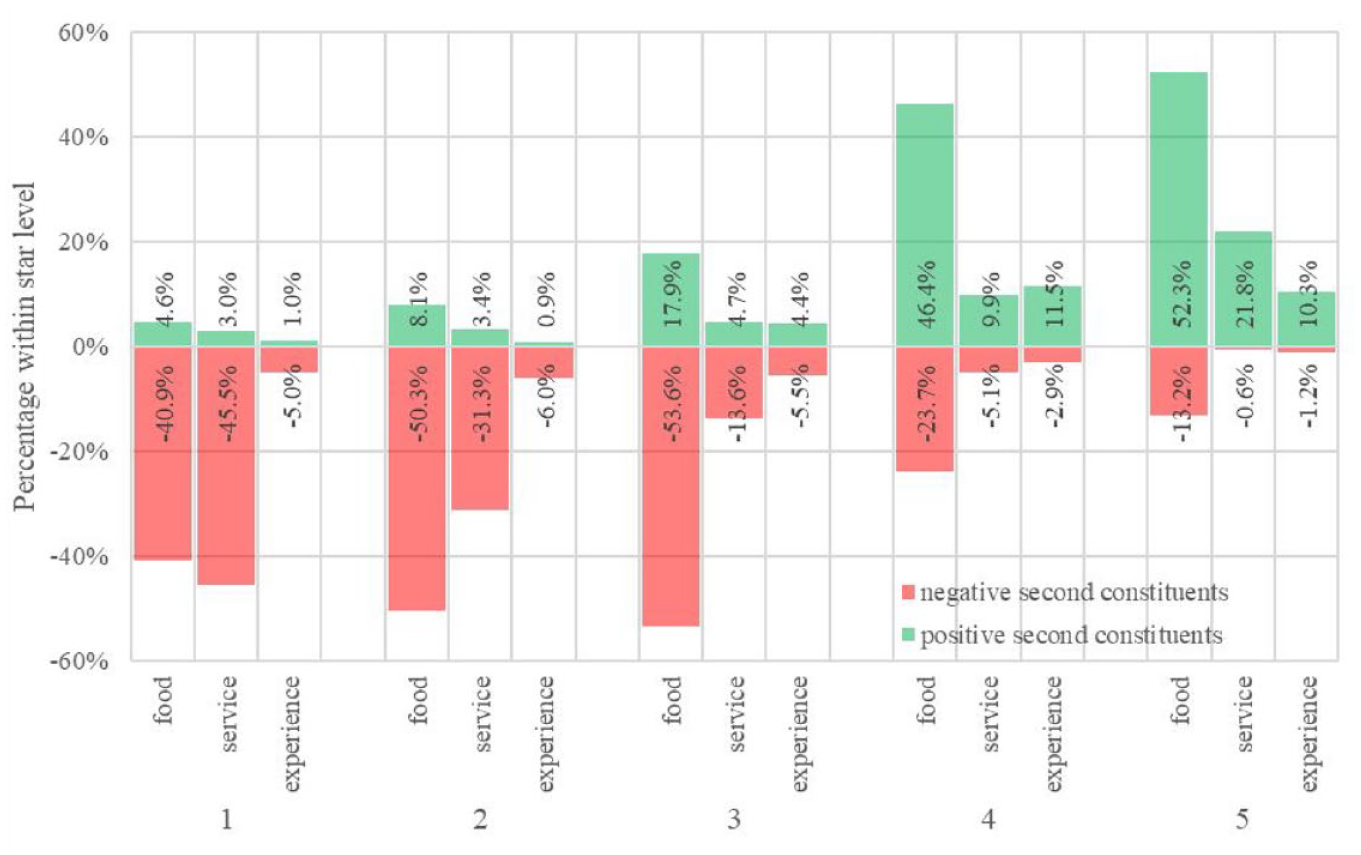
Proportion of second constituents related to food, service, and experience.
Second-level codes provided more specific insight into the food, service, and experience expectations of the customers in the data set. Figures 5 to 7 show the percentage of positive and negative constituents related to food, service, and experience respectively, broken out by star rating and by second-level thematic codes. The Appendix provides results for all second-level codes, but only the most frequently occurring codes are discussed here. It is worth noting that even though a wide variety of themes were accounted for and observed in the data, only a few themes arose with a meaningful degree of frequency.
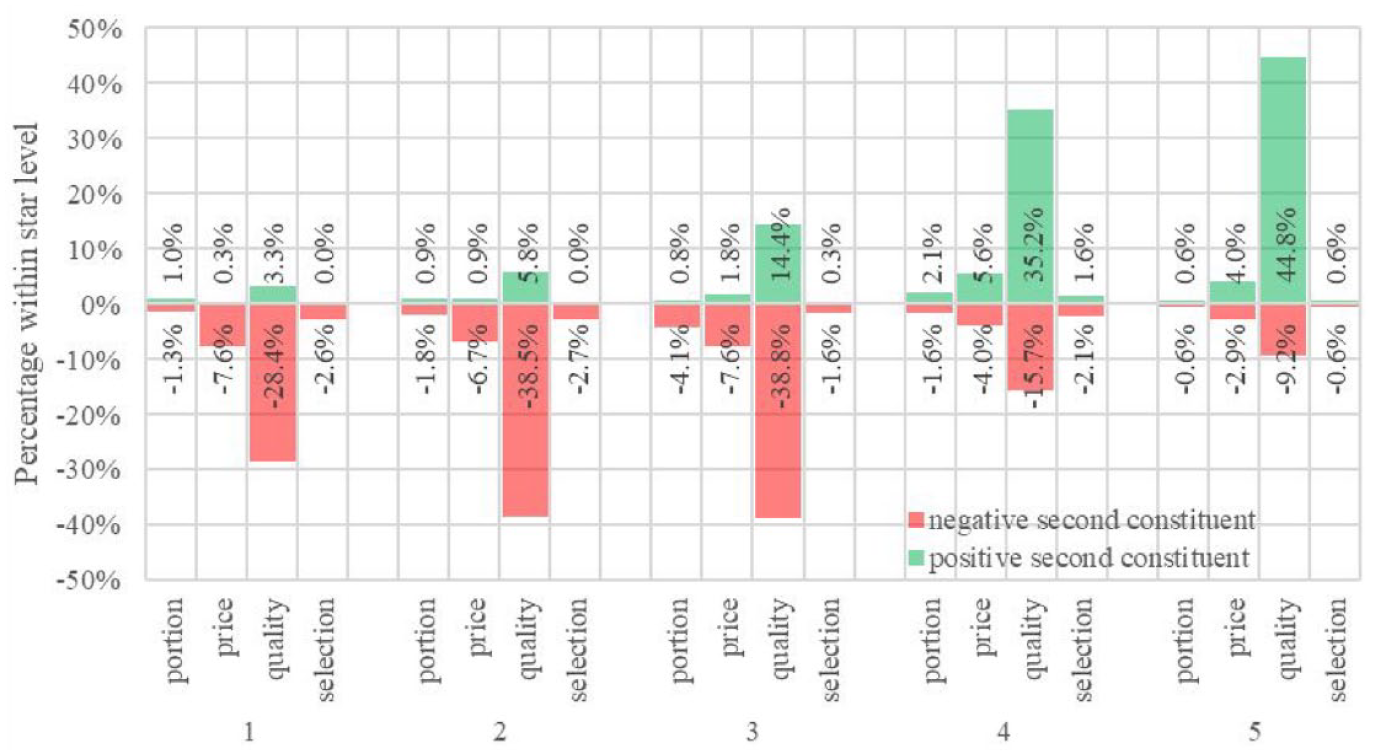
Proportion of second constituents related to food.
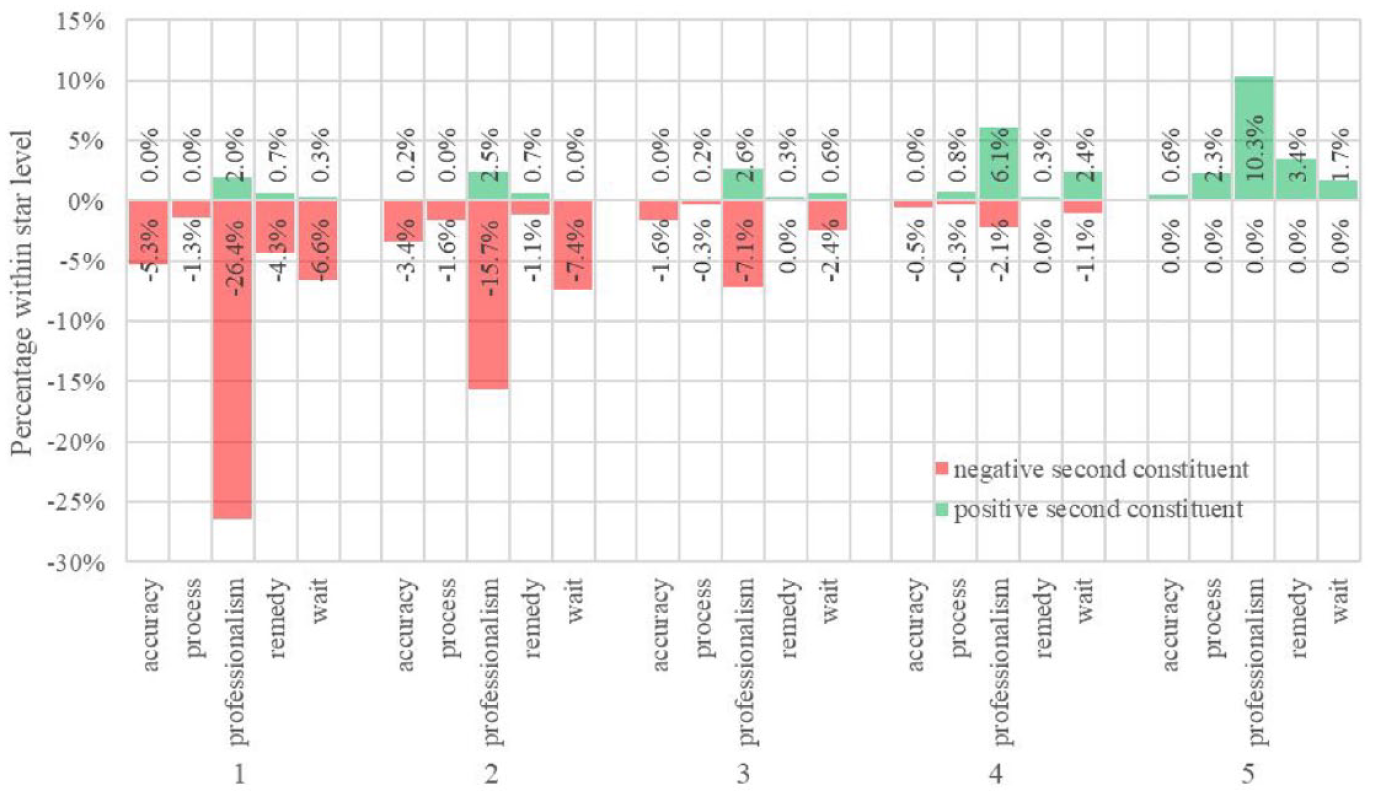
Proportion of second constituents related to service.
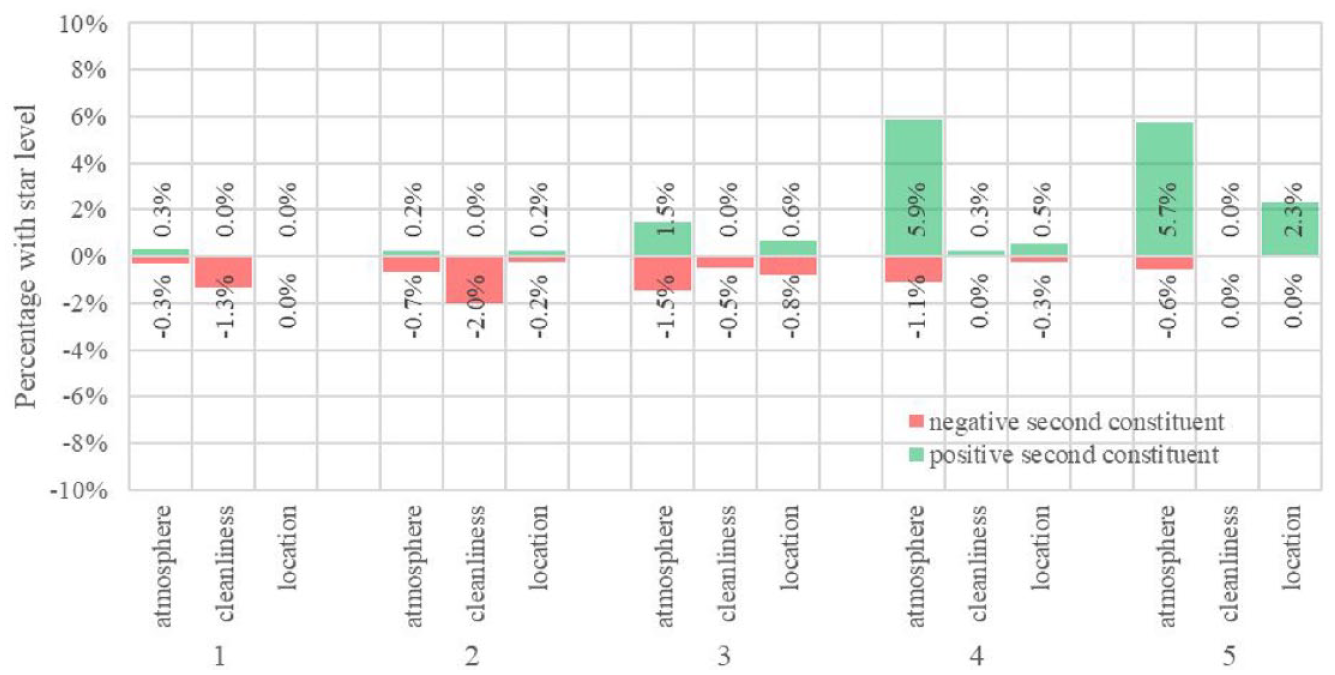
Proportion of second constituents related to experience.
For themes related to food, the most frequent by far at every star-rating level was food quality. As Figure 5 indicates, 1-, 2-, and 3-star food quality and food price constituents were predominantly negative, but 4- and 5-star constituents were far more positive. (A complete list of theme descriptions and counts from which the proportions were derived is included in the Appendix). It is worth noting that food quality included such topics as the taste, temperature, manner of preparation, level of cooking, and authenticity of the food.
For themes related to service, professionalism was by far the most frequent at every star-rating level. As Figure 6 shows, professionalism constituents were overwhelmingly negative from 1 to 3 stars but were overwhelming positive at 4 and 5 stars. Like food quality, professionalism also has many subcomponents, especially attentiveness and politeness. Based on these results, it seems that meeting (or not meeting) customers’ expectations for professionalism is the most important indicator of whether service is successful or not in a restaurant setting. Another notable theme resulting in low-star ratings appears to be wait times that were longer than expected for seating and food, as indicated by the wait theme being proportionally high at the low-star rating levels. Expectations also appear to be unmet when customers feel that they have been misled by advertisements or when they do not get what they asked for—indicated by a high proportion of the accuracy theme at the low-star rating levels. In order for restaurants to get five-star ratings, many service expectations regarding professionalism, remedy, process, wait time, and accuracy need to be met or exceeded.
Finally, for themes related to customer experience, restaurant atmosphere was by far the most frequently occurring (see Figure 7). Atmosphere was mentioned more frequently at higher-star ratings, where it predominantly met or exceeded the reviewers’ expectations. Atmosphere was not mentioned much at all at lower-star ratings. This observation is also true of the location theme. In contrast, cleanliness is mentioned in lower-star ratings. This indicates that customers expect a certain standard of cleanliness, and a customer’s experience can be ruined when a restaurant is not clean.
Discussion
RQ #1: What is the relationship between polarity of sentiment of second constituents in AC constructions and star ratings in restaurant reviews?
The results indicate that ACs are relatively frequently occurring linguistic features in reviews. In our stratified sample of 54,000 reviews, ACs appeared in 65% of reviews and occurred over one and a half times in each of those reviews, on average. If it can be assumed that use of AC constructions (and more specifically, their second constituents) can be an overt expression of ways in which customer expectations were or were not met (Beaver & Clark, 2008; Halliday & Matthiessen, 2004; Lakoff, 1971), then ACs become highly useful for interpreting specific ways in which the customers were or were not satisfied (Churchill & Surprenant, 1982; Oliver, 1980; Szymanski & Henard, 2001). Further, the presence of 1.54 ACs per review in almost two-thirds of the reviews in our stratified sample indicates that a majority of reviewers are communicating their (dis)satisfaction with the restaurants they visit.
ACs with both positive and negative second constituents appear to be more frequent overall in middle-star rating levels, which indicates that reviewers at these levels are noting both good and bad aspects of the restaurants. This may indicate that these reviewers are trying to be fair by communicating both positive and negative aspects of the restaurants, a finding that would corroborate Vásquez’s (2011) observation that reviewers use ACs to establish objectivity in reviews. In contrast, when it comes to low-star and high-star reviews, positive second constituents are used 4 times as much at the 5-star level, and negative second constituents are used 6 times as much at the 1-star level. This may indicate that these reviewers are not trying to be fair in their reviews, or it may simply indicate levels of inferior or superior dining experiences.
Overall, the descriptive statistics of the use of positive and negative second constituents indicate an association with star rating, which is confirmed by the correlational results. With a large effect for positive ACs and a medium effect for negative ACs, the correlational results indicate that meeting or exceeding expectations pays more dividends than not meeting them in terms of star ratings, but even more importantly, the correlational results indicate that meeting or not meeting expectations is highly indicative of customer satisfaction overall (Engler et al., 2015).
These results are strengthened by the ordinal regression which shows a statistically significant association between star rating and positive second constituents and a non-significant association between star rating and negative second constituents. The regression can estimate a specific value for the number of positive second constituents that result in the odds of a full star rating increase. Specifically, the results indicate that if a restaurant wants to increase its star rating by one, it must more than double the number of positive second constituent ACs in the review. 2 In other words, if we assume that star ratings are a measure of customer satisfaction and if restaurant owners want to improve a customer’s satisfaction by a whole star rating on their reviews, they must more than double the instances of meeting or exceeding a customer’s expectations.
The regression can also estimate a specific value for the number of negative second constituents that result in the odds of a full star rating decrease. Specifically, the results indicate that a restaurant may see a decrease in its star rating by one, if the number of negative second constituent ACs in a review increase by 7.51 per review. This means that to lose a star rating, negative second constituents need to increase by more than 8 times. 3 Thus, a restaurant must consistently disconfirm a customer’s expectations in order to decrease in star rating. Together these findings indicate that, on average, restaurant owners can achieve higher star ratings by consistently meeting or exceeding customers’ expectations.
For restaurant owners, these results further indicate that star ratings and meeting customer expectations are linked, which is evidenced by customers communicating their expectations through the use of ACs. This finding holds practical implications for restaurants with many reviews—perhaps more reviews than owners realistically can read. Rather than reading every word of every review—a time-consuming endeavor—restaurant owners could more efficiently focus on only the sentences with ACs in them. For example, looking over the number of Yelp reviews from the restaurants in this data set, TWIISTED Burgers & Sushi in Medina, Ohio, USA, has 343 reviews, Fleming’s Steakhouse in Peoria, Arizona, USA, has 520 reviews, and Carmine’s Italian Restaurant in Las Vegas, Nevada, USA, has 1,644 reviews on Yelp. However, owners of these restaurants can download their data using the website or mobile app interface and quickly search the reviews for ACs to examine the expectations communicated in the ACs’ second constituents. Even more specifically, because 1,595 of the 2,457 (65%) instances of ACs that were observed in this data set were all but, restaurant owners could reduce their search to only but to identify customer expectations as well as areas where expectations are not being met. Restaurant owners could also be assured that reviews with ACs are more likely to be objective (Vásquez, 2011) and, therefore, potentially more useful than reviewing all reviews that may communicate a more biased view. Finally, many consumers post comments on sites that do not have star ratings associated with them (e.g., Facebook comments), and restaurant owners viewing these comments may experience difficulty in interpreting the reviews. For instance, TWIISTED Burgers & Sushi has 504 reviews, Flemings Steakhouse in Peoria has 743 reviews, Carmine’s Italian Restaurant in Las Vegas has 5,569 reviews on Facebook—all more than on Yelp, which has a built-in star rating system. In cases like this, searching for ACs could assist restaurant owners in interpreting customer satisfaction.
Importantly, none of the random effects made any significant difference in our models. Specifically, the price of the food, the restaurant, and the reviewer made no difference, indicating some robustness in the results. Thus, the results of this study appear to hold regardless of those factors.
RQ #2: What specific aspects of the dining experience affected the association between the sentiment of second constituents and the star ratings?
The thematic concordance analysis helped to determine what specific aspects of the dining experience affected the association between the polarity of sentiment of second constituents and the star ratings. In their keyword analysis of this same data set, Keller and Kostromitina (2020) found that low-star reviews tended to focus on service; middle-star reviews tended to focus on the food; and high-star ratings tended to focus on service, food, and experience. In the present study, we extended those findings by focusing only on content in second constituents and by coding for the positive/negative sentiment of those constituents. This study’s theoretical frame further extended those findings by considering the content communicated in the second constituent as a report of whether the customer’s expectations were met or not met. Given this theoretical framing, the findings in the present study indicate that on average, customers providing 1-star ratings communicated that their expectations were not met for food, service, or experience, with emphasis placed on subpar service. Customers providing 2-star ratings similarly communicated that their expectations were not met across all three areas, but proportional improvement is seen in both food and service, with customers communicating their expectations more frequently about food as compared to customers providing 1-star ratings. A similar pattern and shift in proportions is seen in 3-star ratings as compared to 2-star ratings. Customers providing 4-star ratings communicated that more often than not, their expectations were met or exceeded in food, service, and experience, with experience being commented on proportionally more than at any other rating level. Finally, customers providing 5-star ratings communicated that their expectations were met across all three areas, with emphasis placed on exceptional service. Therefore, service and food are important at all rating levels, but as service becomes more satisfactory, customers pay more attention to the quality of the food. At the highest ratings, customers’ expectations are generally met or exceeded, especially in the areas of service and experience.
Specific examples
4
reveal additional insight into how reviewers communicate that their expectations were met or not met. As just noted, the findings indicate that food is the predominant theme in middle-star and higher-star reviews. Middle-star reviews focused on food illustrate how customers use ACs in their reviews to contrast and concede information and to communicate their expectations, as in the following 3-star review: Example 4 I would happily eat the Burgers, Hot Dogs, and Hamburger Steak
The reviewer describes satisfying food options, contrasting the satisfying options with the failed expectation that cheese be present in a grilled cheese sandwich. Another 3-star review similarly mentions the positive aspects of the restaurant while also communicating a desire for improvement: Example 5 This place is pretty solid all in all.
A 4-star reviewer concedes the potentially negative aspects of the price prior to emphasizing that the food quality meets the expectations for the price: Example 6
These food-related concordance lines reveal how customers use ACs to contrast or concede positive points prior to emphasizing their failed expectations or to contrast or concede negative points prior to emphasizing their met expectations.
As previously noted, the content of the low-star ratings indicated that service was the most frequent topic in second constituents and that customers’ expectations were largely not met in the service area. In contrast, expectations for service (and food and experience) were consistently met or exceeded in 5-star reviews. Reviews from low and high service ratings further illustrate how reviewers use ACs to reveal their expectations, as in the 1-star review in Example 7.
Example 7 It seems like there are waiters standing around everywhere and
The reviewer sets up the expectation that if waiters are available, they should be attending to patrons; however, the connective yet contrasts that expectation with what actually happened: despite waiters’ seeming availability, the service was inattentive. Another 1-star reviewer noted after a long wait for food, it was ultimately discovered that the bartender forgot to place the food order: Example 8 He made sure to charge us for our drinks,
The reviewing customer implies the expectation that if the bartender had been forgetful of their order, the bartender should at least also be forgetful of the drink charge to compensate for the mistake. However, the connective but indicates that what happened differed from the customer’s expectation: the bartender remembered to charge for the drinks and offered no remedy for the lack of professional service. Similarly, findings indicated that service expectations were consistently not met in 5-star reviews, but instead of it being a negative experience of the restaurant failing to meet expectations and thereby producing customer dissatisfaction, on average expectations were consistently met or exceeded and thereby produced customer satisfaction as in the 5-star review from Example 9.
Example 9 Our reservation was at 7:30 and we showed up early at 7:00 intending to wait in the bar,
In this case, the early customers expected to wait but were seated immediately without the wait. Such service-related examples showcase how reviewing customers use ACs to convey their expectations based on situational context.
On average, only at the highest ratings were experience (and food and service) expectations met or exceeded, and only at the lowest ratings were experience (and food and service) expectations not met. One 5-star reviewer conceded positive satisfaction before emphasizing even greater satisfaction as follows: Example 10 not only serves great food, with great service, in a great atmosphere,
In this experience-related example, the reviewer communicated an experience that went from good to better, indicating that expectations were met and even exceeded. Example 11, a 1-star review, provides a contrasting review in which the reviewer indicates how some bad things can be made even worse.
Example 11 The bathrooms were not clean
The cleanliness of the bathroom was not desirable, but the AC emphasized that the undesirability was made worse by charging a tip to use it. These experience-related concordance lines indicate that customers also use ACs to communicate their expectations as they contrast or concede points that move from good to better or from bad to worse. In such cases, the end weight emphasizes the second constituent, revealing how expectations were met or exceeded in good and bad ways.
Second-level coding provided an additional level of detail into the food, service, and experience expectations of the reviewing customers. These intricate themes indicated that customers frequently have and express expectations regarding many aspects of food, especially food quality. Other important themes were price, portion sizes, and selection. Concordance-line examples provide additional detail. A line from a 1-star review with a theme of food quality concedes correct noodle texture but communicates how the noodle’s taste did not meet food quality expectations: Example 12 The noodles felt right
Food quality (in terms of taste, temperature, manner of preparation, etc.) meeting or not meeting expectations was by far the most frequently occurring theme in our data. This indicates that food quality expectations being or not being met is the most important factor in predicting whether a customer will be satisfied. Thus, restaurants should focus first on food quality if they wish to improve their star ratings.
Sometimes expectations regarding price justified the food quality in customers’ minds, as this 2-star review of a restaurant’s shawarma, a popular Middle Eastern dish, offerings suggests: Example 13 My beef one was a tad dry and my husband’s chicken had barely any filling.
Assuming the food quality was adequate, the reviews indicate that most customers were most frequently hoping for larger portion sizes, which similarly overcame concerns with quality in some reviews: Example 14 The pork was a little too lean
In that review of a savory crepe, the reviewer expected different fat content in the meat, but the large amount of meat provided seems to have moderated the failed expectation.
These second-level codes also indicated that customers frequently have and express expectations regarding service, especially professionalism. Most instances of this theme revolved around customers feeling that employees were rude or inattentive, as in the following example: Example 15 The scallops and dirty pasta were incredible . . .
Because professionalism was by far the most frequently occurring theme related to service, it would be a good investment of time for restaurant owners to train staff on how to be polite and on how frequently customers expect service staff to check in with them. Other important service-related themes focused on wait times (especially waiting to be seated and waiting for food/drinks), accuracy (especially getting the order wrong), and servers’ ability to remedy mistakes. Because of the variety of ways in which remedies were made, it was difficult to note patterns in specific ways in which mistakes were successfully resolved. However, one idea that did recur was that the speed of the remedy mattered. Consider Example 16: Example 16 In the end, they comp ‘d one of the meals,
Note how in Example 16, the restaurant took measures to rectify an issue and did so by compensating the customer for an entire meal. However, because the remedy was not communicated to the customer until the end of the meal, the customer viewed it as “too late.”
Finally, the more detailed second-level codes indicated that customers frequently have and express expectations regarding their physical experience coming to the restaurant, including the restaurant’s atmosphere, location, and cleanliness. Of these, atmosphere was mentioned the most frequently. It is difficult to say how a business can best create a good atmosphere based on the concordance lines. It seems that atmosphere is the combination of many factors, including the decor, layout, and ambiance. However, cleanliness is an obviously actionable item that can ruin a customer experience, as described in Example 17: I thought that the burgers and fries were pretty good.
If standards of cleanliness are not met, it seems that other aspects of the restaurant, even quality of the food, can become irrelevant to customers.
Importantly, not all reviews ended negatively, even at the lowest ratings. As illustrated in many of the previous examples, customers often conceded or contrasted negative experiences with positive ones, which suggests that customers juggle multiple expectations and that some expectations which restaurants meet or exceed can compensate for or remedy other expectations that restaurants do not meet. Such patterns can offer hope to restaurant owners, who will undoubtedly experience food, service, or experience disruptions that fall short of their customers’ expectations. Ultimately, restaurant owners can learn ways to improve from and remedy customers’ negative experiences (Beuscart et al., 2016), recognizing that what the customers choose to emphasize secondarily in AC constructions in their reviews seems to be what matters (Horn, 2022; Kripke, 2017).
Conclusion
This research investigated the relationship between the polarity of sentiment of second constituents in AC constructions and star ratings in restaurant reviews. In addition, it investigated the specific aspects of the dining experience that affected the association between the sentiment of second constituents and the star ratings. The results from this study should have meaningful implications for restaurant owners, whose success might be enhanced by improving how they interpret the content of reviews surrounding ACs. The results can help owners focus on the weightiest information in customer reviews (i.e., the information that drives customer satisfaction), which can be challenging to determine when sifting through many reviews or through long reviews. Given that the polarity of the second constituent in AC constructions is highly indicative of a review’s star rating, examining the second constituents could be especially helpful when interpreting reviews with no formal rating. Customers’ use of ACs in such situations may help restaurant owners interpret the level of customer satisfaction even though no summative satisfaction rating was provided.
This study’s results also have implications for business communication research in general and for customer satisfaction and customer review research more specifically. This study revealed many insights in interpreting data from customer reviews with the help of linguistic methods, specifically corpus linguistic methods of frequency and concordance analysis (Baker, 2006), and with the help of linguistic theory, specifically ACs (Halliday & Matthiessen, 2004) and end weight (Behaghel, 1909). Because business communication requires a systematic understanding of language use, linguistics should play a greater role in the analysis and interpretation of business communication data, just as this study shows. The results from this study also extend customer satisfaction research. No previous studies that we are aware of have conceptualized ACs as an indicator of customer expectations and customer satisfaction. Further, whereas previous research on online reviews has established that the order of the polarity of the sentiment of review parts influences customers’ perceptions of the company (Purnawirawan et al., 2012), customers’ willingness to buy (Wang et al., 2022), and customers’ perceptions of the overall polarity of the sentiment of the review itself (Lu et al., 2021), no previous studies we are aware of have associated the polarity of second constituents with satisfaction of reviewers.
Lastly, these results shed additional light on how customers communicate their (dis)satisfaction online, particularly in reviews. ACs appear to be a fairly frequently occurring feature of online restaurant reviews. They are indicators of both where an expectation is being conveyed and to what extent the expectation was met. The thematic analysis of this study revealed patterns in how customers communicated their expectations, specifically through contrasting or conceding positive and negative (or vice versa) constituents, through contrasting or conceding situational information, or through contrasting or conceding positive and positive (or negative and negative) information. Such expectations are likely communicated in other types of online reviews as well because adversative connectives function similarly across registers of language (Biber, 2006; Zhang, 2021).
The results of this study identify many areas for future research to explore. First, the quantitative analysis examined only second constituents, but the qualitative results indicated some need to examine these constituents in light of the information provided in the first constituents. More research should be conducted into the relationship between the first and second constituents in AC constructions. While the focus of this study was primarily to examine whether expectations were met, which the second constituents seemed to communicate, it would also be interesting to look at the first constituent when expectations are frequently established or when contrastive statements are made that are deemed less important than the second constituent. A better understanding of the relationship between the two constituents could give greater insight into the ways in which expectations are established and met or not met by restaurants or into the relative weight customers place on different aspects of their dining experiences. Secondly, the study examined a specific data set of online reviews within one industry, limiting the generalizability of the findings. Additional studies could extend the analysis to other online review sites or online reviews of businesses besides restaurants. Thirdly, future work could evaluate whether different adversative connective constructions vary in the extent to which they predict star ratings within the context of reviews by considering adversative type as a predictor.
Footnotes
Appendix
| Themes | Stars | ||||||||||||
|---|---|---|---|---|---|---|---|---|---|---|---|---|---|
| 1 | 2 | 3 | 4 | 5 | Total | ||||||||
| First-level theme | Second-level theme | Second-level theme description | Neg. | Pos. | Neg. | Pos. | Neg. | Pos. | Neg. | Pos. | Neg. | Pos. | |
| Experience | Atmosphere | Ambiance of the restaurant | 1 | 1 | 3 | 1 | 9 | 9 | 4 | 22 | 1 | 10 | 61 |
| Cleanliness | Level of hygiene maintained | 4 | 0 | 9 | 0 | 3 | 0 | 0 | 1 | 0 | 0 | 17 | |
| Competitor | Comparison with other restaurants | 0 | 0 | 1 | 0 | 2 | 0 | 0 | 0 | 0 | 0 | 3 | |
| Crowdedness | Density of people in the restaurant | 1 | 1 | 3 | 0 | 8 | 4 | 3 | 4 | 0 | 0 | 24 | |
| Decor | Decoration of the restaurant | 2 | 0 | 1 | 0 | 3 | 5 | 1 | 5 | 0 | 1 | 18 | |
| Dress code | Rules regarding what clothing must be worn | 0 | 0 | 1 | 0 | 0 | 0 | 0 | 0 | 0 | 1 | 2 | |
| Lighting | Amount or type of lights | 0 | 0 | 2 | 0 | 1 | 1 | 0 | 0 | 0 | 0 | 4 | |
| Location | Geographic position of the restaurant | 0 | 0 | 1 | 1 | 5 | 4 | 1 | 2 | 0 | 4 | 18 | |
| Other | No recurrent theme | 1 | 0 | 1 | 1 | 1 | 0 | 0 | 1 | 0 | 0 | 5 | |
| Parking | Place to leave a vehicle | 0 | 0 | 0 | 0 | 0 | 0 | 1 | 1 | 0 | 0 | 2 | |
| Price | Cost of the experience (usually separate from food, e.g., venue fee) | 0 | 0 | 0 | 0 | 0 | 1 | 0 | 0 | 0 | 1 | 2 | |
| Temperature | Level of heat inside the restaurant | 1 | 0 | 5 | 0 | 1 | 0 | 1 | 0 | 1 | 0 | 9 | |
| Tv | Television playing at the restaurant | 3 | 0 | 0 | 0 | 0 | 1 | 0 | 0 | 0 | 0 | 4 | |
| View | What can be seen outside of the restaurant | 0 | 1 | 0 | 1 | 0 | 1 | 0 | 1 | 0 | 0 | 4 | |
| Volume | Level of loudness of the restaurant | 2 | 0 | 0 | 0 | 1 | 1 | 0 | 6 | 0 | 1 | 11 | |
| Food | Competitor | Comparison with other restaurants | 1 | 0 | 1 | 0 | 8 | 1 | 0 | 0 | 0 | 0 | 11 |
| Foreign | Foreign object in the food (e.g., hair) | 2 | 0 | 2 | 0 | 0 | 0 | 0 | 0 | 0 | 0 | 4 | |
| Other | No recurrent theme | 0 | 0 | 0 | 2 | 1 | 1 | 0 | 6 | 0 | 1 | 11 | |
| Portion | Amount of food | 4 | 3 | 8 | 4 | 25 | 5 | 6 | 8 | 1 | 1 | 65 | |
| Price | Cost of the food | 23 | 1 | 30 | 4 | 47 | 11 | 15 | 21 | 5 | 7 | 164 | |
| Quality | Preparation/flavor of the food | 86 | 10 | 172 | 26 | 239 | 89 | 59 | 132 | 16 | 78 | 907 | |
| Selection | Sufficient food items to choose from | 8 | 0 | 12 | 0 | 10 | 2 | 8 | 6 | 1 | 1 | 48 | |
| Unique | Distinctiveness of the food | 0 | 0 | 0 | 0 | 0 | 1 | 1 | 1 | 0 | 3 | 6 | |
| Service | Accuracy | Level of transparency/honesty of the service | 16 | 0 | 15 | 1 | 10 | 0 | 2 | 0 | 0 | 1 | 45 |
| Communication | Level of communicativeness of staff | 1 | 0 | 0 | 0 | 2 | 0 | 0 | 0 | 0 | 0 | 3 | |
| Competitor | Comparison with other restaurants | 0 | 0 | 0 | 0 | 2 | 0 | 0 | 0 | 0 | 0 | 2 | |
| Crowdedness | Number of customers affecting the service | 0 | 0 | 0 | 0 | 0 | 0 | 1 | 0 | 0 | 1 | 2 | |
| Hours | Times the restaurant is open | 0 | 0 | 1 | 0 | 0 | 3 | 0 | 0 | 0 | 0 | 4 | |
| Other | No recurrent theme | 0 | 0 | 0 | 0 | 1 | 1 | 0 | 0 | 0 | 2 | 4 | |
| Price | Cost of the service | 2 | 0 | 2 | 0 | 1 | 2 | 1 | 0 | 0 | 1 | 9 | |
| Process | Steps the restaurant takes to intake and serve customers | 4 | 0 | 7 | 0 | 2 | 1 | 1 | 3 | 0 | 4 | 22 | |
| Professionalism | Level of competence demonstrated by staff, usually to do with the treatment of the customer | 80 | 6 | 70 | 11 | 44 | 16 | 8 | 23 | 0 | 18 | 276 | |
| Remedy | Measures taken to set an issue right | 13 | 2 | 5 | 3 | 0 | 2 | 0 | 1 | 0 | 6 | 32 | |
| Rushed | Amount of time allowed by staff to stay in the restaurant | 2 | 0 | 4 | 0 | 4 | 0 | 2 | 1 | 0 | 2 | 15 | |
| Supplies | Stock of non-food resources | 0 | 0 | 3 | 0 | 3 | 0 | 0 | 0 | 1 | 0 | 7 | |
| Wait time | Amount of time required to be seated, order food, and be served | 20 | 1 | 33 | 0 | 15 | 4 | 4 | 9 | 0 | 3 | 89 | |
| Total | 277 | 26 | 392 | 55 | 448 | 166 | 119 | 254 | 26 | 147 | 1910 | ||
Acknowledgements
We would like to thank Daniel Keller for allowing us to use his Yelp restaurant reviews data set. We would also like to thank Kate Giles and Emma Hebertson, who helped with the content analysis.
Declaration of Conflicting Interests
The author(s) declared no potential conflicts of interest with respect to the research, authorship, and/or publication of this article.
Funding
The author(s) disclosed receipt of the following financial support for the research, authorship, and/or publication of this article: The authors received funding from the BYU College of Humanities to compensate the research assistants who helped with the content analysis.