
Abstract
Background:
Trochlear dysplasia (TD) is considered by many to be an important risk factor for patellar dislocation (PD), and its accurate assessment is critical. Several methods to quantify TD exist, but none stand alone as the ideal measurement.
Hypothesis:
The authors hypothesized that a novel TD measurement, the lateral trochlear anterior condyles (LTAC) angle, is a simple yet comprehensive and reproducible technique for describing TD. Patients with PD will have lower LTAC angles (flatter trochlear groove [TG]) than controls; patients with recurrent PDs (RPDs) will have lower LTAC angles (flatter TG) than those with onetime PDs (OPDs).
Study Design:
Cross-sectional study; Level of evidence, 3.
Methods:
A retrospective case-control study was conducted of pediatric and adolescent patients with a history of PD versus a control group of age- and sex-matched patients (individuals with anterior cruciate ligament injuries but no history of PD). A subgroup analysis compared those with OPD versus RPDs. The LTAC angle was defined as the angle formed between (1) the lateral trochlear facet and (2) a line drawn connecting the most anterior portion of the medial and lateral femoral condyles. The LTAC angle was measured at 4 axial magnetic resonance imaging levels within the TG, assessing cartilaginous and osseous surfaces. LTAC mean differences were analyzed (all PDs vs controls; RPDs vs OPDs), and cutoffs for distinguishing all PDs from controls were based on the Youden index.
Results:
There were 170 patients (mean ± SD age, 15.29 ± 2.45 years; 58% female) with a history of PD (106 RPDs and 67 OPDs) and 98 controls (mean age, 15.56 ± 1.40 years; 47% female). Significant differences in mean LTAC values were observed between PD cases and controls at all levels of the TG on cartilaginous and osseous surfaces (P < .001). Patients with RPDs demonstrated significantly lower cartilaginous LTAC values than those with OPDs across all TG levels (P < .05), while osseous LTAC values showed no statistically significant differences at the proximal 3 axial levels (P > .05).
Conclusion:
The LTAC angle, a novel TD measurement, consistently shows lower values in PD cases as compared with controls throughout the TG. The LTAC angle combines the advantages of the lateral trochlear inclination angle and the sulcus angle (TG congruency) and assesses TD using a 1-image technique. The LTAC angle is a simple yet comprehensive measurement technique for TD that is able to stratify patients based on a history of PD events.
Trochlear dysplasia (TD) is a risk factor for primary and recurrent patellar dislocation (RPD), present in approximately 85% of patients with RPD. 11 Historically, TD was assessed qualitatively via the Dejour classification system. 18 More recently, quantitative measurements such as the lateral trochlear inclination (LTI) angle, sulcus angle (SA), and trochlear depth have become standard practice. 15 Currently, there are numerous measurement techniques available; one review identified 33 distinct methods to evaluate TD. 17 However, no single technique has emerged as the definitive standard to accurately and reliably capture TD in all patients and its clinical significance.16,18,19 Establishing a simple, reliable, and comprehensive measurement technique would benefit orthopaedic surgeons in counseling patients and planning operations.
A systematic review investigating measures of TD demonstrated that the most utilized angle by experts is the LTI angle. 17 Carrillon et al 6 reported that an LTI threshold of 11° had a sensitivity of 93% and a specificity of 87% for diagnosing a propensity for patellar instability. While this was initially described by a single-image technique, the 2-image technique has gained popularity for its improved accuracy in measuring the true lateral facet inclination.6,7,13 However, whereas the 2-image technique may offer greater accuracy, it is more challenging to measure, which may diminish its reliability. 13 Furthermore, LTI measurements assess lateral facet inclination relative to the posterior femoral condyles, rather than trochlear congruency, and thus can be inaccurate depending on the angle of the posterior femoral condyles. 7
In addition to the LTI angle, the SA is another magnetic resonance imaging (MRI)–based TD measurement, which is a direct representation of the trochlear groove (TG). 10 However, it is frequently measured by a single axial MRI scan, even though there are typically 4 reasonable MRI axial scans of the TG (4 mm apart, with a typical trochlear length of 2 cm). 21
This research team has conducted prior retrospective studies using the same patient cohorts. By recording SA measurements at 4 consecutive axial MRI levels on osseous and cartilaginous surfaces, we initially demonstrated the importance of clearly defining the axial level and surface of SA measurements, and we proposed relevant cutoff values specific to the surface and axial level. 4 Building on this work, these cutoff values were applied to define the multilevel axial patellofemoral score for TD, a novel TD severity stratification system. 3 Together, these studies informed the present investigation by emphasizing the importance of measuring this novel TD parameter—lateral trochlear anterior condyles (LTAC) angle—at 4 axial levels on cartilaginous and osseous surfaces, with the goal of clarifying the morphologic characteristics of TD.
In this study, we describe a novel MRI-based TD measurement: the LTAC angle (Figure 1). Utilizing the anterior femoral condyle as a reference, the LTAC angle combines the advantages of the LTI (ie, assessment of the lateral facet inclination, crucial for predicting lateral patellar dislocation [PD]) and the SA (ie, comprehensive quantification of the patellofemoral morphology by involving the medial facet). This allows for the utilization of a 1-image technique; specifically, measurement on each level uses just a single axial image. The purpose of this study is to define the LTAC angle and establish its clinical relevance by measuring it at 4 consecutive axial MRI levels on cartilaginous and osseous surfaces and to establish its relationship with patellar instability.

(A) Proximal, (B) near-proximal, (C) near-distal, and (D) distal measurements of LTAC angles (LTAC1-LTAC4, respectively). The cartilaginous LTAC angle is depicted in yellow and the osseous LTAC in blue. The proximal trochlear groove (LTAC1) was defined as the most superior axial magnetic resonance image demonstrating fully developed cartilage of the medial and lateral trochlear facets, with LTAC2 to LTAC4 measured at the 3 immediately distal consecutive axial images. LTAC, lateral trochlear anterior condyles.
Methods
After approval from the institutional review board (2016-6534), a comprehensive registry was compiled of pediatric and adolescent patients aged 9 to 21 years who underwent MRI evaluation at the institution, inclusive of all patients treated by the division of pediatric orthopaedic surgery. These individuals received treatment for patellar instability through the division of pediatric orthopaedic surgery between 2012 and 2023. A retrospective analysis of medical documentation for 230 patients was performed to compare pediatric and adolescent patients with a history of PD versus a control group of age- and sex-matched patients (ie, individuals with anterior cruciate ligament injuries but no history of PD). These cohorts were used in previous works by this research team as described in the introduction.3,4 A subgroup analysis compared patients with a onetime PD (OPD) event versus those experiencing RPDs, defined as ≥2 occurrences. Classification in the RPD group was validated through medical record assessment or telephone interviews at final follow-up. Preoperative MRI scans used for measurements were taken at the time of, or shortly after, the initial dislocation episode (1.5- and 3-T Philips and GE models). Patients were excluded if their MRI scans exhibited poor image quality (ie, insufficient resolution at 1 or more axial levels of the TG that prevented accurate LTAC measurement) or they had previously undergone knee surgery on the affected joint. A minimum follow-up of 2 years from the initial presentation was required.
The LTAC angle was evaluated on cartilaginous and osseous surfaces at 4 sequential axial levels of the TG: proximal (LTAC1; Figure 1A), near proximal (LTAC2; Figure 1B), near distal (LTAC3; Figure 1C), and distal (LTAC4; Figure 1D). The LTAC angle was defined as the angle formed by (1) the lateral trochlear facet and (2) a line connecting the most prominent portions of the lateral and medial anterior femoral condyles. Patients with convex TG were assigned negative LTAC values when line 1 was anterior to line 2.
The measurements were performed independently by 2 evaluators: a sports medicine and pediatric orthopaedic fellowship–trained surgeon (M.D.J.; senior author) and a fourth-year medical student (J.B.; following a video-recorded training session with the senior author). All MRI examinations were performed at a single institution with the knee positioned in the anteroposterior plane during standard supine positioning in extension. Because this classification focuses on evaluating cartilaginous and osseous structures rather than soft tissue, it can be accurately recorded regardless of the knee's exact flexion/extension position. Image acquisition utilized a 16-channel knee coil to capture the following sequences: coronal T1-weighted, coronal proton density fat saturated, sagittal proton density, sagittal proton density fat saturated, and axial proton density fat saturated.
The proximal TG was defined as the most superior axial image showing visible cartilaginous portions of medial and lateral trochlear facets. This image selection was verified by cross-referencing with the sagittal plane (Figure 1). This level was used to measure cartilaginous LTAC1 (yellow angle, Figure 1A). Cartilaginous LTAC2 to LTAC4 (yellow angles; Figure 1, B-D) were measured at the subsequent 3 distal axial levels; MRI slices were spaced equally, approximately 4 mm apart. Therefore, the 4 levels used for measurements were consecutive axial MRI scans starting with the proximal level as previously defined. This procedure was replicated for osseous LTAC measurements using the subchondral bone immediately posterior to the cartilaginous surface. The identical 4 levels used for cartilaginous LTAC1 to LTAC4 were correspondingly employed for osseous LTAC1 to LTAC4 (blue angles, Figure 1).
Statistics
The normality assumption for all LTAC variables was evaluated by the modified Kolmogorov-Smirnov test. LTAC variables were reported as mean and standard deviation, median and IQR, and range. Statistical analyses were conducted in IBM SPSS for Mac Version 20. Cohort comparisons were performed by 1-way analysis of variance including all 3 cohorts (controls, OPDs, and RPDs). For each LTAC parameter (LTAC1-LTAC4, cartilaginous and osseous), an omnibus analysis of variance was first conducted to assess overall group differences. Prespecified planned contrasts were then applied to test 2 a priori hypotheses: (1) controls versus all PDs and (2) RPDs versus OPDs. Because these contrasts were defined a priori and limited in number, post hoc multiple-comparison adjustments were not performed. The LTAC angle was reported as mean and standard deviation, median and interquartile range, and range; P < .05 was considered statistically significant. To establish cutoff values that optimized the need to catch true positives without too many false positives, values were selected per the Youden index by comparing all PDs versus controls. The odds ratio of being a PD relative to control based on this proposed diagnostic cutoff value was calculated by logistic regression modeling.
Intra- and interobserver reliability was assessed by the intraclass correlation coefficient. LTAC measurements were recorded by 2 raters (M.D.J. and J.B.) on 30 randomly selected knees from the study population. 20 To evaluate intrarater reliability, the same raters repeated the measurements blindly after an 8-week interval. Reliability was classified as poor for intraclass correlation coefficient values <0.50, moderate for 0.50 to 0.74, good for 0.75 to 0.90, and excellent for >0.90. 20
Results
Of the 230 knees with PD that met inclusion criteria, 54 knees were excluded because of absent MRI studies (taken at an outside institution or could not be opened) or poor MRI studies (image quality insufficient to record reliable measurements), and 3 knees were excluded because they were lost to follow-up. The final count of PD knees was 173: the RPD cohort included 106 knees (97 patients; mean follow-up time, 5.40 years; range, 2.10-11.43), and the OPD cohort included 67 knees (65 patients; mean follow-up time, 4.75 years; range, 2.05-10.40) (Figure 2). There were 98 age- and sex-matched control knees (98 patients) from the internal database of patients with anterior cruciate ligament injuries but no history of PD. The 2 groups did not differ significantly in age at the time of MRI (mean ± SD; age, 15.29 ± 2.45 years for the PD group vs 15.56 ± 1.40 years for controls; P = .25) or gender distribution (58% female in the PD group vs 47% in controls; P = .13).

CONSORT chart depicts study cohorts. MRI, magnetic resonance image; OPD, onetime patellar dislocator; PD, patellar dislocator; RPD, recurrent patellar dislocator.
When the PD cohort was compared with controls, the mean LTAC values were significantly lower (flatter TG) in the PD group across all 4 levels of the TG for cartilaginous and osseous measurements (Tables 1 and 2). In the PD and control groups, LTAC values (cartilaginous and osseous) were lower (flatter TG) at the proximal TG levels as compared with more distal levels (Figure 1, A and B ). Additionally, cartilaginous LTAC measurements were lower than osseous values at all TG levels in both cohorts (Figure 3, A and B ).
Comparative Statistics Among Study Cohorts: Cartilaginous Surfaces a

All LTAC angle measurement units are degrees. LTAC1-LTAC4: proximal, near-proximal, near-distal, and distal measurements, respectively. (c), cartilaginous; LTAC, lateral trochlear anterior condyles; OPD, onetime patellar dislocator; PD, patellar dislocator; RPD, recurrent patellar dislocator.
Comparative Statistics Among Study Cohorts: Osseous Surfaces a

All LTAC angle measurement units are degrees. LTAC1-LTAC4: proximal, near-proximal, near-distal, and distal measurements, respectively. LTAC, lateral trochlear anterior condyles; (o), osseous; OPD, onetime patellar dislocator; PD, patellar dislocator; RPD, recurrent patellar dislocator.

Receiver operating characteristic (ROC) curve depicts the area under the curve for all lateral trochlear anterior condyles (LTAC) measurements. Area under the curve: LTAC1 (c), 0.88; LTAC2 (c), 0.89; LTAC3 (c), 0.89; LTAC4 (c), 0.86; LTAC1 (o), 0.90; LTAC2 (o), 0.90; LTAC3 (o), 0.90; LTAC4 (o), 0.88. LTAC1-LTAC4: proximal, near-proximal, near-distal, and distal measurements, respectively. (c), cartilaginous; (o), osseous.
When patients with RPDs were compared with those with OPDs, mean cartilaginous LTAC values were lower in the RPD group at all 4 axial levels (Table 1). For example, at the proximal level, LTAC1 (cartilaginous), the RPD mean was 3.5° and the OPD mean was 4.8° (P = .026). While there were no statistically significant differences observed between groups for the proximal 3 osseous LTAC measurements (Table 2), these differences trended toward significance (LTAC1, P = .133; LTAC2, P = .140; LTAC3, P = .079). The receiver operating characteristic curves indicated that the LTAC angle is a useful diagnostic test for all axial levels on cartilaginous and osseous measurements (Figure 4).

Line graft depicts sample mean LTAC angles for (A) cartilaginous and (B) osseous measurements in all PDs, controls, RPDs, and OPDs. LTAC, lateral trochlear anterior condyles; OPD, onetime patellar dislocator; PD, patellar dislocator; RPD, recurrent patellar dislocator. LTAC1-LTAC4: proximal, near-proximal, near-distal, and distal measurements, respectively.
Diagnostic cutoff values for LTAC were lower at more proximal levels of the TG as compared with distal levels and lower when based on cartilaginous rather than osseous measurements (Table 3).
Odds Ratio of PD vs Control for Associated Diagnostic Cutoff Values a
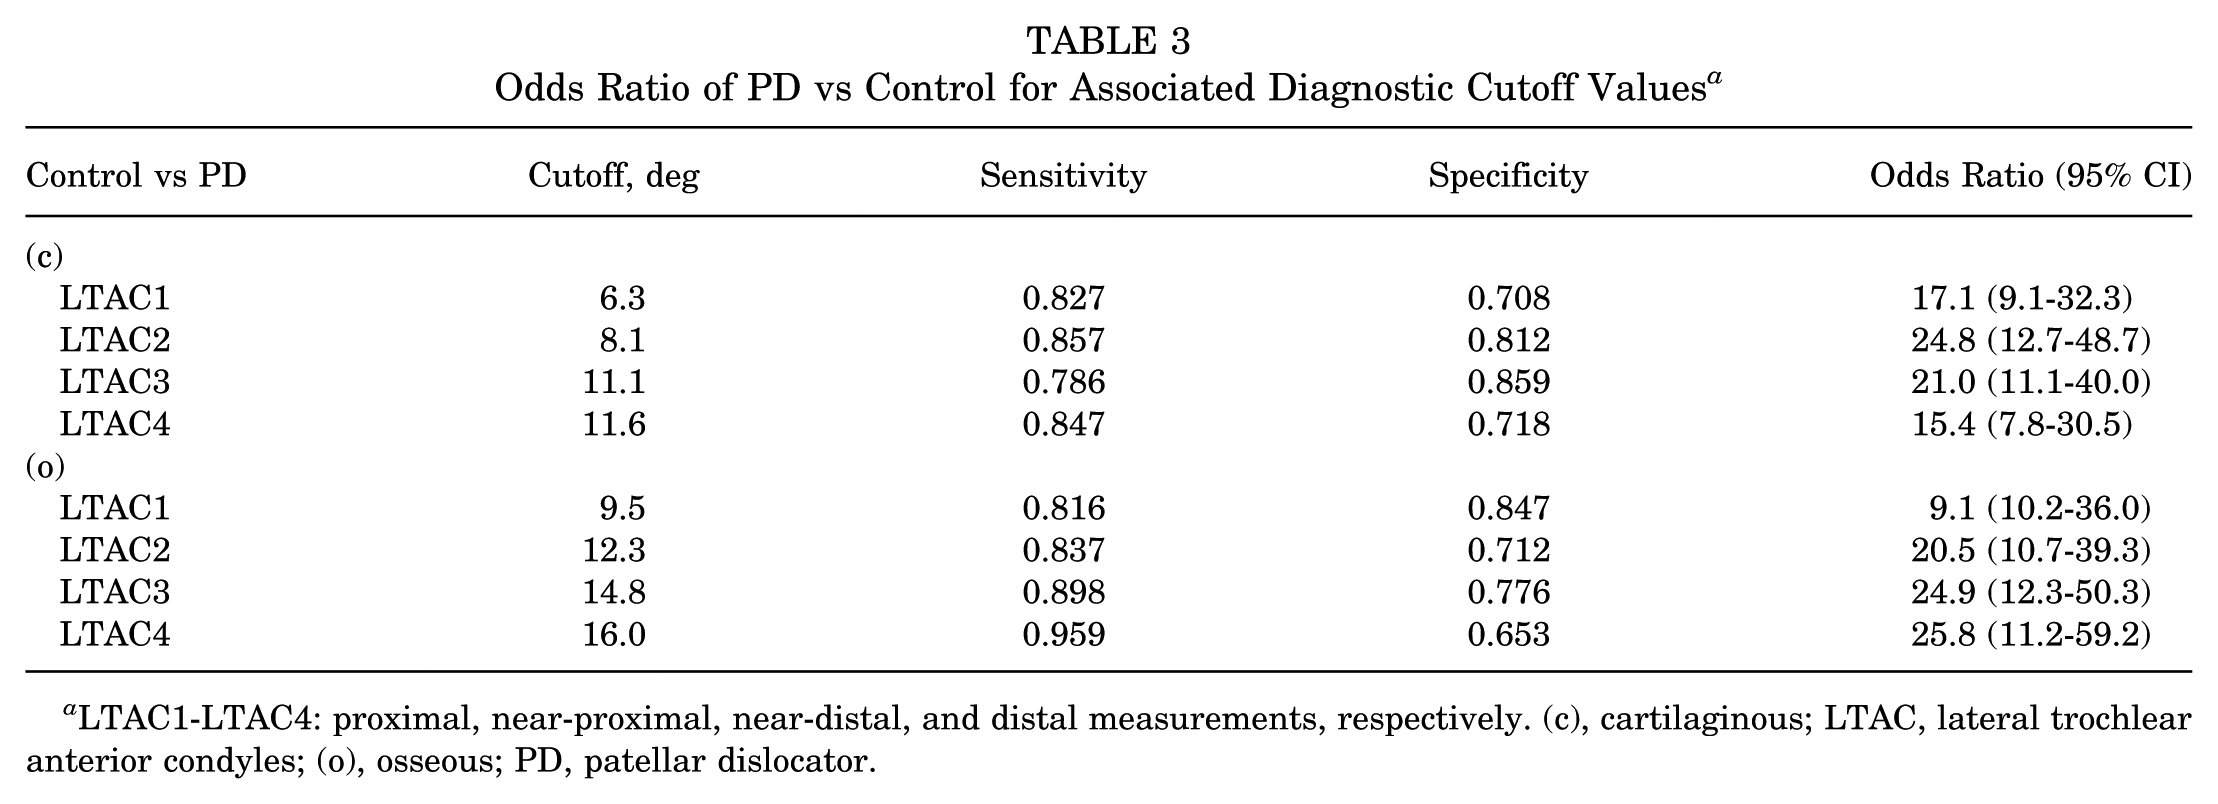
LTAC1-LTAC4: proximal, near-proximal, near-distal, and distal measurements, respectively. (c), cartilaginous; LTAC, lateral trochlear anterior condyles; (o), osseous; PD, patellar dislocator.
Intra- and interobserver intraclass correlation coefficients were excellent for all TG axial levels and on cartilaginous and osseous surfaces (Table 4).
Intra- and Interobserver Reliability as Determined by the Intraclass Correlation Coefficient a

Data in parentheses represent 95% CI. LTAC1-LTAC4: proximal, near-proximal, near-distal, and distal measurements, respectively. (c), cartilaginous; LTAC, lateral trochlear anterior condyles; (o), osseous.
Discussion
The LTAC angle was found to be highly useful at differentiating PDs from controls for all 4 consecutive axial levels of the TG for cartilaginous and osseous measurements. However, RPDs and OPDs had different LTAC values for the cartilaginous but not osseous measurements, suggesting that the cartilaginous is the optimal surface to evaluate TD. LTAC values were lowest (a flatter TG) at proximal cartilaginous measurements and higher (deeper TG) at distal osseous measurements. The LTAC measurements in this study had excellent inter- and intraobserver reliability. Overall, the LTAC angle was demonstrated to be a simple and reliable technique that contains several advantages: measurements of the LTI, measurement on each level by a single axial image, characterization of TG congruency as in the SA, and ability to distinguish between RPD and OPD.
Building on our prior work defining standardized SA cutoff values and developing the severity stratification system (multilevel axial patellofemoral score for TD), the present study advances this line of investigation by introducing the LTAC as a complementary and potentially more streamlined morphologic parameter of TD.3,4 As was the case with SA, the LTAC angle similarly differentiates PDs from controls across all axial levels and discriminates between RPDs and OPDs on cartilaginous assessment. In doing so, this work refines the group's evolving framework for TD evaluation by integrating the morphologic insights of SA and LTI into a 1-image metric.
Given that TD is strongly associated with primary and recurrent PD (reduced bony constraint and maltracking leading to early flexion instability), it is crucial to have accurate and reliable measurement tools.2,5,9 A systematic review of TD measurement techniques identified 33 published methods, 6 of which were recommended for clinical use.1,8,12 The most used angle to measure TD according to expert opinion in this systematic review was the LTI angle. 17 However, the LTI angle is not a direct representation of the TG and therefore may not accurately capture TD in all cases.
The LTAC angle offers several advantages over previously described TD measurement techniques. Its value range is intuitive: lower LTAC values correspond to flatter TGs (Tables 1 and 2). Notably, severely dysplastic convex trochleae are easily represented by negative LTAC values, which enhance interpretability. The results from this study clearly reflect the reliability of LTAC as a measure of TD. As depicted in Figure 4, LTAC measurements reflect the natural phenomenon of shallower TG depth proximally and on cartilage and greater TG depth distally and on osseous measurements.
The LTAC angle improves on the LTI method, a commonly used metric in the literature.5,7 LTI, whether measured by the 1- or 2-image technique, relies on the posterior femoral condyles as a reference, making it susceptible to variation from femoral rotation or morphology. 7 Conversely, the LTAC angle utilizes the anterior femoral condyles, a more convenient reference point that allows for measurement using a 1-image technique. The findings of this study support the LTAC angle as a simple yet comprehensive method to assess TD.
Identifying risk factors for RPD after an initial episode would benefit orthopaedic surgeons in management of this complex clinical problem.5,14 In our cohort, cartilaginous measurements of LTAC have a high likelihood (odds ratio) for identifying PDs versus controls. Comparisons between the RPD and OPD cohorts demonstrated differences in LTAC across all 4 levels of the TG when assessing cartilage, whereas the 3 most proximal levels showed no difference between cohorts when based on osseous measurements. Perhaps, the cartilaginous LTAC angle offers a novel, reliable, and clinically useful representation of TD.
Limitations
Several limitations are worthy of consideration. Owing to limitations in MRI quality, 54 knees were excluded from the analysis. Additionally, 3 patients who were initially identified as having OPD based on chart review were removed from the study, as they were lost to follow-up. Patients with histories inclusive of neurologic and syndromic pathologies that may have affected anatomy were not specifically verified, and these patients were not excluded. However, these patients would have represented a very small portion, if any, of the cohort. The retrospective nature of the study introduces the possibility of selection bias, which may influence the strength of the conclusions. Nonetheless, the final sample size was adequate to support the statistical analyses conducted.
Another limitation is the use of only 2 evaluators, which may affect the generalizability of the measurements. As this study proposed a novel measurement technique of TD, there has never been verification of the LTAC angle with another cohort of patients and a different set of raters. Patients with chondral defects or osteochondral injury were not excluded, which could have affected the accuracy and reliability of cartilaginous measurements. Nonetheless, the cartilaginous measurements had consistently excellent inter- and intraobserver reliability. The age group (9-21 years) of the cohorts may limit the generalizability to all patients. This study does not compare LTAC with other measures of TD, such as SA or LTI. It does not assess the region proximal to the most proximal axial image, including the presence of supratrochlear spurs, an important radiographic finding associated with severe TD. This would be an appropriate objective for a future study.
Conclusion
The LTAC angle, a novel TD measurement, consistently shows lower values in PDs as compared with controls throughout the TG. The LTAC angle combines the advantages of the LTI (inclination of the lateral trochlea) and the SA (TG congruency) and assesses TD using a 1-image technique. The LTAC angle is a simple yet comprehensive measurement technique for TD that is able to stratify patients based on a history of PD events.
Footnotes
Final revision submitted February 25, 2026; accepted March 2, 2026.
The authors have declared that there are no conflicts of interest in the authorship and publication of this contribution.
Ethical approval for this study was obtained from Montefiore Medical Center (121757).