
Abstract
Background:
There is currently no established standard classification system for stratifying trochlear dysplasia (TD) severity. Many magnetic resonance imaging (MRI)-based classification systems focus on only a single axial level, even though the trochlear groove (TG) spans several axial levels. Evaluating multiple axial levels of the TG may allow a complete assessment.
Hypothesis:
A novel MRI-based TD severity classification system based on 4 axial levels will yield a more comprehensive assessment of the TG.
Study Design:
Cross-sectional study; Level of evidence, 3.
Methods:
Pediatric patients were retrospectively categorized into 2 groups: those with recurrent patellar dislocations (RPDs; n = 106; mean age, 15.29 ± 2.45 years) and those with no history of patellar dislocations (controls; n = 98; mean age, 15.56 ± 1.40 years). Cartilaginous sulcus angle (SA) measurements were conducted at 4 consecutive axial levels on MRI starting at the proximal TG (SA1 = most proximal, SA2 = near-proximal, SA3 = near-distal, and SA4 = most distal). Cutoff values were identified using the Youden index. Patients were classified based on the number of elevated SA values: all 4 elevated values indicated grade 4 TD, 3 elevated values indicated grade 3 TD, 2 elevated values indicated grade 2 TD, 1 elevated value indicated grade 1 TD, and all normal values indicated grade 0 TD. Proportions were calculated, and the Fisher exact test was used to compare TD severity between the RPD and control groups.
Results:
Diagnostic cutoff values were as follows: SA1, 160°; SA2, 154°; SA3, 153°; and SA4, 148°. The RPD group was more likely to have grade 4 TD (58% vs 4%, respectively; P < .001) and grade 3 TD (13% vs 4%, respectively; P = .03) compared with the control group. Conversely, the RPD group had less grade 0 TD (8% vs 68%, respectively; P < .001). There was no difference in the proportions with grade 2 TD (13% vs 9%, respectively; P = .39) or grade 1 TD (8% vs 14%, respectively; P = .27) between the RPD and control groups. Intraobserver reliability was excellent for SA1 to SA4, and interobserver reliability was excellent for SA1 and SA4 and good for SA2 and SA3.
Conclusion:
The Multi-level Axial Patellofemoral Score for Trochlear Dysplasia (MAPS-TD) is a novel classification system that stratifies TD severity and has demonstrated accuracy and reliability in distinguishing patients with RPDs from controls. Its primary clinical utility lies in differentiating more extensive TD (especially grade 4) from mild TD (grades 1 and 2). The MAPS-TD may help guide surgical decision-making, possibly even in identifying candidates for surgical procedures (ie, trochleoplasty) among those with grade 4 TD.
Trochlear dysplasia (TD) is a major risk factor for both primary and recurrent patellar dislocations (RPDs). 35 Approximately 85% of patients with recurrent patellar instability exhibit evidence of TD.10,12,19 Accurately identifying patients at a high risk for RPDs is critical, as repeated dislocations can be particularly debilitating and lead to osteochondral lesions and early patellofemoral osteoarthritis.18,22,24,25,36 Trochleoplasty is a surgical option for patients with severe TD, but there is no consensus on which radiological parameters define severe TD.1,7
The Dejour classification system describes trochlear morphology, initially based on lateral radiography. 33 With the increased utilization of axial magnetic resonance imaging (MRI), more detailed assessments of trochlear features, such as shallowness, asymmetry, and convexity, have become possible. 14 However, it has been criticized for its subjectivity, irreproducibility, and inability to guide counseling.14,27 There is growing evidence that 3-dimensional imaging, particularly computed tomography, may more accurately depict trochlear osseous morphology compared to the 2-dimensional views provided by radiography and MRI.2,17,20,38 However, computed tomography also has limitations, including reduced visualization of cartilage and increased radiation exposure, an especially important consideration in the pediatric population. Other MRI-based systems have been proposed, including the Oswestry-Bristol classification system, which was designed to be more straightforward and reproducible than the original Dejour classification system. 26 Recently, Dejour et al 8 have adapted their classification system for MRI-based quantitative measurements by only employing thresholds of a sulcus angle (SA) >157° and lateral trochlear inclination <14°. However, these systems typically assess only a single axial MRI slice, despite the trochlear length spanning approximately 2 cm.4,32 A more comprehensive understanding of TD across the full length may improve risk stratification, support earlier targeted interventions, and enhance clinical decision-making.
The SA is an accurate and reliable measure of TD and is defined as the angle formed by lines connecting the most prominent points of the medial and lateral trochlear facets to the deepest point of the trochlear groove (TG). 23 The SA is optimally assessed using MRI, which allows for high-resolution visualization of cartilage and enables the evaluation of multiple axial levels.21,23 A critical issue limiting the clinical utility of the SA is that the appropriate cutoff value varies depending on both the axial level and the surface (cartilage vs bone). 30 Cartilaginous SA measurements have been preferred by many authors because this surface reflects the direct representation of patellar-femoral joint congruency.28,30 Therefore, assessing the cartilaginous SA at 4 consecutive axial levels on MRI may improve reproducibility in addition to providing a more extensive evaluation of the TG. Prior work by our group has established cutoffs for the SA and demonstrated that, to best evaluate TD using the SA, it should be measured on the cartilaginous surface and along 4 consecutive axial levels rather than as a singular measurement. 3
The objective of the present study was to define a system that classifies TD severity using SA measurements and to determine whether TD severity was associated with the recurrence of patellar dislocations. This comprehensive multilevel approach to assess TD aimed to address the limitations of single-level measurements and provide a more nuanced understanding of the relationship between TG morphology and patellar dislocation outcomes, which may help to guide indications for treatment decision-making. We hypothesized that patients with RPDs would be more likely to demonstrate elevated SA measurements throughout the TG compared to controls.
Methods
After institutional review board approval (No. 2016-6534), a list of pediatric patients treated for patellar dislocations by the Department of Pediatric Orthopedic Surgery at a single institution between 2012 and 2023 was compiled based on the diagnostic codes for a patellar dislocation. These 230 patients were retrospectively reviewed to confirm a history of patellar dislocations and to further identify only those who experienced RPDs (defined as at least 2 patellar dislocations). Status as a patient with an RPD was confirmed through a medical record review or telephone follow-up (conducted by a fourth-year medical student [J.B.] based on a script agreed upon with the principal investigator and designed for total clarity and consistency). All patients with only 1 (confirmed) patellar dislocation were considered to have non-RPDs and were excluded. An age- and sex-matched control group was formed using patients who underwent MRI for anterior cruciate ligament injuries. These patients were confirmed to have no history of patellar dislocations. Inclusion criteria were age <21 years with a viewable MRI scan in our picture archiving and communication system. Exclusion criteria included MRI scans with poor image resolution at ≥1 axial levels of the TG that hindered accurate SA measurements, a history of surgery on the affected knee, a follow-up period <2 years from the initial presentation, and non-RPD status.
The cartilaginous SA was measured at 4 consecutive axial levels (4 mm apart) within the TG: proximal (SA1; Figure 1A), near-proximal (SA2; Figure 1B), near-distal (SA3; Figure 1C), and distal (SA4; Figure 1D). The level defined as the proximal TG (SA1) was the most superior axial level in which the cartilaginous portions of both the medial and lateral trochlear facets were identifiable (cross-referenced with the sagittal plane for verification; Figure 1, A-D), which is demonstrated as the green angle in Figure 1A. The measurements on the 3 subsequent distal axial levels were SA2 to SA4 (green angles in Figure 1, B-D). In the scenario of a convex, highly dysplastic trochlea, the SA was measured by the angle connecting the highest point of the medial and lateral facets to the apex of the convexity.
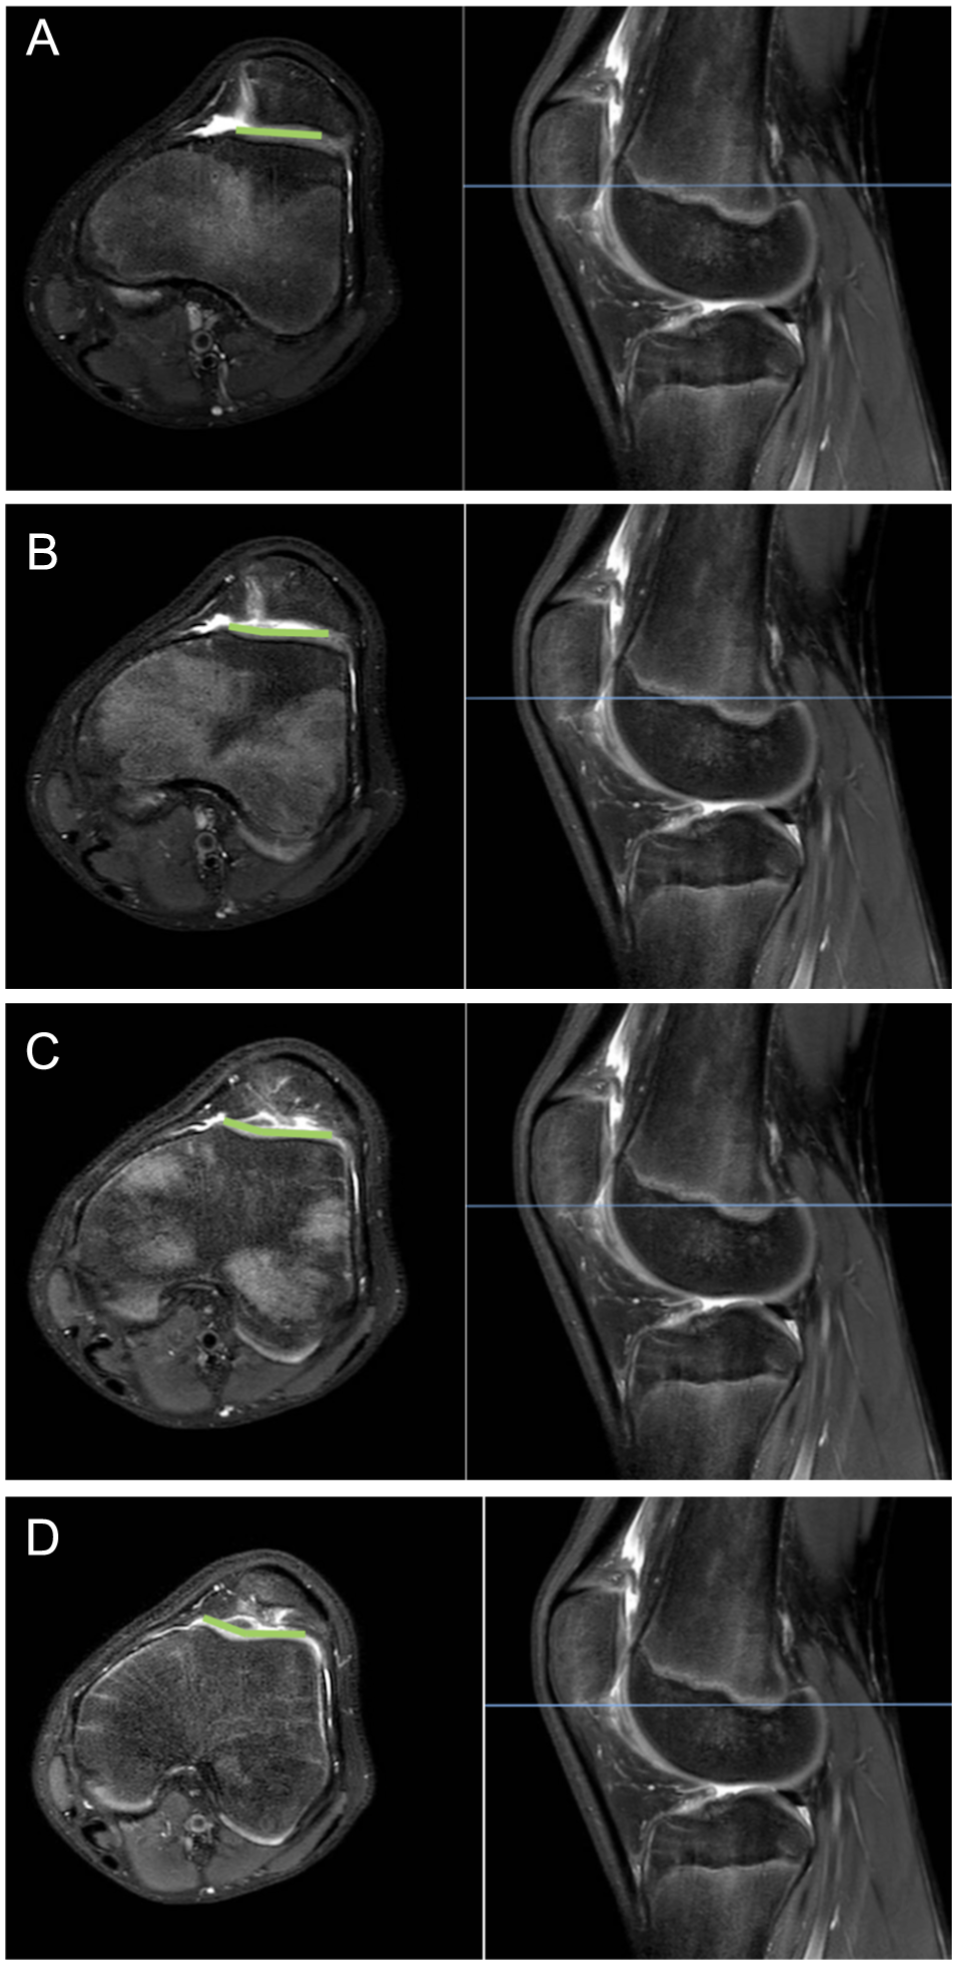
Measurement of the sulcus angle (SA) at 4 axial levels on T2-weighted magnetic resonance imaging: (A) proximal SA (SA1), (B) near-proximal SA (SA2), (C) near-distal SA (SA3), and (D) distal SA (SA4). Images were generated using picture archiving and communication system software and Microsoft Word. TG, trochlear groove.
The measurements were independently recorded by a fourth-year medical student (J.B.) and a fourth-year orthopaedic surgery resident (S.M.H.) after completing a video-based instructional session led by the senior author (M.D.). All MRI scans were obtained at the same medical center with the patient supine and the affected knee positioned in the anteroposterior plane in maximum possible extension. Imaging was carried out using a 16-channel knee coil, including the following sequences: coronal T1, coronal proton density with fat saturation, sagittal proton density, sagittal proton density with fat saturation, and axial proton density with fat saturation.
Comparisons between controls versus all patients with RPDs were made to identify cutoff values. Each distribution was graphed as a receiver operating characteristic curve, and the Youden index was utilized to isolate cutoff values that optimized sensitivity + 1 – specificity. The odds ratio (OR) of being a patient with an RPD compared to a control based on these cutoff values was calculated using logistic regression modeling.
The cutoff values (SA1-SA4) were applied to all patients with RPDs and controls, and the number of SA measurements exceeding the respective cutoff values was totaled. Patients with all 4 elevated SA values were classified as having grade 4 TD. Those with 3 elevated SA values were classified as having grade 3 TD, 2 elevated values as having grade 2 TD, 1 elevated value as having grade 1 TD, and all normal values as having grade 0 TD (ie, no TD).
Statistical analyses were conducted utilizing SPSS for Mac (Version 20; IBM). An independent-samples t test was used to assess differences in age between groups. The chi-square test was utilized to assess whether there was a difference in the sex distribution between groups. The Fisher exact test was used to assess whether differences in the proportions of TD grade were present between groups. A P value <.05 was considered statistically significant.
Intraobserver and interobserver reliability were evaluated using the intraclass correlation coefficient (ICC). SA measurements were obtained by both raters on a random sample of 30 knees from the study population. To assess measurement consistency, the same raters repeated the measurements in a blinded fashion after a 2-week interval. Reliability was interpreted as follows: ICC <0.50 indicated poor reliability, 0.50-0.74 moderate, 0.75-0.90 good, and >0.91 excellent. 15
Results
After applying inclusion and exclusion criteria, 106 RPDs (97 patients; mean follow-up, 5.40 years [range, 2.10-11.43 years]) remained (Figure 2). Overall, 98 age- and sex-matched controls from a database of patients with anterior cruciate ligament injuries but no history of patellar dislocations were included. There were no significant differences in age at MRI (RPD: 15.29 ± 2.45 years; control: 15.56 ± 1.40 years; P = .25) or sex distribution (RPD: 58% female; control: 47% female; P = .13) between the groups.

CONSORT diagram depicting study groups.
Diagnostic cutoff values for TD were greater for more proximal than distal levels (Table 1). The RPD group was more likely to have grade 4 and grade 3 TD and less likely to have no TD, with no significant differences in the proportions of grade 2 TD and grade 1 TD between groups (Table 2). The RPD group tended to have more TD proximally, although they were likely to have elevated SA values throughout the TG; conversely, there was no clear trend in the location of TD observed in the control group (Table 3).
Cutoff Values for SA by Axial Level a

AUC, area under the curve; OR, odds ratio; SA, sulcus angle.
Proportion of Patients by Trochlear Dysplasia Grade a

Data are shown as n (%) unless otherwise indicated. OR, odds ratio; RPD, recurrent patellar dislocation. Bolded values indicate significant P-values.
Proportion of Patients With Elevated SA Values a
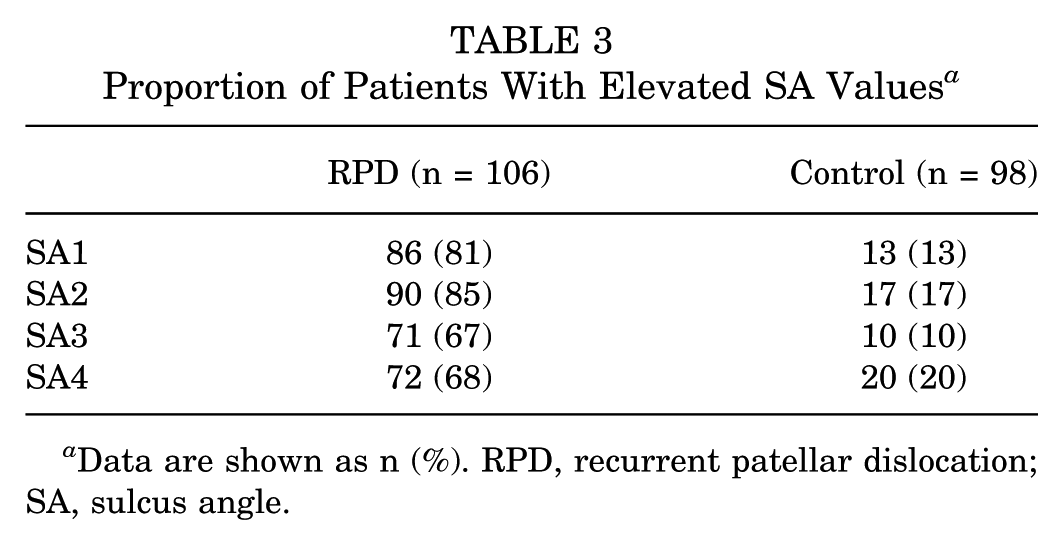
Data are shown as n (%). RPD, recurrent patellar dislocation; SA, sulcus angle.
Intraobserver ICCs were excellent for SA1 to SA4 (Table 4). Interobserver ICCs were excellent for SA1 and SA4 and good for SA2 and SA3 (Table 4).
Intraobserver and Interobserver Reliability a
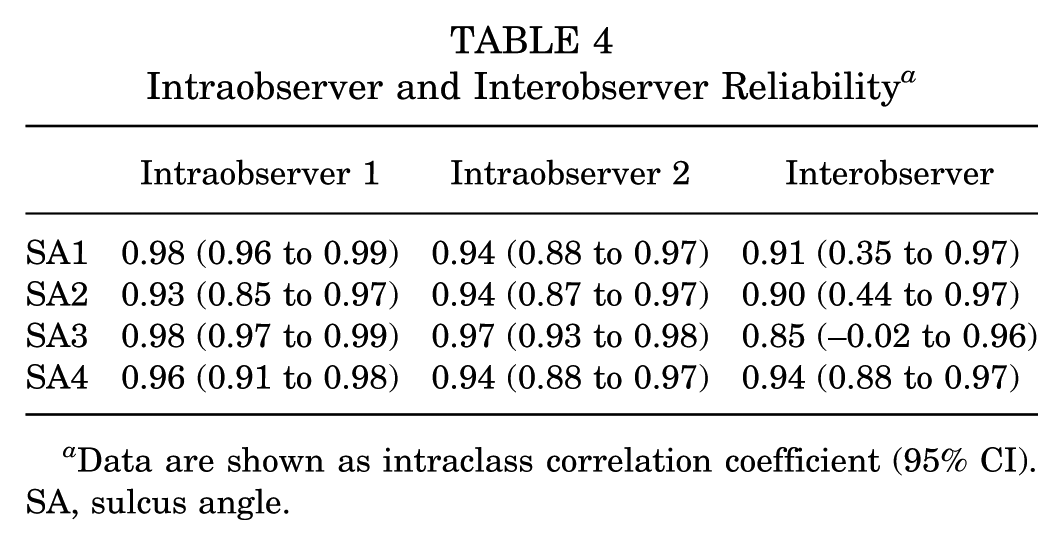
Data are shown as intraclass correlation coefficient (95% CI). SA, sulcus angle.
Discussion
The objective of the present study was to define a system that stratified TD severity using SA measurements and to determine whether TD severity was associated with the recurrence of patellar dislocations. Several key findings emerged. First, the proposed classification system stratified TD into 5 categories: grade 0 to 4 based on the number of axial levels with an elevated SA. Second, a significantly greater proportion of patients with RPDs compared to controls had grade 4 and grade 3 TD. Third, although the prevalence of grade 2 and grade 1 TD did not differ significantly between groups, the RPD group had a significantly lower proportion of cases with grade 0 TD. The Multi-level Axial Patellofemoral Score for Trochlear Dysplasia (MAPS-TD) aimed to improve the accuracy of TD assessments by measuring 4 axial levels, thereby avoiding situations in which TD is overestimated or underestimated on a single image. Better quantifying the degree of TD may allow surgeons to make more informed decisions about treatment options, potentially including surgical correction of trochlear morphology (ie, trochleoplasty).
TD is a pertinent risk factor for patellar dislocations. 37 Stratifying patients by both the depth and extent of TD may aid in surgical decision making, particularly in selecting candidates for procedures that address TD.11,34 Multiple systems have been proposed to assess and stratify TD severity, such as the Dejour classification system. 9 However, these frameworks consider only one level or radiographs, which likely limits the comprehensive evaluation of TD. The mean trochlear length is 2 cm, and MRI provides axial images that are typically about 4 mm apart.4,32 Therefore, measuring TD throughout the TG necessitates at least 4 axial images. The proposed classification system effectively stratified patients by TD severity and thereby enabled the identification of those at an increased risk for recurrence. The association between grade 4 TD and recurrence was significant: 58% of the RPD group exhibited grade 4 TD compared with 4% of the control group (P < .001). Grade 3 TD was also more likely (P = .03) in the RPD group (13%) compared with the control group (4%). Patients with grade 4 TD had higher odds of being in the RPD group (OR, 31.86 [95% CI, 10.90-93.07]), as did those with grade 3 TD (OR, 3.58 [95% CI, 1.13-11.27]).
Of the surgical procedures available for patients with patellar dislocations, only trochleoplasty addresses TD directly. 7 Numerous systematic reviews and meta-analyses have shown significant improvements in patient-reported outcomes, along with low rates of recurrent dislocations (typically 0.3%-2.4%) and high levels of patient satisfaction, at both short- and long-term follow-up.16,29 However, there is no consensus on the indications for trochleoplasty; instead, it is recommended for patients with recurrent patellar instability and “high-grade” TD, particularly in the presence of a prominent trochlear bump and patellar maltracking when other realignment procedures have previously failed. 9 We believe that the principles behind the classification system, including evaluating TD throughout the TG, may be useful to indicate trochleoplasty in the future for patients with grade 4 TD. Thus, we suggest subsequent studies comparing clinical outcomes and redislocation rates between patients with grade 4 TD who undergo patellar stabilization without trochleoplasty compared to trochleoplasty procedures.
No significant differences were observed in the proportion of cases of grade 2 TD between patients with RPDs (13%) and controls (9%) (P = .39), nor in grade 1 TD between patients with RPDs (8%) and controls (14%) (P = .27). This suggests that grade 1 and 2 TD may not be significant risk factors for an RPD, supporting the need to stratify TD by severity as proposed in this study. Stratifying TD by severity is critical, as simply reporting it as present or absent fails to reflect the full spectrum of morphology. Patients with these milder grades of TD are likely to have other risk factors for a patellar dislocation and would not benefit from trochleoplasty. In these cases, the presence of other anatomic risk factors, such as patella alta, an increased tibial tubercle–TG (TT-TG) distance, and lateral patellar tilt, should be scrutinized. Some classification systems rely on a single axial MRI slice, which may capture a dysplastic region and thus misrepresent the overall extent of TD. 9 Additionally, because normal trochlear morphology transitions from flatter proximally to more concave distally, the inconsistent selection of axial levels may either exaggerate or underrepresent the presence of dysplasia. 28 The novel method proposed in this study aimed to address this issue by measuring 4 axial levels, thereby capturing most of the TG and improving reliability in selecting optimal axial MRI slices.
Grade 0 TD was significantly more common in control patients (68%) than in those with RPDs (8%) (P < .001). In other words, measurable TD was present in 92% of patients with RPDs. These findings align with previous reports indicating TD in 85% to 96% of patients with patellar instability, with the highest prevalence seen in those experiencing RPDs.10,12,19 The strong association between TD and recurrence highlights the biomechanical consequences of a flattened TG, which compromises patellofemoral stability and contributes to maltracking.5,6 The rare instance of grade 0 TD in a patient with an RPD may prompt clinicians to consider other potential contributing risk factors for recurrence, such as patella alta, an increased TT-TG distance, and lateral patellar tilt. 5
The analysis showed that patients with RPDs tended to have a greater proportion of TD located more proximally, whereas control patients demonstrated no clear pattern in the distribution of TD (Table 3). This descriptive trend highlights the importance of closely evaluating the proximal TG in which morphological abnormalities may be more apparent in patients with recurrent instability. Across axial levels, abnormal SA values appeared more frequently in the RPD group than in the control group, reinforcing the utility of the SA in characterizing trochlear morphology. The MAPS-TD builds off previous work by our group by applying established SA cutoffs to propose a clinically relevant framework for describing TD severity. 3 These findings support the use of the SA not only at a single axial level but as part of a multilevel assessment strategy to capture dysplastic features more comprehensively.
Limitations
Several limitations should be acknowledged. The present approach tends to classify a higher proportion of patients as having grade 4 TD, as elevations at one level often correlate with elevations at other levels. Nevertheless, the chosen method offers a more comprehensive assessment and may be considered more sensitive.
The <21-year age cutoff captured only pediatric patients but included both skeletally immature and mature patients. This distinction is relevant because trochlear morphology may be more modifiable in skeletally immature patients. 31 However, given that the mean age in both groups was 15 years, most skeletally immature patients were near the end of growth, limiting their remodeling potential and reducing the impact of this difference.
The present study evaluated TD in isolation, without accounting or controlling for other anatomic risk factors or their association with the recurrence of patellar dislocations. However, prior studies have consistently shown that TD is the most significant risk factor for RPDs.6,13 Furthermore, this study did not aim to develop a treatment algorithm for patellar dislocations and, as such, appropriately addressed its stated objective.
The retrospective nature of the study may introduce bias. The medical student who recorded the SA measurements, although trained and supervised, did not have the expertise of the attending orthopaedic surgeon. However, interobserver reliability with the senior author was excellent. While a consistent, single-institution knee MRI protocol was employed including the knee being presented in apparent extension, certain variables, such as knee flexion angle, patellar tendon length, quadriceps activation, and limb rotation, could not be controlled. However, as the MAPS-TD grade is based on cartilaginous assessments, accurate measurements can be made, independent of the exact knee position. 26 Future research could include prospective studies comparing treatment modalities, such as trochleoplasty versus nonoperative or alternative surgical approaches, with the recurrence of patellar dislocations as the primary outcome, stratified based on the scoring system described in this article.
Conclusion
The MAPS-TD is a novel classification system that stratifies TD severity and has demonstrated accuracy and reliability in distinguishing patients with RPDs from controls. Its primary clinical utility lies in differentiating more extensive TD (especially grade 4) from mild TD (grades 1 and 2). The MAPS-TD may help guide surgical decision-making, possibly even in identifying candidates for surgical procedures (ie, trochleoplasty) among those with grade 4 TD.
Footnotes
Final revision submitted December 5, 2025; accepted December 14, 2025.
The authors have declared that there are no conflicts of interest in the authorship and publication of this contribution. AOSSM checks author disclosures against the Open Payments Database (OPD). AOSSM has not conducted an independent investigation on the OPD and disclaims any liability or responsibility relating thereto.
Ethical approval for this study was obtained from Montefiore Einstein Medical Center (No. 2016-6534).