
Abstract
Background:
Studies on the coronal plane alignment of the knee (CPAK) classification after high tibial osteotomy (HTO) are scarce.
Purpose:
To (1) clarify the distribution of the CPAK phenotype in patients who underwent HTO and (2) compare the clinical results according to the CPAK phenotypes.
Study Design:
Case Series; Level of evidence, 4.
Methods:
Overall, 171 knees of patients with HTO were retrospectively evaluated. The primary outcome was to investigate the serial changes in the CPAK preoperatively and 2 years postoperatively. The secondary outcome was to assess the subcategories of the knee injury and osteoarthritis outcome score (KOOS) and postoperative change of KOOS according to the CPAK.
Results:
The most common pre- and postoperative CPAK phenotype types were I (62%), II (22.8%), IV (8.8%), VI (36.7%), V (18.9%), and IX (13%). The distribution of preoperative CPAK significantly changed after HTO. KOOS subscales showed no significant differences according to the CPAK phenotypes.
Conclusion:
The most common pre- and postoperative CPAK phenotypes were I and VI. No significant differences in the KOOS subscales were observed according to CPAK phenotypes following HTO.
The coronal plane alignment of the knee (CPAK) classification is a simple tool for assessing lower extremity alignment, as the CPAK phenotype is determined by measuring only the medial proximal tibial angle (MPTA) and the lateral distal femoral angle (LDFA). 10 Since initially reported by McDessi, several registries have been described in other countries.4,8,11,12,15,19,24,28
The CPAK classification has been mentioned in the literature after total knee arthroplasty (TKA) or unicompartmental knee arthroplasty (UKA).1,3,7,26 Changes in the arithmetic hip-knee-ankle (aHKA) and joint line obliquity (JLO) in CPAK classification before and after TKA results are associated with poor postoperative outcomes. 7 In robot-assisted TKA for CPAK type I osteoarthritis, kinematic alignment achieved knee balance in extension without soft tissue release in a higher percentage of patients than mechanical alignment. 1 Therefore, the alignment changes by TKA or UKA contribute to poor results. In contrast, alignment changes after high tibial osteotomy (HTO), a realignment surgery, contribute to good results. Although few reports have described CPAK classification after HTO,2,18 only radiological evaluations have been reported, with no reports on the association between clinical outcomes.
This study aimed to (1) clarify the distribution of CPAK phenotypes in patients who underwent HTO and (2) compare the clinical results according to the CPAK phenotypes.
We hypothesized that (1) the postoperative distribution of the CPAK phenotype would be significantly different from the preoperative status, and (2) the neutral alignment (CPAK type V) would yield better clinical results than the other CPAK phenotypes.
Methods
The present study was approved by our institution's ethics committee (E22-0166). Standard informed consent was obtained from all patients participating in the present study.
This was a retrospective study of patients who underwent HTO between November 2011 and December 2022. This study comprised patients who completed at least 2 years of postoperative follow-up without sequential loss of clinical or radiological evaluations. The inclusion criteria were as follows: (1) medial compartment osteoarthritis; Kellgren-Lawrence grades 2 to 4; (2) concurrent varus deformity of the lower limb; weightbearing line ratio (WBLR) <50%; and (3) cases with an acceptable alignment range at 3 months postoperatively. The exclusion criteria were as follows: (1) secondary osteoarthritis; (2) association with ligament reconstruction; (3) infection; and (4) revision of HTO.
Clinical evaluations were performed using the knee injury and osteoarthritis outcome score (KOOS) 22 preoperatively and at 2 years postoperatively. Postoperative changes in the KOOS were evaluated to detect true change.
Radiological Evaluation
Long-leg standing radiographs were obtained for all participants. The radiological parameters were measured in Digital Imaging and Communications in Medicine images using validated software (SurgiMap). Measurements of radiological parameters were taken by 2 observers (M.K. and K.Y.). Two observers evaluated 20 cases at 2-week intervals. Paley and Pfeil 20 performed the following measurements: the angle between the mechanical axis of the femur and the LDFA; the angle between the mechanical axis of the tibia and the MPTA (Figure 1). 8 Subsequently, aHKA and JLO were calculated arithmetically (Figure 2). 10 The aHKA is calculated as MPTA _ LDFA. Neutral alignment is defined as an aHKA between +2° and −2°, varus alignment as aHKA <–2°, and valgus alignment as aHKA >+2°. JLO is calculated as MPTA + LDFA, and the joint line is labeled parallel or neutral when equal to 180°. The orientation of the joint line is defined as neutral when the JLO is between 177° and 183°, apex distal when the JLO is <177°, and apex proximal when the JLO is >183°. The CPAK classification comprises 9 groups, determined by aHKA and JLO values (Figure 2).

Coronal plane alignment of the knee (CPAK) classification.
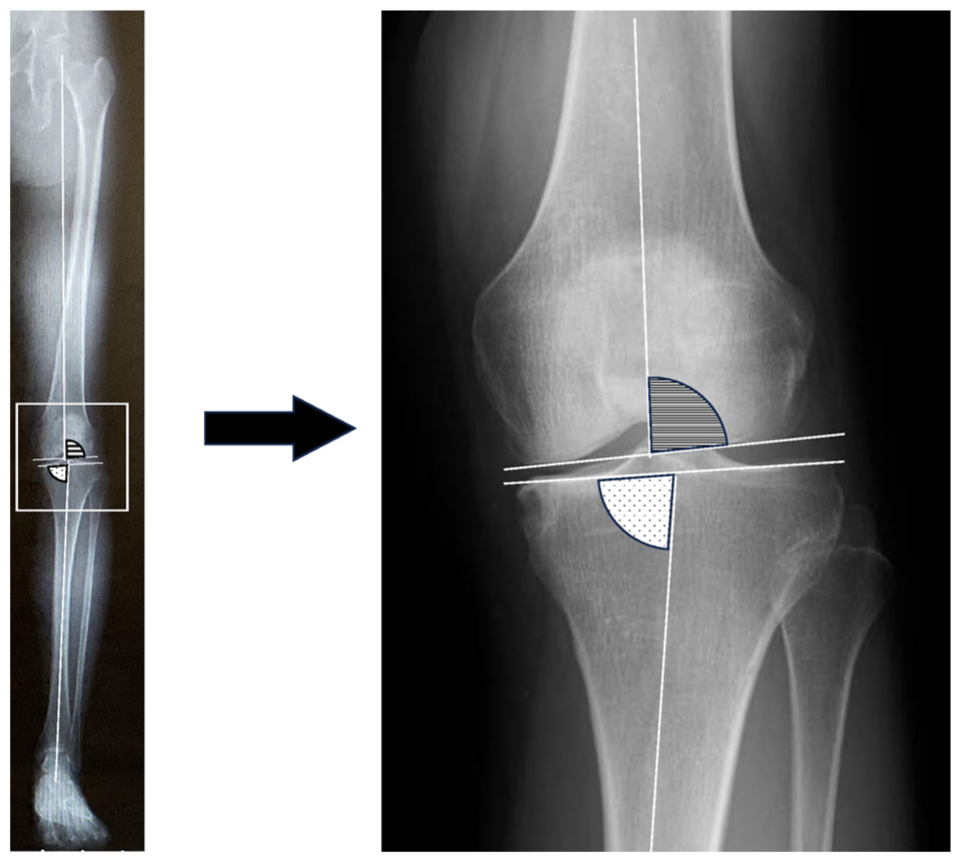
LDFA (lateral distal femoral angle) and MPTA (medial proximal tibial angle) LDFA is defined as the angle between the mechanical axis of the femur and the distal femoral joint line. MPTA is defined as the angle between the mechanical axis of the tibia and the proximal tibial joint line.
Surgical Technique and Postoperative Rehabilitation
All operations were performed or supervised by a single surgeon (M.K.). Before HTO, diagnostic arthroscopy was performed to verify the correct indication. Arthroscopic synovectomy was performed when necessary, and arthroscopic lateral release was done in all cases. Partial meniscectomy and medial meniscus centralization were performed for degenerative tears in the medial meniscus and in case of medial meniscus extrusion, respectively. 6 Abrasion chondroplasty or multiple drilling was performed using a 2.0-diameter Kirschner wire for chondral defects in the medial compartment of the knee. In contrast, autologous chondrocyte implantation was not done in this study.
Based on recommendations from the AO Foundation Expert group,21,25 biplanar osteotomy was performed in all patients. The osteotomy was stabilized using a long-type locking plate (TomoFix, Synthes; or TriS, Olympus Terumo Biomaterials). An artificial bone graft (OSferion 60; Olympus Terumo Biomaterials) was inserted into the osteotomy gap to start early weightbearing. 27 The usual target point of correction was approximately 62.5% of the WBLR, named the Fujisawa point. 5 The acceptable range of postoperative coronal alignment was defined as neutral or valgus for aHKA≥–2, based on the boundaries of the CPAK classification (Figure 2). Postoperative rehabilitation began the day after surgery, with active and passive range of motion exercises and muscle-strengthening exercises. Range of motion training was continued until a maximum flexion angle of at least 130° was obtained within 3 weeks of surgery. Standing exercises were also initiated as soon as possible. Notably, 1 week after surgery, the patients were allowed to begin half-weightbearing exercises with walker equipment, and full-weightbearing walking was allowed 2 weeks after surgery. Return to normal sports activities, including jogging, was allowed after verification of bone union at the osteotomy site. The strategy has been previously reported in the literature. 9
Statistical Analysis
The sample size was calculated using G-power 3.1.9.6 (Dυsseldorf, Germany). Based on the a priori power analysis, a minimum of 162 patients were required (α = .05; β = 0.95).
CPAK phenotype rates before and after HTO were compared using the McNemar test. Furthermore, this study investigated changes in CPAK phenotype pre- and postoperatively.
Pre- and postoperative KOOS subscales were compared across CPAK phenotypes using an analysis of variance. The intraclass correlation coefficient (ICC) was used to assess inter- and intraobserver agreement for LDFA and MPTA angle measurements. The 2-way random model was used to calculate ICCs with 95% CIs. The ICC was interpreted as follows: <0.50, poor; between 0.50 and 0.75, moderate; between 0.75 and 0.90, good; >0.90, excellent. P < .05 was considered statistically significant. The data were analyzed using SPSS Version 26.0 software (IBM Corp). Descriptive statistics were expressed as means and standard deviations for numerical variables and as numbers and percentages for categorical variables.
Results
Overall, 352 knees underwent HTO; however, some cases were excluded due to a lack of preoperative assessment (n = 1), secondary osteoarthritis (n = 5), or ligament reconstruction (n = 2) (Figure 3). Therefore, 344 knees were selected. Cases of infection (n = 3), revision of HTO (n = 3), undercorrection at postoperative 3 months (n = 13), loss of follow-up over 2 years (n = 154) were further excluded. Finally, 171 knees were included in the study (Figure 3). Among them, 68 were men, and 103 were women; the mean age was 61 ± 9.7 years, and the mean body mass index (BMI) was 26.2 ± 4 kg/m2 (Table 1). There were no significant differences between the included patients and those lost to follow-up in descriptive data (mean age: 61 vs 58 years; height: 160.3 vs 163.1 cm; weight: 67.8 vs 68.8 kg; BMI: 26.2 vs 25.8 kg/m2). There were 6 knees (3.5%) in grade 1, 66 knees (38.6%) in grade 2, 75 knees (43.9%) in grade 3, and 24 knees (14%) in grade 4, based on the Kellgren-Lawrence (KL) classification. All patients preferred osteotomy to arthroplasty because they wanted to return to sports.

Flowchart of patient selection and inclusion.
Descriptive Data a

Data are presented as mean ± SD (range) or n (%). aHKA, arithmetic hip-knee-ankle angle; BMI, body mass index; JLO, joint line obliquity; KL, Kellgren-Lawrence grade; LFDA, lateral distal femoral angle; MPTA, medial proximal tibial angle.
The mean preoperative MPTA and LDFA were 84.2°± 3° and 88.3°± 2.1°, respectively (Table 1). The mean pre- and postoperative aHKA and JLO were −4.1°± 3.3° and 172.5°± 4°, respectively. The inter- and intraobserver reliability for the measurement of radiographic parameters was satisfactory, and the mean values of LDFA and MPTA were 0.963 versus 0.950 (95% CI, 0.920 to 0.980 vs 0.894 to 0.979) and 0.968 versus 0.945 (95% CI, 0.83 to 0.92 vs 0.883 to 0.977), respectively.
The most common pre- and postoperative CPAK phenotypes were I (62%) and VI (36.7%) (Table 2). The preoperative CPAK phenotype changed mainly to CPAK type VI at 2 years postoperatively, as the postoperative MPTA increased after HTO. Significant differences were observed in the distribution of the pre- and postoperative CPAK phenotypes (P < .001). Pre- and postoperative changes of CPAK phenotypes are shown in Table 3. Almost all preoperative CPAK phenotypes changed to CPAK VI after HTO. However, CPAK IV did not change to CPAK VI; instead, it mainly changed to CPAK IX after HTO.
Comparison Between Pre- and Postoperative CPAK Phenotypes a
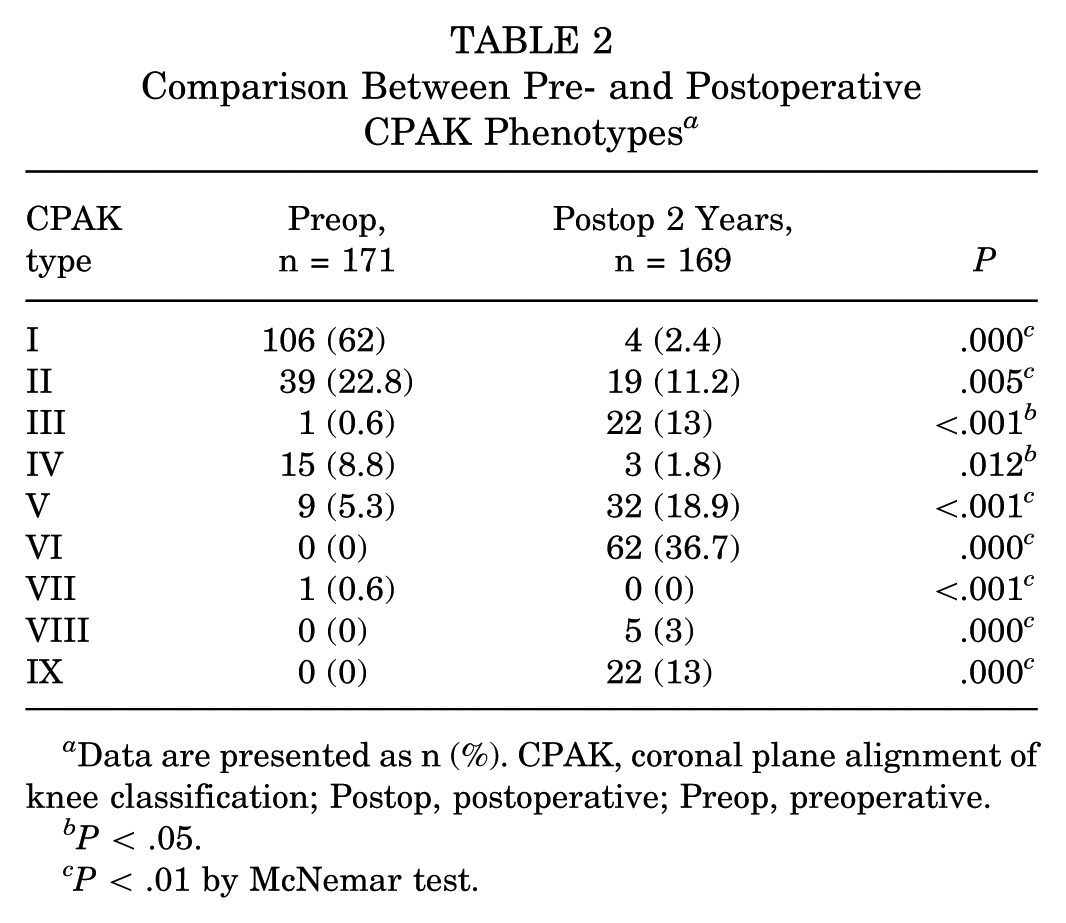
Data are presented as n (%). CPAK, coronal plane alignment of knee classification; Postop, postoperative; Preop, preoperative.
P < .05.
P < .01 by McNemar test.
Comparison of CPAK Phenotypes Between Pre- and Postoperative 2 Years a

Data are presented as n (%). CPAK, coronal plane alignment of knee classification; Postop, postoperative; Preop, preoperative.
The pre- and postoperative clinical results, stratified by CPAK phenotype, are shown in Figure 4. No significant differences were observed in the pre- or postoperative KOOS subscales among the CPAK phenotypes. However, the postoperative KOOS subscale of varus alignment (CPAK I and IV) was lower than that of the other CPAK phenotypes.
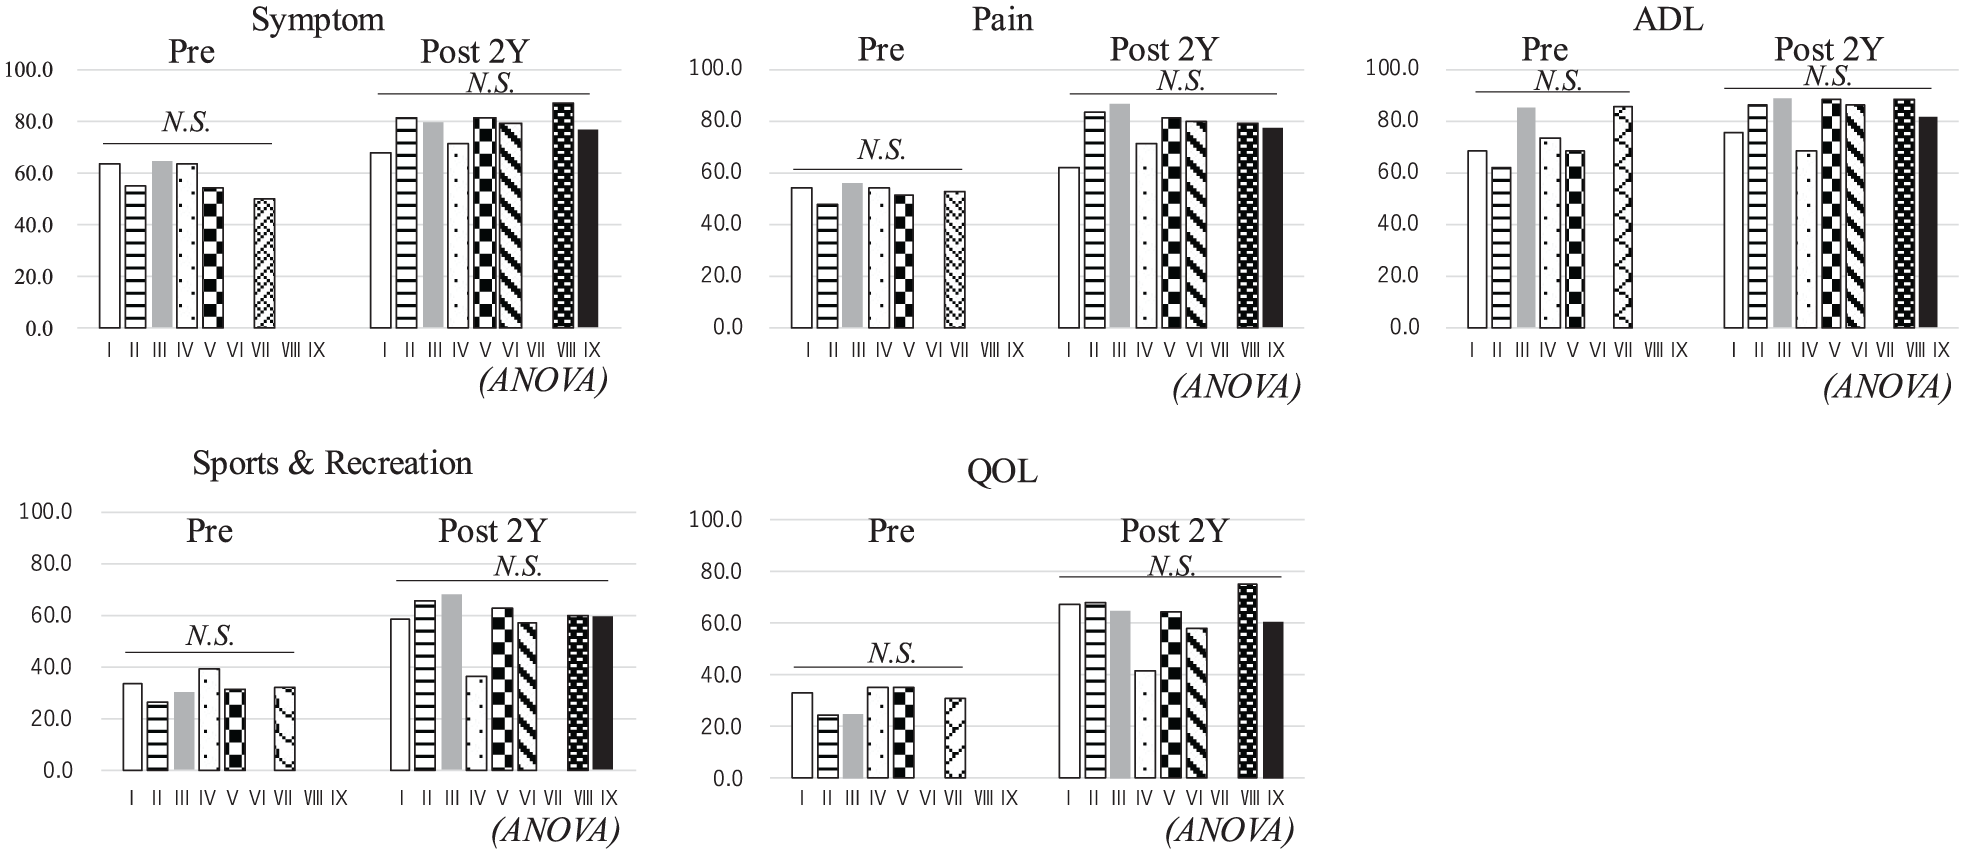
Comparison of pre- and postoperative clinical results according to the CPAK phenotype. No significant differences were observed in the preoperative or postoperative KOOS subscales among the CPAK phenotypes.
Discussion
The main findings of this study included the following: (1) the postoperative distribution of the CPAK phenotype was significantly different from the preoperative status, and (2) the clinical results of the neutral alignment (CPAK V) were not significantly better than those of the other CPAK phenotypes. Therefore, the first hypothesis was confirmed, whereas the second hypothesis was rejected.
The most common types were I (62%), II (22.8%), IV (8.8%), and VI (36.7%) for preoperative CPAK and V (18.9%) and IX (13%) for postoperative CPAK. Almost all preoperative CPAK phenotypes changed to CPAK VI after HTO. However, CPAK IV did not change to CPAK VI; instead, it mainly changed to CPAK IX after HTO. The postoperative change to CPAK IX was due to the large LDFA. CPAK IV was constructed by a large LDFA (>90°) and a small MPTA (<85°). There were severe varus alignment cases in CPAK IX. Therefore, a large correction of the MPTA is required in HTO. JLO became apex proximal (JLO >183°) because JLO was calculated by the sum of MPTA and LDFA. As a result, preoperative CPAK IV tended to progress to CPAK IX after HTO. Ryu et al. recently reported similar findings. 23 Cases with CPAK IX should undergo double-level osteotomy to maintain neutral JLO. 16
There are several registries of CPAK classification worldwide, and the characteristics of lower limb alignment vary between countries. However, only a few reports of CPAK classification after HTO are available in the literature. Mitterer et al 14 reported that postoperative CPAK classifications shifted significantly across all osteotomy types, with minimal retention of preoperative types. Although most procedures achieved correction within the target HKA range, neutral JLO restoration was observed in only half of the cases, underscoring the importance of phenotype-specific planning and the potential limitations of CPAK classification. 14 The restoration rate of a neutral JLO was 56.7% (97/171) in this study. These results are consistent with our findings. Maione et al 13 reported that the surgical correction of a medial closing-wedge distal femoral osteotomy achieved a neutral mechanical axis (CPAK V and VIII), with no clinical differences across different JLO values. The postoperative KOOS subscale of varus alignment (CPAK I and IV) was lower than that of the other CPAK phenotypes (Figure 4). However, no significant differences were detected due to the few cases of varus alignment (10/171; 5.8%) after HTO in this study (see Table 2).
This study has several limitations. First, the participants' average age (61 years) was higher than that reported in previous literature. 17 Second, there was a higher rate of advanced osteoarthritis (6 knees [3.5%] in grade 1, 66 knees [38.6%] in grade 2, 75 knees [43.9%] in grade 3, and 24 knees [14%] in grade 4, according to the KL classification). Clinical changes might be affected by age and osteoarthritic severity. Third, the dropout rate was approximately 50% (181/352). Finally, the CPAK classification is not assessed in the sagittal plane or for rotational alignment. A 3-dimensional deformation analysis should be performed to accurately assess lower extremity alignment.
Conclusion
The most common pre- and postoperative CPAK phenotypes were I and VI. No significant differences in the KOOS subscales were observed according to CPAK phenotypes after HTO.
Footnotes
Acknowledgements
The authors thank Shuko Nojiri for the statistical analysis and Ryoko Tarukawa for data management.
Final revision submitted December 20, 2025; accepted December 26, 2025.
The authors declared that they have no conflicts of interest in the authorship and publication of this contribution. AOSSM checks author disclosures against the Open Payments Database (OPD). AOSSM has not conducted an independent investigation on the OPD and disclaims any liability or responsibility relating thereto. This research was approved by the Institute Ethics Committee (E22-0166).