
Abstract
Background:
Trochlear dysplasia is important in recurrent patellofemoral instability (PFI); reliable metrics are essential to understand this condition and help define optimal treatment. One such measurement is the entry point to transition point (EP-TP) angle, which describes 2 components of patellar tracking from full knee extension to flexion: (1) mediodistal movement and (2) pure distal movement. Currently, measurement of this metric relies on 3-dimensional (3D) models.
Purpose:
To further develop the EP-TP angle metric to allow its digital measurement, to establish cohort and interrater reliability values, and to evaluate its appropriateness for clinical use.
Study Design:
Cohort study (diagnosis); Level of evidence, 3.
Methods:
A data set composed of 30 recurrent PFI patient knees and 30 control knees was acquired. Each knee came with anterior views of the distal femur and curvature maps, which highlighted relevant structures such as the trochlear groove and the medial and proximal ridge. Three raters measured EP-TP angles utilizing a digital tool with and without the curvature maps. Significance of differences in means, presence of a TP, and interrater reliability with intraclass correlation coefficients were tested and evaluated according to an established guideline (<0.5, poor reliability; >0.5-0.75, moderate; >0.75-0.9, good; >0.9 excellent reliability). A significance level of .05 corrected with the Bonferroni method was assumed.
Results:
PFI knees had a significantly higher EP-TP angle than the control cohort (48.9° ± 10.8° vs 11.8° ± 14.6°; P < .001). Patients had a greater TP prevalence than controls (96.7% vs 10.0%). Interrater reliability for the EP-TP angle with curvature maps was significantly better than without (0.84 [95% CI, 0.76-0.89] vs 0.67 [95% CI, 0.55-0.78]; P < .001).
Conclusion:
The EP-TP angle is significantly different between PFI patients and controls. This study presents a digital approach for measuring the EP-TP angle, in contrast with the initially described method, which required 3D prints. This digital approach, when aided with curvature mapping, yields better reliability.
Recurrent lateral patellofemoral instability (PFI) is a condition in which the patella deviates laterally from its typical path into the trochlear groove (TG), leading to subluxations and dislocations. A common indicator of instability is a J-sign, in which the patella moves along a path similar to an inverted letter J, 11 medializing upon knee flexion until it reaches its intended path in the center of the more distal and linear femoral trochlea.8,13 Upon knee extension, this specific movement reverses and is affected by the screw-home mechanism of external tibiofemoral rotation in the last few degrees of knee extension. This rotation leads to lateralization of the tibial tuberosity, the attachment site of the patellar tendon. As a result, the patella moves along an increasingly lateralized vector due to the pull of the patellar tendon when the knee is fully extended.12,14 In healthy knees, tibiofemoral rotation is less pronounced, 5 medial structures such as the medial patellofemoral complex are intact, there is no patella alta, and the TG resists lateralization of the patella for the full range of motion of the patella. 11 In atraumatic patellar instability, however, the trochlea is often malformed by trochlear dysplasia, limiting the constraint of the trochlea—or in severe cases, even actively pushing the patella out of its intended path due to deformities such as ridges, spurs, or convexities. 8
Traditionally, trochlear dysplasia has been evaluated independently from patellar tracking through classification of the proximal shape of the groove.8,13 Such evaluation often includes application of the Dejour classification, which classifies the proximal trochlea either as shallow, flat, or deformed by excessive with lateral convexity with and without a “cliff.” 2 A recent study analyzing the Dejour classification regarded its interrater reliability as “slight” on the Landis and Koch scale (Fleiss κ of 0.12-0.2 depending on imaging modality on a scale of poor, <0; slight, 0.00-0.20; fair, 0.21-0.40; moderate, 0.41-0.60; substantial, 0.61-0.80; and almost perfect agreement, 0.81-1.00). 6 A more recently developed, alternative approach is to consider the TG in 3 dimensions (3D) to capture not only where the patella enters but also the path it takes—leading to new metrics describing trochlear dysplasia.1,8,13 One such metric was described by Yu et al in 2022 13 : the EP to transition point (EP-TP) angle (Figure 1). The EP-TP angle describes the relative position of the trochlear EP, the TP, and the trochlear nadir. These points outline the presumed path of the patella within the TG per Yu et al. 13 It assumes that the trochlea enters the TG between the medial and lateral ridges, when the leg starts to flex from full extension. This is the EP. From there it moves distally down the TG. In PFI patients, this often happens in an oblique motion until it is constrained by the deeper trochlea around the TP and moves purely distally. 7 The greater this angle, the more oblique the patellar tracking direction is assumed to be. The use of this angle allows us to better conceptualize the information gained from 3D reconstructions and might have future clinical uses. However, the reliability of this measurement was not analyzed, and more precise definition and identification of the TP is essential to facilitate accurate measurement.

Entry point to transition point measurement is defined as the supplementary angle between 2 lines constructed between by 3 points: The entry point, defined as the midpoint between the lateral and medial ridge endpoints; the transition point, defined as where the trochlear groove flattens out (see Figure 2C); and the apex of the trochlear groove at the notch.
The purpose of this study was to further develop the EP-TP angle metric to allow its digital measurement, to establish cohort and interrater reliability values, and to evaluate its appropriateness for clinical use.
We hypothesize that there is a significant difference in EP-TP angle between patellar instability patients and controls.
Methods
Patient Selection
Anterior view sets for 60 digital 3D distal femoral models were acquired from an online repository 9 of another study. 10 Each set included both a standard anterior view of the distal femoral 3D model and 2 anterior views supplemented with multicolored curvature maps that served to highlight both small, higher curvature structures (eg, trochlear medial and lateral ridges) and large, smaller curvature structures (ie, the TG) through differences in color (Figure 2). Those curvature maps were algorithmically calculated from digital 3D models and visually overlayed on those in the study by Sieberer et al. 10 The corresponding Python script is available in the online repository. 9 Of the 60 distal femora included, 30 were from PFI patients with ≥2 dislocation events reported by the patient (age, 23.9 ± 8.4 years; female, 24; male, 6) and 30 from controls (age, 21.8 ± 5.6 years; female, 22; male, 8) with no history of patellofemoral disease. This study was deemed exempt by our institutional review board.

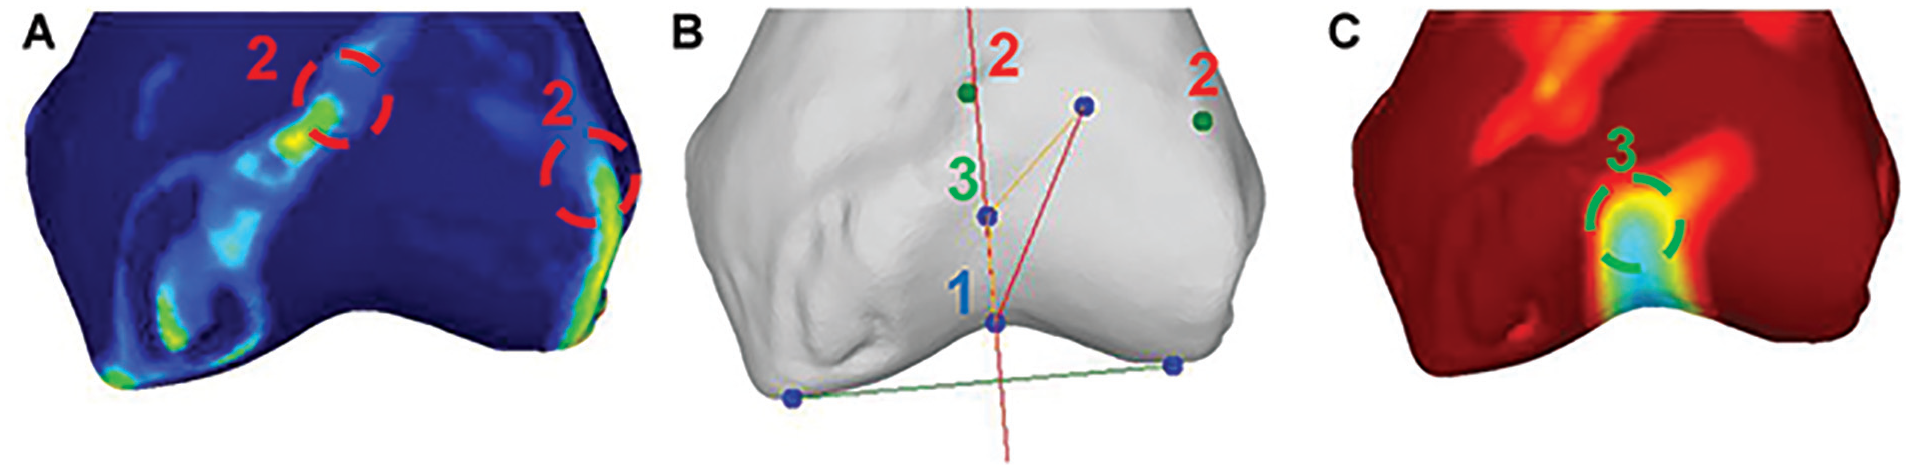
(A) Anterior view of a 3-dimensional reconstruction of a patient computed tomography scan. Anterior view of the same model with curvature-based highlighting of small-scale high curvature structures (ie, the medial and proximal ridge). (B) Anterior view highlighting large-scale structures with low curvature, such as the trochlear groove. In (C), the trochlear groove flattens out when the curvature map transitions from the cold colors to the warm colors (ie, green to yellow) proximally. The coloring should facilitate selection of the landmarks needed for entry point to transition point angle measurement.
Transition Point
The TP was defined by Yu et al 13 as the point within the TG where the direction of the groove (and, presumably, patellar tracking) transitions from an oblique orientation proximally to a more vertical orientation distally. A previous study on trochlear visualization in 3D 10 has shown that the TG in patellofemoral patients is flat proximally but deepens distally. In this paper, we assume that a flat TG is mechanically not capable of capturing the patella, whereas after the groove deepens, the patella is captured and will follow the groove direction. Therefore, in this study, we define the center of the area where the TG deepens as the TP. Together with the entry zone and EP outlined by Beitler et al, 1 a predicted patellar path can be drafted (Figure 3). If the TG is deep proximally and not curved, we deem the TP to be absent (ie, the patella stays within the TG for the full range of motion and does not transition into a different movement pattern).
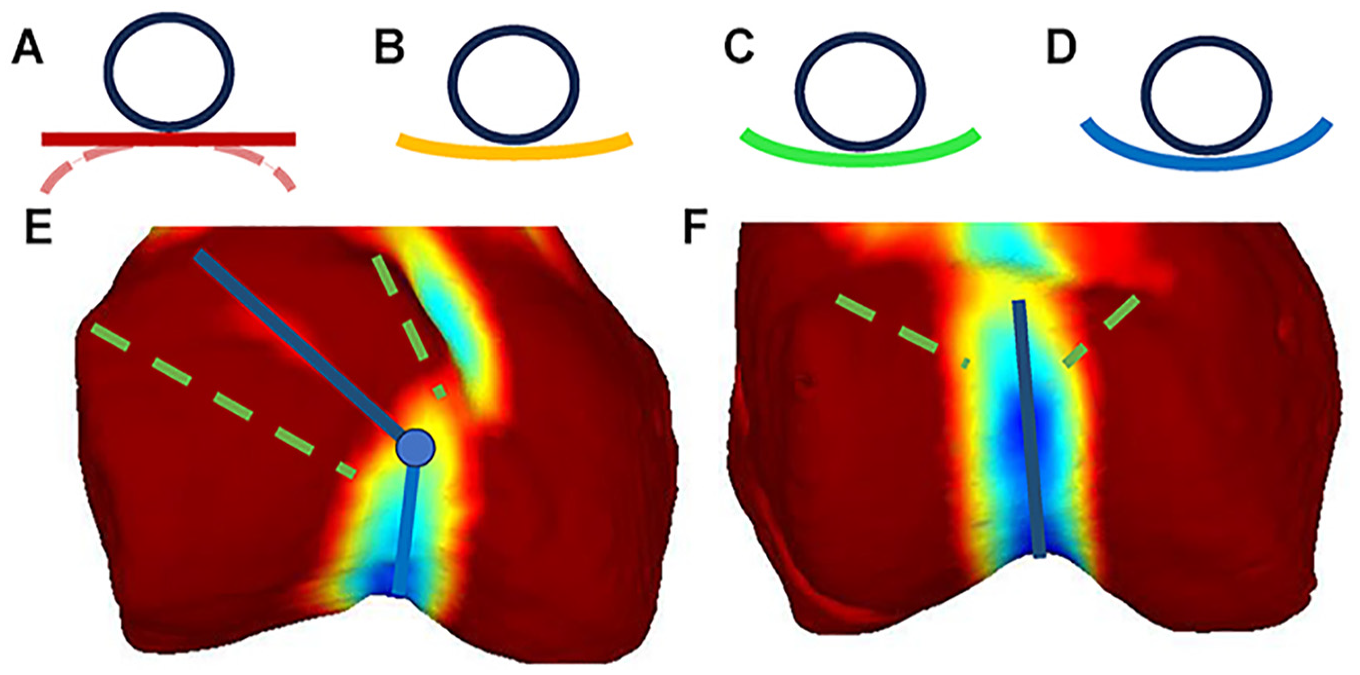
Visualization of trochlear groove curvature. Warm colors reflect flatness—(A), red, flat or convex; and cold colors concavity—(B) through (D), concave. A patella (in A-D simplified as a ball on a surface) placed on a flat or convex surface is either not stabilized or is destabilized by the underlying distal femur. By contrast, a concave trochlear groove keeps the patella within the groove. In patellar instability patients, the proximal trochlear groove is mostly flat or convex,1,10 allowing oblique patellar movement until the transition point, where movement becomes vertical: (E), blue line with transition point indicated as dot. In controls, the (F) proximal trochlea is concave, guiding the patella for the full range of flexion with no transition point. Beitler et al 1 represented the patellar entry zone using a funnel (green dashed lines), indicating which paths the patella could take between the entry zone and the transition point.
EP-TP Angle Measurement
The method to measure the EP-TP angle on anterior views was derived from the method to measure EP-TP on 3D models described by Yu et al. 13 The anterior view method was defined as follows (Figures 1 and 4):
Place a point at the apex of the TG (its distal endpoint)
Place points at the ends of the lateral and medial ridges to enable calculation of the EP, which is the midpoint between the 2 ridge end points
Place a point on the TP, where the oblique proximal TG path meets the vertical and deeper distal trochlea
Construct lines from the EP to the TP, and the TP to the TG. Calculate the supplementary angle between those 2 lines (180° minus the angle between the lines)
The measurement software as seen by the raters in the measurements with aid. The left and right images (A and C) are hidden in the measurement without aids. Raters are tasked to click on the apex of the trochlear groove (1), the proximal ends of the medial and lateral ridges (2), and the transition point (3). They are aided by multicolored curvature maps (as defined in Figure 2 and the Methods section) highlighting the relevant structures through differences in color. The measurement tool was taken as is from the data repository. 9
In healthy participants, the patella tracks more linearly and may not experience a transition within the TG. In our study, the raters classified such cases as having no TP. We defined such cases as having an EP-TP of 5°, as any TG has some slight lateral bend due to the screw-home mechanism.
EP-TP Measurement Tool and Methodology
The measurement tool provided in the online repository 9 was used. This tool allows for selection of the points (steps 1-3 as outlined above) and automatically calculates the EP-TP angle (step 4) from those. This tool and the data can be accessed by the DOI provided in the references 9 and by downloading the corresponding files. These files include screenshots of each measurement, the anterior view, the curvature maps, the code to generate the curvature maps (Python), and the measurement tool (C#). The measurement tool is executable in Microsoft Windows with installed .Net framework 4.8. To facilitate selection of the ridges and TP, the measurement tool provided multicolored curvature visualizations to aid the evaluator. To assess the need for these aids, the EP-TP angle for each knee was measured twice, once with the inclusion of curvature maps and once without. Each measurement was carried out by 3 separate raters to calculate interrater reliability. These raters were an experienced patellofemoral surgeon (J.P.F.), a postdoctoral anatomist (A.R.M.), and a doctoral researcher (J.M.S.). The postdoctoral anatomist conducted the measurements thrice for intrarater calculation. The overall measurement setup as seen by the raters is shown in Figure 4.
Statistical Analysis
A priori sample size calculation for significant differences in EP-TP was conducted with preexisting data (patients, 32.4° ± 17.1°; controls, 15.2° ± 16.2°) acquired by 1 of the authors (S.T.D.), leading to a minimal required sample size of 10 per group. Demographic differences between patients and controls were evaluated via a Mann-Whitney U test (age) and a Fisher exact test (sex ratio). Significance was assumed at .05.
Mean and standard deviation for each data set were calculated and significant differences between means evaluated with a Mann-Whitney U test. Additionally, the presence of a TP or no TP (EP-TP, 5.00°) was evaluated for each data set by a rater majority decision, and significant differences between prevalence in the 2 subsets were tested with a chi-square test. The significance level was set at .05, adjusted with the Bonferroni method. The interrater and intrarater agreement on TP detection between raters was calculated using a Fleiss kappa test and interpreted according to established literature 4 (<0 poor; 0-0.2, slight; >0.2-0.4, fair; >0.4-0.6, moderate; >0.6-0.8, substantial; and >0.8 almost perfect agreement).
Interrater reliability was calculated for each subset by using 2-way random, single-score intraclass correlation coefficients (ICCs) (ICC[A,1]) and evaluated according to an established guideline 3 (<0.5, poor reliability; 0.5-0.75, moderate; >0.75-0.9, good; >0.9 excellent reliability). Intrarater reliability was calculated by using 2-way mixed, single-score ICCs (ICC[C,1]). Significant differences between the overall ICCs of the data set with and without curvature visualization aids were analyzed using a Monte Carlo permutation test. The predictive ICC with aid was compared with the predictive ICCs of 100,000 random selection sets of either with or without aid measurements for all knees included in this study. The P value was defined as the number of sets with better ICCs than the aid ICC divided by 100,000. Significance was assumed at .05.
Results
All 60 knees and their corresponding anterior views 9 were utilized. Age and sex ratios were not significantly different between the patient and control cohorts (Table 1). Each knee’s EP-TP angle was measured once by 3 raters both with and without the visual aid provided by the curvature maps. The detailed results can be found in Table 2. Patients showed significantly higher EP-TP angles than controls, and the ICC for the measurement with curvature map visualization aid was significantly (P < .001) better than the one without for both interrater and intrarater reliability. Raters reported being faster when using the aids. The TP was significantly more prevalent in patients than in controls.
Aggregated Measurement Results for EP-TP Angles of Entire Data Set, Patients, and Controls a

Data are presented as mean ± SD or n (%), unless otherwise indicated. The EP-TP angle was significantly more prevalent in patients than in controls. EP-TP, entry point to transition point; MWU, Mann-Whitney U test; n/a, not applicable.
ICCs for Entire Data Set and Each Subset Listed With and Without Curvature Map Aid a

EP-TP, entry point to transition point; ICC, intraclass correlation coefficient.
Reliability good.
Reliability moderate to good.
Reliability poor to good.
Reliability almost perfect.
Reliability substantial.
Discussion
In this study, we (1) better defined the TP and quantified its presence in patients and controls; (2) developed a purely digital method for measuring EP-TP angle, a PFI metric that previously relied on examination of physical 3D printed bone models; (3) improved the reliability of the EP-TP angle measurement by utilizing curvature map visualization aids; and (4) established EP-TP angle cohort values for recurrent PFI dislocators and controls.
The existing method to measure EP-TP 13 angle relies on physical 3D printed bone models for the quantification of trochlear dysplasia. This has several advantages, such as providing the physician with a better spatial understanding of the complex morphology of the TG 8 ; however, the need to print the distal femur is a disadvantage that limits accessibility. To remove the need for printing, we developed a new approach, which relied instead on anterior views of purely digital 3D models. This approach also streamlined the process for point selection and automatically calculated the corresponding EP-TP angle from these points. While improving the ease of use compared with the initial methodology for calculating EP-TP angle, the new digital approach had only “moderate” predicted reliability (ICC, 0.67). This was a qualitative improvement from the “slight” reliability of the Dejour classification, 6 with the caveat that 2 different statistical methods were used to calculate interrater reliability. However, we deemed an ICC of 0.67 as too low to be used in clinical practice. Therefore, we sought to improve reliability by providing the raters with curvature information highlighting the relevant structures of the knee with different colors. This method has been described previously for the EP-TG angle and is publicly available. 9 The EP-TG angle describes the laterality of the TG entry zone as outlined by Beitler et al. 1 The inclusion of curvature-based visualization aids significantly improved the predictive ICC from “moderate” to “good” (ICC, 0.84). Even though creation of curvature maps adds an additional step to the measurement of the EP-TP angle, this step can be automated, and we assume its effect on time spent per measurement to be miniscule. Anecdotally, the raters noted that the selection of points was faster when curvature maps were provided.
Utilizing the curvature-aided approach, we found a significant difference in EP-TP angle means between recurrent dislocators and controls. While a minority of controls (10.0%) showed a TP, most dislocators had a TP (96.7%), suggesting the existence of a simple and reliable preliminary indicator of patellar instability predisposition or trochlear dysplasia even without completing the full EP-TP measurement. This pertains to the finding that the interrater reliability of the individual subgroups of 30 patients and controls each was substantially lower than the overall sample. Because of the higher variance in the full sample compared with the subgroups, this was expected. The predictive value degraded from a predictive good for the full data set to poor for patients and moderate for controls, indicating that EP-TP angle might be a good tool to separate dysplastic from nondysplastic knees but might not be adequate to truly quantify subtleties in trochlear dysplasia. The EP-TG measurement might be better suited for this purpose. 7
Limitations
In this study, we assumed that utilized controls were representative of a general population of people in which some would have trochlear aberration. Some control/population trochleae did, in fact, show signs of mild dysplasia, such as a shallow or shortened TG. This might explain the discovered presence of a TP in a minority of control/population patients.
The measurement of EP-TP is sensitive to the projected view from which it is conducted. Depending on the view, the relative position of the measurement points will change, affecting the EP-TP angle measurement. Even though the study team creating the utilized data set tried to standardize the selection of anterior views, this remains a source of error. We are not yet able to quantify the error stemming from that process.
Conclusion
The EP-TP angle was significantly different between PFI patients and controls. This study presents a digital approach for measuring the EP-TP angle, contrasting with the initially described method, which required 3D prints. This digital approach, when aided with curvature mapping, yielded better reliability.
Footnotes
Acknowledgements
We thank the Yale Department of Orthopaedics and Rehabilitation and its chair, Dr. Lisa L. Lattanza, for providing funding for this work. Additionally, we appreciate the support given by the Yale 3D Collaborative for Medical Innovation and its director, Alyssa Glennon.
Presented as a poster at the annual meeting of the AOSSM, Denver, Colorado, July 2024.
Final revision submitted February 5, 2025; accepted February 20, 2025.
One or more of the authors has declared the following potential conflict of interest or source of funding: D.H.W. has received support for education from Zimmer Biomet Holdings Inc, Smith & Nephew, lntellijoint Surgical Inc, and Stryker Corporation and consulting fees from Globus Medical Inc. J.P.F. is the president of the Patellofemoral Foundation and has received consulting fees from Linvatec Corporation and a grant from Encore Medical LP. AOSSM checks author disclosures against the Open Payments Database (OPD). AOSSM has not conducted an independent investigation on the OPD and disclaims any liability or responsibility relating thereto.
Ethical approval for this study was waived by Yale University institutional review board.