
Abstract
Background:
Bowlegs (Genu varum) are well-known leg axis deformities in adult soccer players and are associated with an increased risk of knee osteoarthritis. The time of onset of genu varum is unknown.
Purpose:
To analyze the static and dynamic leg axis in young professional soccer players from childhood to adolescence.
Study Design:
Cross-sectional study; Level of evidence, 3.
Methods:
Leg axes of 168 male professional soccer players (336 legs) from 8 age groups (U12-U21) were analyzed. Static and dynamic mechanical femorotibial axis angles (MAAs) were determined using a noninvasive motion analysis system allowing both legs to be evaluated individually. Additionally, the intercondylar and intermalleolar distances were measured. Statistical analyses were performed using a linear mixed model including the variables of age, playing position, shooting leg, and body mass index (BMI).
Results:
A significant increase in varus alignment for static and dynamic MAA was found with age. Players of the teams U17, U19, and U21 had significantly higher static MAAs (greater varus) compared with the youngest players (U12). The deviation in the dynamic MAA could be observed starting from the U15 onward. In all age groups, the dynamic MAA was significantly lower than the static MAA. No significant association was found for static or dynamic MAA with BMI, playing position, or shooting leg.
Conclusion:
In this study, the degree of static and dynamic varus alignment was significantly associated with increasing age. On the basis of the study's findings, it is believed that preventive training methods particularly focusing on vulnerable age groups should be tested for efficacy.
Bowlegs (Genu varum) are well-known leg axis deformities in adult male soccer players. 28 Soccer players have a higher prevalence of genu varum compared with nonplaying controls and with other high-activity sports.1,3,6,12,33,34 Intensive soccer training, especially in childhood and adolescence, is considered a decisive factor in developing this deformity.6,28
During infancy and early childhood, there is a transient phase of genu varum, which transitions to a knock-kneed (genu valgum) position with reaches a maximum at 3 and 4 years of age. 24 Physiological leg axis is typically reached around the age of 8 to 10 years. 32 During puberty, significant growth changes occur, with the pubertal growth spurt happening between 12 and 17 years of age. 27 Leg axis development and its influencing factors during adolescence are poorly described, and pathological deformity might be caused by asymmetrical loading on the knees. 7 The physes near the knee joint play a crucial role in leg length and axis, making them susceptible to athletic overload. 28 Genu varum shifts the mechanical axis to the medial side, increasing the load on the medial compartment of the knee and raising the risk of cartilage damage and knee joint osteoarthritis.16,17,31 There is a well-documented higher prevalence of knee osteoarthritis in former soccer players, independent of previous knee injuries.10,22 This might be linked to the increased prevalence of genu varum. 5 The progression of genu varum over time and the specific age or developmental stage at which it appears have not been clarified yet. 28 Leg axis is usually evaluated by static, radiographic analysis, but recent studies underline the importance of an additional dynamic view of leg axis conditions. Especially in the context of potential knee osteoarthritis, dynamic leg axis patterns are of particular importance. 26
Therefore, the purpose of this study was to analyze the static and dynamic leg axis in young professional soccer players from childhood to adolescence and possible influencing variables. The clinical relevance of this study is to identify vulnerable age groups for development of genu varum, so that prevention programs can be targeted to these groups in the future.
Methods
Study Population
In a cross-sectional setting, 336 leg axes of 168 young professional male soccer players were analyzed. Patients of 8 youth teams in a German professional soccer club from the age of 10 to 21 were included in the study. The data were obtained within medical checkups at the beginning of 1 season (2021). The players were divided into age groups according to their team affiliation and year of birth. This resulted in 8 age groups: U (under) 12 (10-11 years; n = 14 [28 leg axes]), U13 (11-12 years; n = 20 [40]), U14 (12-13 years; n = 21 [42]), U15 (13-14 years; n = 24 [48]), U16 (14-15 years; n = 22 [44]), U17 (15-16 years; n = 21 [42]), U19 (17-18 years; n = 22 [44]), and U21 (18-21 years; n = 24 [48]). Age, weight, height, body mass index (BMI), playing position, and shooting/supporting leg were recorded for each player. The playing position was categorized into goalkeepers, left/right/central defenders, left/right/central midfielders, and forwards. One player who underwent realignment osteotomy was excluded from the study.
This study was approved by the local ethics committee and conducted in accordance with the ethical standards laid out by the 1964 Declaration of Helsinki.
Leg Axis Measurements
Determination of leg axis alignment was performed using a camera-based posture and gait analysis system (DIERS leg axis posterior; DIERS International GmbH). Two-dimensional video documentation of the leg axis geometry in the coronal plane was recorded with a camera unit from an orthogonal posterior view of the patients standing in neutral position and barefoot, wearing only underwear. Five reflective markers were placed on the skin on defined anatomic landmarks on the backside of each leg (top and bottom edge of the calcaneus, intersection point of the 2 muscle bellies of the gastrocnemius muscle, the middle of the flexion crease of the popliteal fossa, and in the center below the gluteal fold). 8 As shown in Figure 1, the connecting lines of markers 2, 4, and 5 represent the mechanical leg axis of the femur (4, 5) and tibia (2, 4). The mechanical femorotibial axis angle (MAA) was measured between the mechanical axis of the femur and tibia and represents leg axis alignment for each leg (Figure 2). 18 Malalignment was defined as variances in the mechanical leg axis of 180° with positive MAA values for genu varum and negative MAA values for genu valgum. 25 With this analysis method, the MAA was measured under static and dynamic conditions. Dynamic measurements were performed on a treadmill at a speed of 5 km/h during the supporting leg phase. The measurement of static and dynamic leg axis using this motion analysis system was recently validated in comparison with long-standing-leg radiograph. 18 After each measurement, the results were checked for accuracy, and invalid measurements were excluded (static data, n = 1; dynamic data, n = 9). In addition, the intercondylar (IC) and intermalleolar (IM) distances (ICD and IMD, respectively) of the static leg axis were recorded as previously described using a centimeter tape measure, with the patient standing upright with either the ankles or the condyles touching. 29 The IC and IM distance was given with positive values for ICD and negative values for IMD. 33 All measurements were performed by a single examiner (F.S.).

Illustration of camera-based analysis system: 2-dimensional video documentation of leg axis geometry (DIERS leg axis posterior). Defined landmarks include the bottom (1) and top (2) edge of the calcaneus, intersection point of the 2 muscle bellies of the gastrocnemius muscle (3), the middle of the flexion crease of the popliteal fossa (4), and in the center below the gluteal fold (5).

Visualization of the mechanical leg axis and the mechanical femorotibial axis angle (MAA) under (A) static and (B) dynamic conditions. The MAA is formed between the mechanical axis of the femur and tibia as variances in the mechanical leg axis of 180°. (A) Left static MAA is 7°, and right static MAA is 10°.
Statistical Analysis
The data were analyzed using SPSS Version 28.0 (SPSS Inc). Descriptive statistics (mean and standard deviation) of static and dynamic MAA and IC/IMD were computed separately for the different age groups. To assess correlation between the static MAA values measured by the camera-based analysis system and the ICD and IMD, the Pearson correlation coefficient was used. Two linear mixed models were performed to assess the association between the dependent variables of static MAA and dynamic MAA with the independent-variable age group. These models were further adjusted for BMI, playing position, and shooting leg. For all variables, parameter estimates together with 95% CIs are presented. In all tests, a P value <.05 was considered statistically significant.
Results
Static Leg Axis Alignment
In total, the static data of 332 leg axes were included in the study. Static MAA values were higher in older age groups (Table 1). The younger age groups (U12, U13, and U14) showed similar, nearly straight-leg axis with low MAA values (1.39°± 2.2°, 1.7°± 2.83°, 1.2°± 2.9°). From the age group of U15 onward, static MAA values were higher with a maximum of 6.4°± 3.61° varus alignment in the oldest age group (U21) (Table 1 and Figure 3). On average, the IC/IMD was 1.08 ± 2.71 cm with highest values (2.21 ± 2.55 cm) in the oldest group (U21) and lowest values (–0.56 ± 2.25 cm) in the youngest group (U12) (Table 1). Values of MAA measured by the camera-based analysis system DIERS strongly correlated with the IC/IMD (r = 0.73; P < .001).
Means and SDs of Static and Dynamic Leg Axis Alignment by Age Group and Measurement Method a
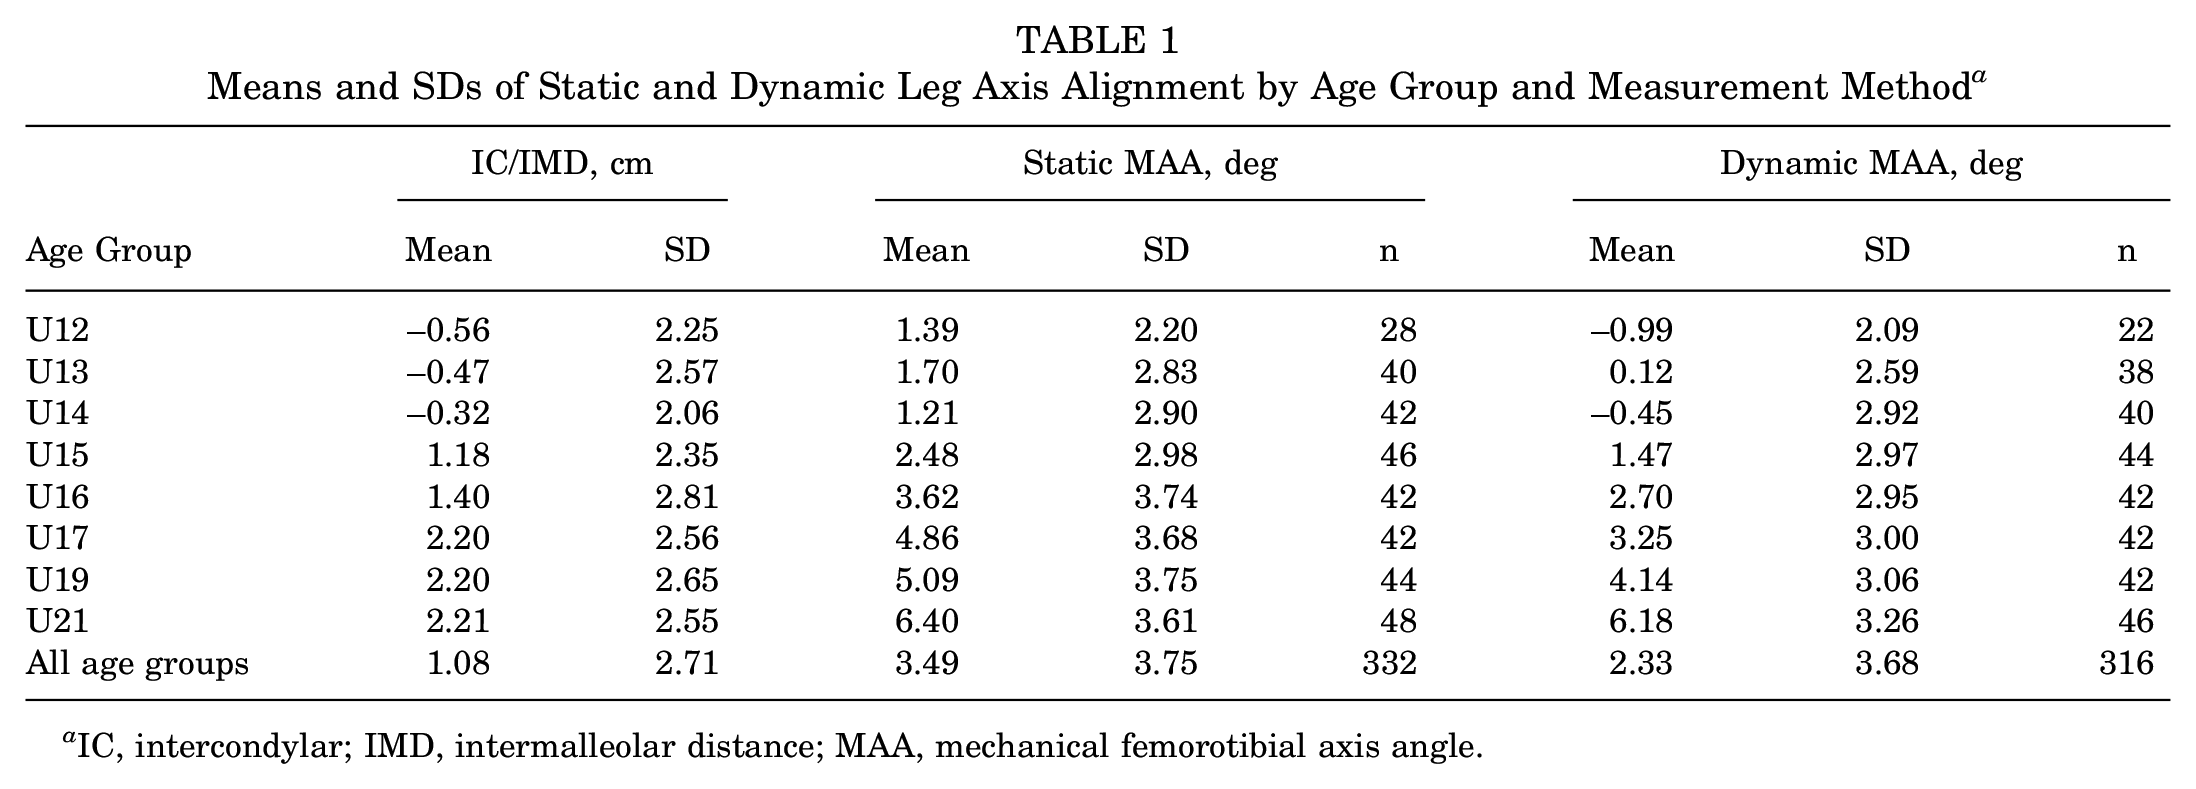
IC, intercondylar; IMD, intermalleolar distance; MAA, mechanical femorotibial axis angle.

Means and SDs of static and dynamic mechanical femorotibial axis angle (MAA) by age group ascertained by camera-based analysis system (DIERS leg axis posterior). Positive MAA values indicate genu varum, and negative MAA values indicate genu valgum.
Dynamic Leg Axis Alignment
The dynamic data of 316 leg axes were analyzed. Dynamic MAA values as well were higher in older age groups (Table 1). Dynamic MAA values of the age group U12, U13, and U14 indicate almost straight or a slight valgic dynamic leg axis (–0.99°± 2.09°, 0.12°± 2.59°, –0.45°± 2.92°). From the U15 age group onward, the dynamic MAA was positive and higher in each age group with the maximal dynamic varus alignment in the U21 age group (6.18°± 3.26°). Total dynamic MAA was lower (2.33°± 3.68°) than total static MAA (3.49°± 3.75°) (P < .001); and for all age groups, the dynamic MAA was lower than their static MAA (Table 1 and Figure 3).
Linear Mixed Model
The linear mixed models revealed a significant positive association of age with static MAA (P = .01) and with dynamic MAA (P < .001). No significant associations were found for static or dynamic MAA with shooting/supporting leg, BMI, or playing position (Table 2).
Overall Effects of the Associations of Static and Dynamic MAA With Age Group, BMI, Shooting Leg, and Position a

BMI, body mass index; MAA, mechanical femorotibial axis angle; n/a, not applicable; PE, parameter estimate.
Age Group Comparison
Comparison of the age group with the linear mixed model revealed that static MAA values of the different age groups differed significantly from each other (Table 3). Players of the age group U17, U19, and U21 had significantly higher static MAAs compared with the youngest players (U12). Inversely, all players of the teams U16, U15, U14, U13, and U12 had significantly less static MAA compared with the oldest (U21). There was a steady increase in static MAA with players in the U21 age group, having on average 4.46° (95% CI, 1.672°-7.238°; P = .002) higher static MAA values compared with the U12 (Table 3).
Age Group Comparison of Static and Dynamic MAA in Comparison With the Youngest and Oldest Age Group With PEs, 95% CIs, and P Values a
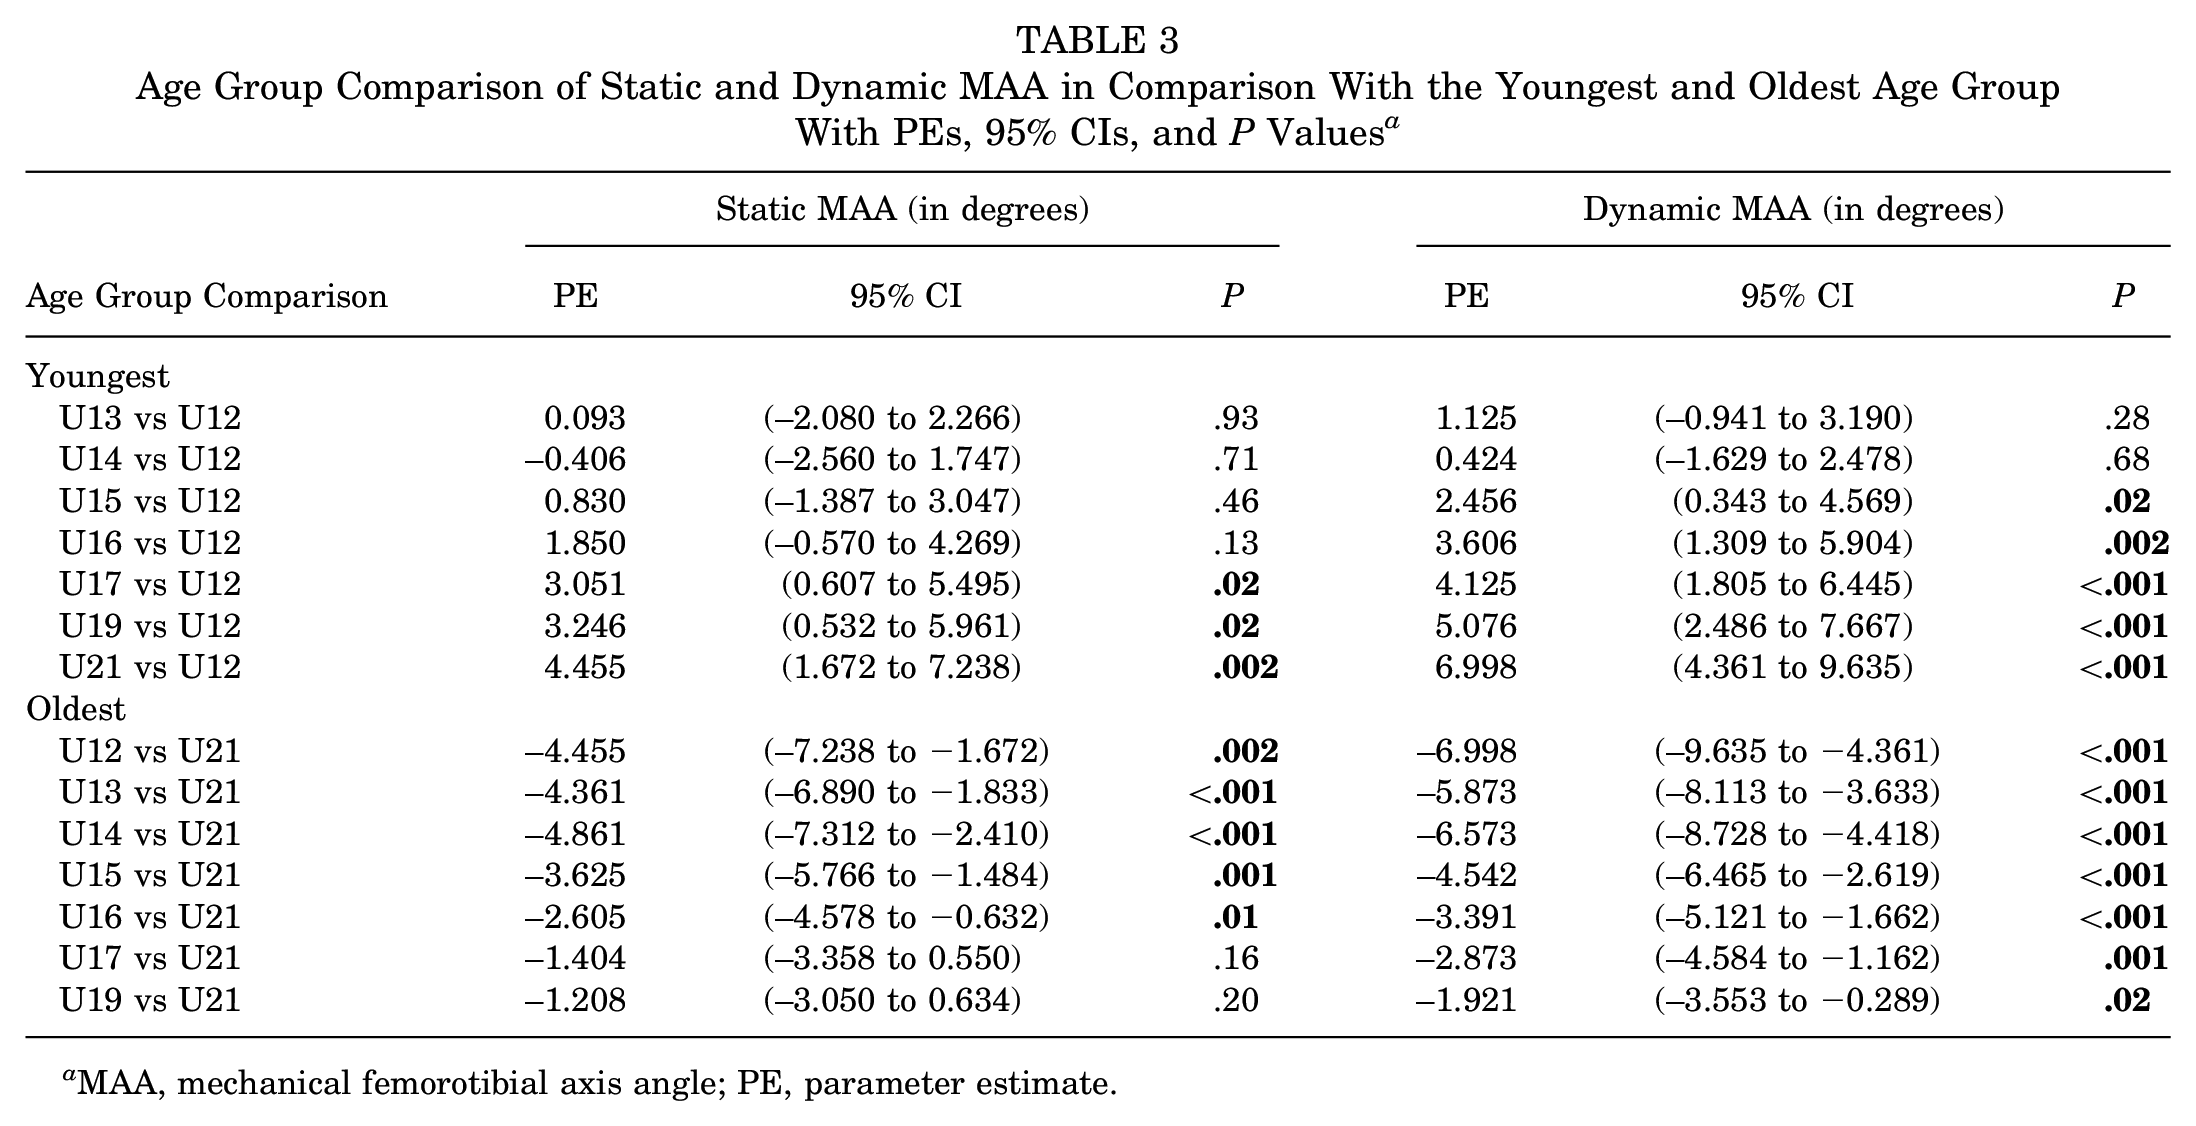
MAA, mechanical femorotibial axis angle; PE, parameter estimate.
In the dynamic MAA, the significant age-associated deviations could already be observed starting from the U15 onward compared with the youngest age group (U12). All age groups differed significantly from the U21 age group in terms of the dynamic MAA. Again, an age-dependent increase could be found. U21 players had 7° (95% CI, 4.361°-9.635°; P < .001) higher dynamic MAA values compared with the youngest U12 players (Table 3).
Discussion
The most important findings of this study are the differences in varus alignment in young professional soccer players with a significant increase of MAA, indicating greater varus alignment, starting at the age of 14 to 16. Furthermore, this is the first study proving the presence of varus alignment not only under static but also under dynamic conditions.
In this study, the degree of static and dynamic varus alignment was significantly associated with increasing age. From the age group of U17 and older, the static MAA differed significantly from the youngest players. Under dynamic conditions, a significant increase of 2.5° varus alignment could already be observed at the age group of U15. There are few studies that have examined the relationship between age and varus alignment, only using static evaluation as well as leg axis determination via distance measurements (ICD/ICM) for both legs. In a study by Asadi et al, 3 the highest degree of genu varum (ICD) in young professional soccer players was found between 16-18 years of age. In another study by Witvrouw et al, 33 the ICD was significantly higher in 14- to 18-year-old soccer players compared with the younger age groups. Also, soccer players differed significantly from non–soccer players from ≥16 years of age. Isin and Melekoğlu noted a significant increase in genu varum values from the age of 14 years in young soccer players. 12 One study from Colyn et al 6 used long-leg radiography as a measurement tool, and a retrospective questionnaire concluded that practicing high-activity sports (including soccer) during adolescence was connected with varus alignment at the end of growth. The age-dependent progression of varus deformity in young professional soccer players cannot be conclusively proven by our results. Nevertheless, our findings showed a significant association between static and dynamic varus with increasing age. On the basis of our results, we believe that special attention should be paid to the time around the transition from U15 to U17 soccer players. With the pubertal growth spurt in males happening around the time between 12 and 17 years, marking a stage of quick changes in leg length and higher risk for growth-related injuries, this age group seems to be potentially vulnerable to malalignment.15,27 Some studies hypothesize that there is a potential influence between the cumulative years of soccer and high-level soccer training during the second growth spurt on varus alignment.6,12,30 The most discussed pathomechanisms in these cases are muscular imbalance and asymmetric overloading of the growth plates of the knee. 28 In this case, a difference between the shooting and supporting leg would be expected. Our results, similar to those of Colyn et al, showed no significant difference between the shooting and supporting leg, therefore questioning a shooting-specific influence in this context. 6 Still, high-level soccer training usually includes a 2-footed approach. Therefore, the actual load difference between the shooting and supporting leg could be smaller than estimated. Additionally, soccer-specific sharp turns could be another influencing factor, leading to an even distribution of load bearing on both knee joints.4,13
This study demonstrates not only static varus alignment but also its presence under dynamic conditions. It is, to our knowledge, the first study to show these results independently in both knees in this context under dynamic conditions. Dynamic varus alignment is of high clinical relevance, as an existing genu varum increases the external adduction moment of the knee, which is a predictor for the progression of medial knee osteoarthritis.2,20 The results of this study showed a lower dynamic MAA in all age groups compared with their static MAA. The difference between static and dynamic values was greater in younger players and almost the same in older players. One reason could be stronger muscular forces of hamstring and quadriceps muscle acting on the knee joint and, therefore, a more stable leg axis in the older players under dynamic conditions, leading to less dynamic valgization. 14 Also, differences in ligament stability and possible related varus thrust might influence this observed phenomenon. 19 Furthermore, the initial static leg axis in the older age groups, being more varus, could be a limitational factor for a dynamic knee valgus, which, conversely, implies a higher varus load during motion and, therefore, a potentially greater risk for knee osteoarthritis. In a systematic review by Petrillo et al, 23 the prevalence of radiographic knee osteoarthritis among former professional soccer players was 53.7%, compared with 31.9% in the control groups. Male ex–soccer players exhibit a prevalence of knee osteoarthritis that is twice as high, and they are 3 times more likely to require knee replacement surgery than men in the general population. 9 While soccer-related injuries are considered the primary risk factor for knee osteoarthritis in this population, knee malalignment has also been identified as a contributing factor and might explain the 2.7-fold risk of knee osteoarthritis independent of previous knee injuries.9,10,21
Limitations
The limitations of this study include the neglect of rotational movements in a 2-dimensional setting for dynamic evaluation of the leg axis. Still, the camera-based analysis system used was recently validated by showing a strong correlation with the radiographic gold standard of leg axis determination. 18 Furthermore, a potential selection bias cannot be ruled out. It might be possible that players with a varus alignment are better soccer players, leading to a selective advantage and thus an age-dependent increase on a high playing level independent of, or as an additional factor in, soccer-specific load bearing on the knees. 34 Because the design of this study is cross-sectional and no control group was utilized, causal conclusions cannot be drawn. Another limitation of our study is that measurements were performed by a single examiner. While this can be seen as an advantage, it could also lead to a systematic bias because of the potential inaccuracies of a single examiner. Furthermore, differences in knee alignment might be influenced by ethnicity, which was not evaluated in our study. 11
Conclusion
In conclusion, the present study demonstrates that the degree of static and dynamic varus alignment was significantly associated with increasing age. The results of this study prove this not only in a static, but also a dynamic, setting. Therefore, we believe that preventive training methods focusing on vulnerable age groups should be tested for efficacy.
Footnotes
Acknowledgements
We would like to thank Ms. Anna Suling of the Institute for Medical Biometry and Epidemiology of Hamburg for her statistical advice.
Final revision submitted October 30, 2024; accepted November 27, 2024.
The authors declared that there are no conflicts of interest in the authorship and publication of this contribution. AOSSM checks author disclosures against the Open Payments Database (OPD). AOSSM has not conducted an independent investigation on the OPD and disclaims any liability or responsibility relating thereto.
Ethical approval for this study was obtained from Arztekammer Hamburg (2021-100686-BO-ff).