
Abstract
Background:
Novel noninvasive imaging modalities such as quantitative magnetic resonance imaging (qMRI) and shear wave elastography (SWE) allow for assessment of soft tissue microstructure and composition, which ultimately may be associated with functional and material properties.
Purpose:
To provide a narrative review of the scientific techniques and clinical applications of qMRI and SWE for the evaluation of soft tissue about the knee and shoulder, including the meniscus, the anterior cruciate ligament (ACL), and the rotator cuff.
Study Design:
Review.
Methods:
A literature search was performed in October 2022 via PubMed using the following keywords: “quantitative MRI tendon,” quantitative MRI ligament,”“quantitative MRI cartilage,” or “shear wave elastography tendon.” Only articles related to clinical applications were included in this review.
Results:
Conventional imaging techniques, including standard morphologic magnetic resonance imaging (MRI) and ultrasound imaging, have limited ability to evaluate the material and functional properties of soft tissue; qMRI builds on the limitations of conventional morphologic MRI by allowing for detection of early articular cartilage changes, differentiation of healed versus unhealed meniscal tissue, and quantification of ACL graft maturity. SWE can evaluate the material properties of rotator cuff and Achilles tendons after injury, which may provide insight into both the chronicity and the healing status of the aforementioned injuries.
Conclusion:
Our review of the literature showed that quantitative imaging techniques, including qMRI and SWE, may both improve early detection of pathology and aid in comprehensive evaluation after treatment.
The rate of utilization of musculoskeletal imaging, including magnetic resonance imaging (MRI) and ultrasound, is increasing annually in the United States. 104 From 2000 to 2016, the utilization rate of MRI and ultrasound in the United States increased from 16 per 1000 person-years to 64 per 1000 person-years and 177 per 1000 person-years to 347 per 1000 person-years, respectively. 104 Conventional noninvasive clinical imaging techniques such as MRI and ultrasound provide important information regarding soft tissue morphology and integrity, but they do not provide information about material properties and associated functions of the imaged structures. Newer advanced imaging techniques, including quantitative MRI (qMRI) and shear wave elastography (SWE), may allow for an improved assessment of the structural, material, and functional properties of orthopaedic soft tissues. These technologies may permit earlier detection of different pathologies, including osteoarthritis and tendonitis. Moreover, qMRI and SWE can be obtained postoperatively in order to provide additional detail to structures not well visualized by conventional musculoskeletal imaging, such as a healing meniscal tissue status after repair or a healing anterior cruciate ligament (ACL) graft. The ability to determine tissue material properties in conjunction with imaging of tissue structure may permit improved insight into the results of soft tissue reconstruction and contribute to the advancement of musculoskeletal care.
The purpose of this narrative review was to describe the scientific techniques and clinical applications of qMRI and SWE for the evaluation of soft tissues about the knee and shoulder, including the meniscus, the ACL, and the rotator cuff. We examined the limitations of conventional imaging and the current state of use and limitations of qMRI and SWE.
Methods
A literature search was performed in October 2022 via PubMed using the following keywords: “quantitative MRI tendon,” quantitative MRI ligament,”“quantitative MRI cartilage,” or “shear wave elastography tendon.” Articles related to clinical applications of qMRI or SWE were included in the review. We included cohort studies, systematic reviews, narrative reviews, book chapters, and randomized controlled trials; editorials and technique papers were excluded.
Results
Quantitative MRI
Limitations of Conventional MRI
Conventional MRI of dense fibrous connective tissues such as ligaments and tendons commonly uses proton density–weighted or T2-weighted images, 47 allowing for a static assessment of soft tissue morphology and integrity, and is effective in identifying the presence of tendinous and ligamentous injury such as ACL rupture 93 and rotator cuff tear, 69 as well as assessment of fibrocartilaginous tissues such as meniscus. 92 A limitation of standard clinical MRI is that tissues with a high degree of structural organization, such as ligaments, tendons, and menisci, have a very short transverse relaxation time constant (T2), resulting in minimal signal intensity in generated images. 91 T2 is the rate of signal decay after excitation of protons within the tissue being imaged.23,112 The T2 value of a structure is the amount of time needed to decrease the signal to 37% of its maximum value. 85
A primary indication of structural abnormality is the presence of increased signal within the imaged tissue, which indicates the presence of disruption, inflammation, or edema. 91 As a result, it may be challenging when using conventional MRI to identify a healed meniscal tear, 109 to evaluate early stages of cartilage degeneration, 75 or to assess ACL graft maturation. 70
qMRI for Ligament and Tendon
The qMRI technique of ultrashort echo-time (UTE) imaging may be used as an adjunct to standard morphologic imaging. UTE imaging is capable of rapidly acquiring images, and it permits improved visualization of tissues that have short T2 values due to restricted mobility of water molecules in a dense extracellular matrix. 90 Anatomic regions, including the deep zone of articular cartilage, menisci, and the annulus fibrosis of intervertebral discs, have regionally short T2 values and are not well visualized on conventional MRI but are made visible using a UTE sequence. 8 Further, UTE has been used to differentiate healed versus unhealed meniscal tissue, to identify early cartilage degeneration, and to quantify tissue properties such as ACL graft maturation. 8 A UTE pulse sequence permits image acquisition with echo times as short as 0.01 ms 91 and extends the dynamic range of generated images, allowing for improved visualization of tissues such as tendons, ligaments, menisci, periostea, and cortical bone, as compared with conventional morphologic MRI.61,91 When numerous echo images are acquired, T2 values can be calculated on a voxel-by-voxel basis to generate T2 maps, which can provide quantitative information about tissue structure, including local collagen fibril organization and the water content.42,74,77
The qMRI technique of T1-rho (T1ρ) mapping may also be performed and is considered complementary to T2 mapping. T1ρ values reflect proteoglycan content of the tissue 3 and are most commonly used for evaluation of articular cartilage. The T1ρ time constant has been associated with the proteoglycan content of articular cartilage in enzymatically degraded tissues.3,35,88 T1ρ sequences may be more sensitive to early changes in cartilage compared with T2 sequences due to the increased dynamic range of T1ρ imaging. 18 T1ρ sequences have also demonstrated improved signal-to-noise ratios compared with T2 sequences, as shown in prior in vivo human articular cartilage studies.34,89
Numerous applications of qMRI have been utilized in orthopaedic surgery, including the evaluation of ACL graft maturation,15,27 meniscal healing, 37 detection of early articular cartilage degeneration, 116 and evaluation of various tendinopathies involving the rotator cuff, 7 gluteus medius/gluteus minimus, 29 Achilles tendon, 55 and patellar tendon. 58 Similar to morphologic MRI, qMRI may be performed on scanners of various field strengths (1.5 T, 3.0 T, or higher).
ACL Graft Maturation
ACL graft maturity has traditionally been evaluated by calculating a signal-to-noise quotient (SNQ). The SNQ is derived from the mean signal intensity from a region of interest (ROI) placed on the ACL graft compared with the mean signal intensity from an ROI located in the image background outside of displayed anatomic structures68,126 (Figure 1). Using this technique, previous investigators found an association of lower SNQs with a decrease in water content, a decrease in vascularity, and presumed increased graft maturity.72,115,122 Ye et al 122 found that the addition of lateral extra-articular tenodesis to ACL reconstruction (ACLR) was associated with improved graft maturity, based on lower SNQ values, 2 years postoperatively. However, previous studies have shown that SNQs from conventional MRI have limited ability to predict the structural and functional properties of an ACL graft after ACLR, including graft integrity, knee laxity on physical examination, and biomechanical properties.98,113 A recent systematic review showed that SNQs were not reliable in either the evaluation of graft maturity or the prediction of clinical and functional outcome scores after ACLR. 111

The mean of 3 regions of interest (large circles) along an ACL graft is divided by the signal of the PCL at its insertion onto the tibia (small circle) in order to calculate the signal-to-noise quotient of the ACL graft. ACL, anterior cruciate ligament; PCL, posterior cruciate ligament.
In an attempt to gain insight into the biomechanical properties of the ACL graft, Weiler et al 115 compared ACL graft SNQ on conventional morphologic MRI with contrast-enhanced MRI in sheep after ACLR. The authors found that SNQs from the contrast-enhanced MRI had stronger correlation with biomechanical properties, including load to failure, stiffness, and tensile strength, as compared with conventional MRI.
Although the addition of a contrast agent to conventional MRI may allow improved correlation between SNQ values and associated structural properties, the use of conventional MRI, both with and without contrast, has notable limitations its ability to evaluate ACL graft maturity. First, the signal intensity in the generated images can vary by manufacturer, magnet type, or acquisition protocol. 31 Therefore, using signal intensity measurements alone without a means to normalize the signal results in values that are magnet- and institution-dependent, thus limiting the reliability and accuracy of such measurements.
The qMRI acquisitions are created based on the same MRI physics utilized for creating conventional morphologic MRI scans. As described above, T2-weighted images are commonly used to assess morphology and integrity and are acquired at a specific echo time (TE). Specific to T2 mapping, numerous images at different TEs are acquired the same slice location, and then T2 values are calculated by fitting the signal intensity to the corresponding TE assuming a model of signal decay: SI(TE) = M0×exp(–TE/T2), where SI(TE) is the signal intensity of an individual pixel at the specific echo time, M0 is the apparent proton density, and T2 is the transverse relaxation time constant. This calculation is performed on each pixel in the image or within an ROI defined by an examiner. While T2-weighted images provide information as related to general morphology, the subsequently calculated T2 values are shown as a color map on top of the morphologic image, indicating local collagen fibril organization and water content (Figure 2).42,74,77

Conventional T2-weighted morphologic sagittal knee magnetic resonance imaging (left) as compared to a T2 map (right). Note the nonuniformity of the T2 map displays a gradient of T2 values from the deep zone of articular cartilage.
T2* (T2 star) relaxation times display good intraobserver repeatability (intraclass correlation coefficient, 0.80-0.97) and good intersession repeatability (8% error). 117 Previous studies have found that T2* relaxation times can predict structural properties of a healing ACL graft, including tensile load to failure, 12 and these values correlate with graft maturity on histologic scoring 16 in porcine models.
Biercevicz et al14,15 compared ACL graft volume, signal intensity, and T2* values from qMRI with structural properties of the healing graft, including stiffness, maximum load, yield load, and degree of ligamentization in a porcine ACLR model. The authors found that T2* values predicted structural properties of the healing ACL grafts. A follow-up study 13 found that quantitative measurements of ACL graft volume and signal intensity using 3-dimensional MRI can predict postoperative functional outcome measures, including the single-leg hop test and Knee injury and Osteoarthritis Outcome Scores 5 years after ACLR in humans.
Chu and Williams 26 used UTE-T2* acquisitions and the derived T2* maps to evaluate ACL graft maturity for ≤2 years after ACLR in humans. They found that the greatest change in T2* values occurred in the first 6 months postoperatively. The T2* values were stable between 6 months and 1 year postoperative and decreased between 1 year and 2 years postoperatively, suggesting progressive graft maturation (Figure 3). The evolution of T2* values at each time point corresponded to the time course of the histological changes seen in the ACL graft as it undergoes the process of biologic incorporation and “ligamentization,” as described in previous studies.1,96
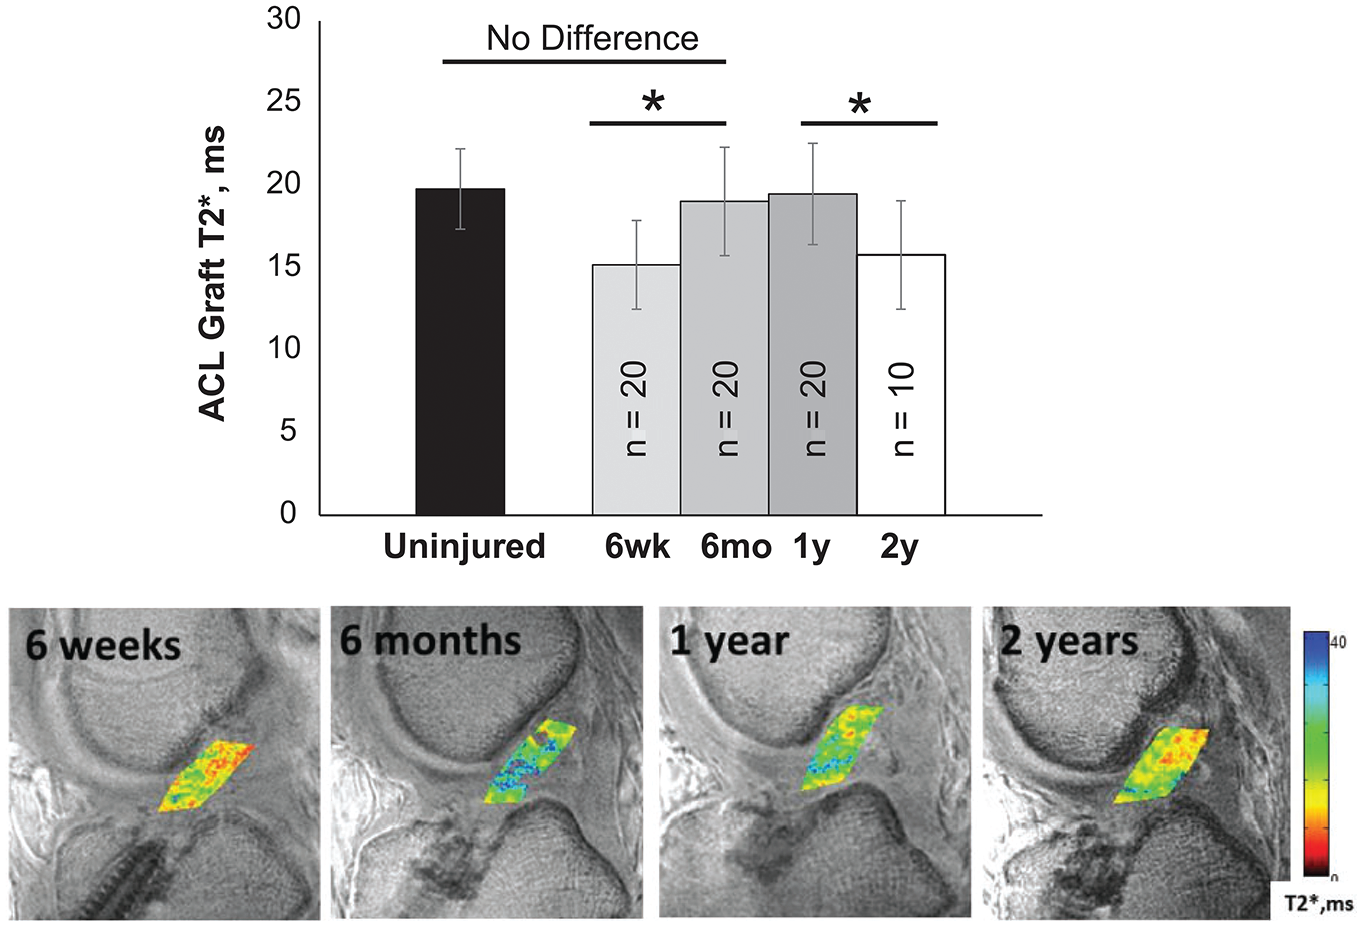
T2* values increase from 6 weeks to 6 months, stabilize from 6 months to 1 year, and decrease from 1 year to 2 years after anterior cruciate ligament (ACL) reconstruction. Bottom image shows progressive maturation of the ACL graft from 6 weeks to 2 years postoperatively through the display of T2* values of the graft material. Yellow and red colors indicate shorter T2* values, suggestive of increased graft maturity. Image reprinted from Chu and Williams 26 (2019) with permission from SAGE Publications. *in bar chart indicates p < 0.05.
Articular Cartilage
Conventional MRI may use T1 fat-suppressed gradient echo sequences and 2-dimensional fast spin echo sequences to distinguish bone from cartilage; however, there is poor differentiation between articular cartilage and joint fluid 110 and cartilage is displayed with uniform signal intensity using this technique. 41 Fast spin-echo imaging using a moderate echo time (30-34 ms) has been shown to have a sensitivity of 87%, a specificity of 97%, and an accuracy of 92% with minimal interobserver variability (kappa = 50.9) in the detection of cartilage lesions as compared with arthroscopic examination. 87 Although conventional MRI can identify full-thickness cartilage defects, actively delaminating cartilage, and differentiate chondral shear fractures from osteochondral fractures, conventional imaging cannot reliably detect early changes in the deep and calcified zones, the 2 deepest layers of cartilage.21,106 Previous studies have demonstrated the close relationship between signaling molecules between the deep and calcified zones with the underlying subchondral bone in relation to the development of osteoarthritis.11,48 These results suggest that visualization of these deeper cartilage layers is critical for identification of early osteoarthritic changes.
T2 relaxation times in the deep radial and calcified zone of cartilage are too short to be detected on standard imaging due to the highly organized radial orientation of the collagen fibrils that limit mobility of water. 42 However, UTE sequences allow visualization of these layers 33 and allow for earlier detection of osteoarthritic changes in these layers relative to conventional imaging. 42 Alternative UTE-based sequences, such as UTE magnetization transfer, UTE-adiabatic T1ρ, and UTE-adiabatic T2ρ sequences have also been shown to be efficacious in the detection of early degenerative changes in the deeper zones of cartilage.22,101,119
Kajabi et al 56 used qMRI to identify early degenerative changes in posttraumatic osteoarthritis using an equine model. The authors found that T1, continuous wave T1ρ, and adiabatic T1ρ values were more sensitive in the detection of chondral lesions as compared with T2, adiabatic T2ρ, and TRAFF (relaxation across a fictitious field) values. Potter et al 86 examined T2 values in patients who sustained ACL tears to evaluate longitudinal articular cartilage degeneration. The authors found that all patients sustained chondral injuries at the time of ACL injury and demonstrated persistently prolonged T2 values of the lateral femoral condyle and patella at 1 year postoperatively.
Williams et al 116 used UTE-T2* mapping to identify early cartilage degeneration in humans. In contrast to previous reports of prolongation of T2 values in the setting of degeneration, the authors found a decrease in UTE-T2* values in areas of damaged cartilage, as verified by polarized light microscopy and histology. The authors speculated that the decreased UTE-T2* values could be the result of a relative increase in the T2 values in the surrounding areas, leading to an overall lower UTE-T2* value than what would be otherwise expected. Nonetheless, UTE-T2* sequences were able to visualize early cartilage degeneration in the deeper layers of cartilage that would otherwise not be identified with conventional imaging (Figure 4).

Top (A-C): Polarized light microscopy of the tibial plateau in (A) 18-year-old patient with healthy cartilage, (B) patient with intact articular surface but cartilage degeneration in deeper zones prior to total knee arthroplasty, (C) 76-year-old patient with cartilage fibrillations and disruption of the articular surface. Middle (D-F): UTE-T2* values are (D) high (20-30 ms) in healthy cartilage, (E) moderate (13 ms) in patients with deep cartilage degeneration, and (F) very low (3 ms) in patient with articular fibrillation. Bottom (G-I): T2 maps from conventional MRI show low signal at bone-cartilage interface, demonstrating short T2 values unable to be visualized on conventional imaging. Red color indicates shorter T2* values, suggestive of diseased cartilage. Green color indicates longer T2* values, indicative of healthy cartilage. UTE-T2*, ultrashort echo-time. Image reprinted from Williams et al 116 (2010 Osteoarthritis Research Society International [OARSI]) with permission from OARSI, the boxes represent areas of tissue that were sectioned for histological processing in their paper.
The qMRI techniques of T2 mapping and delayed gadolinium-enhanced MRI of cartilage (dGEMRIC) have also been used to evaluate the articular surface in other conditions, including femoroacetabular impingement, 54 hip dysplasia, 59 and Legg-Calve-Perthes disease.52,128 dGEMRIC, another qMRI technique, allows for quantification of the glycosaminoglycan content of articular cartilage by calculating the T1 value of the tissue after intravenous administration of a gadolinium-based contrast agent. 20 A dGEMRIC acquisition is performed by first administering the contrast agent, having the patient perform low-level exercise (eg, walking) to have the contrast agent diffuse into the articular cartilage, then scanning the joint after an additional waiting period. 20 After image acquisition, T1 values are calculated on a pixel-by-pixel basis. The contrast agent is needed, as it lowers the apparent T1 value of the tissue due to its negative charge. The presence of osteoarthritis, and associated loss of proteoglycans that have a fixed negative charge, will permit the contrast agent to enter the extracellular matrix of the articular cartilage. The contrast will diffuse into the articular cartilage in an inverse relation to the proteoglycan content of the tissue such that highly degenerated tissue will have lower T1 values than healthy tissue. 17
Meniscal Healing
Conventional MRI has limited utility in the evaluation of a healing meniscus after repair. Miao et al 73 compared meniscal healing on second-look arthroscopy, considered to be the gold standard, with conventional MRI. The authors found that conventional MRI was not sensitive, specific, or accurate for the evaluation of meniscal healing, with sensitivity, specificity, and accuracy values of 91.7%, 58.4%, and 62.9% for sagittal T1 images; 83.3%, 40.3%, and 46.1% for sagittal proton density images; 58.3%, 89.6%, and 85.4% for sagittal T2 images; 75%, 74%, and 74.2% for coronal proton density images; and 41.7%, 98.7%, and 91% for coronal T2 images. Scar tissue at a healed or healing meniscal repair site has high signal intensity relative to the adjacent meniscal tissue due to short T2 relaxation times of meniscus, 6 which makes differentiation of healed versus unhealed menisci challenging with conventional MRI. 76 However, when using the qMRI technique of T2 mapping, Yamasaki et al 121 found changes in T2 relaxation times (ΔT2) from preoperative to postoperative time points in patients undergoing meniscal repair. The authors found that a T2 decrease of ≥22.3 ms was associated with complete meniscal healing, as compared with patients with incomplete or no meniscal healing. Their findings were confirmed by second-look arthroscopy.
Koff et al 62 utilized an ovine model of meniscal repair and associated meniscal T2* values with direct histologic assessment via multiphoton microscopy (MPM) to quantify collagen matrix organization. The authors found prolonged T2* values in repaired menisci as compared with nonoperative controls, and the T2* values were associated with MPM quantitative measures of matrix organization at the 8-month postoperative time point.
Fedje-Johnston et al 37 compared adiabatic T1ρ, T2, and T2* relaxation times with histology and biomechanical testing in a goat model of meniscal repair (Figure 5). T1ρ relaxation times were sensitive to meniscal healing, which was associated with healing on correlative histological assessment and increased load to failure on biomechanical testing of the imaged specimens.

T2* relaxation times in goat menisci with tears shown after repair (top row) versus controls (intact menisci, bottom row). There are prolonged T2* relaxation times in the area of the tear compared with controls. White arrows indicate the area of the surgically induced meniscal tear. Green and yellow colors indicate longer T2* relaxation time, consistent with a nonhealed meniscal tear. ROI, region of interest. Image reprinted from Fedje-Johnston et al 37 via CC BY 4.0 (http://creativecommons.org/licenses/by/4.0/).
Few studies have used qMRI to evaluate meniscal repair in humans. Sneag et al 105 used UTE-T2* mapping to evaluate meniscal healing in patients after repair as compared with patients who underwent meniscectomy. In this small pilot study, the authors did not find significant differences in T2* values between groups, with a wide range of T2* values in both groups at 6 months and 1 year postoperatively. Chu et al, 27 however, found that UTE-T2* values of the posterior medial meniscus were 52% and 49% higher prior to surgery and at 2 years postoperatively, respectively, in patients who underwent ACLR.
The Current State of qMRI
A qMRI acquisition can be performed on a conventional MRI scanner either through manual acquisition of numerous image data sets or, more commonly, through software installed on the scanner that will acquire all of the necessary images within a single acquisition. The cost of a qMRI scan may be associated with the additional scan time required, typically 5 to 12 minutes, and/or costs associated with processing the acquired images to extract the T2, T2*, or T1ρ values. It should be noted that postprocessing of the acquired images is necessary. The software for image processing may be available from the MRI manufacturer, but it is common for a site/institution to have custom written software for the analysis. The time required for the postprocessing will depend on the extent of the analysis required by the study design. Although T2 mapping is available from all major MRI vendors, T2* mapping using an ultrashort echo acquisition and T1ρ mapping are not yet approved by the US Food and Drug Administration (FDA).
Limitations of qMRI
Although qMRI is a promising image acquisition and analysis technique, it is not without limitations. Improved understanding of the biologic correlations and validity of the individual qMRI techniques is needed. 57 Further, the variability between different MRI hardware and different MRI software should be assessed to understand differences that may occur between study sites. 67 Finally, known confounders of qMRI, including the magic angle effect, 22 where tissue the orientation relative to the external magnetic field may prolong T2 and T2* values, or the presence of materials that alter the local magnetic field, may in turn affect calculated T2 and T2* values.32,120 In addition, there is concern about the effects of gadolinium-based contrast agents in individuals with nephrogenic systemic fibrosis as well as gadolinium deposition in soft tissues. 2
Shear Wave Elastography
Limitations of Conventional Ultrasound
Conventional ultrasound provides information about the morphologic integrity of soft tissues. In the musculoskeletal system, that includes tendinopathy, synovitis, and ligamentous injury. However, diagnoses using conventional imaging are largely qualitative and do not provide information about the biomechanical properties of tissue. SWE allows for quantitative evaluation of tissue elasticity, characterizing material properties of tissue. 45
In SWE, an ultrasound transducer produces acoustic signals that travel perpendicular to the ultrasound probe and cause displacement of intervening tissues.78,107 The degree of displacement of the given tissue and shear wave velocity are calculated in order to generate the shear modulus of the tissue being imaged (Figure 6). 107 The shear modulus of a tissue, also known as the modulus of elasticity, can be calculated by dividing shear stress over shear strain and provides information about the elastic properties of tissues. 107 Shear waves move through tissues at different speeds depending on the elasticity of the tissue being imaged. 25 Shear waves have a higher velocity parallel to the long axis of muscles and tendons and also in contracted or stiff tissues. 107

Schematic demonstrating the science of shear wave elastography (SWE). SWE produces acoustic waves which travel perpendicular to the ultrasound probe and displace tissues in the field. The amount of tissue displacement is measured to determine the shear wave speed and thus the shear modulus of the tissue. ARF, acoustic radiation force; LW, longitudinal wave; SW, shear wave; US, ultrasound. Image reprinted from Taljanovic et al 107 (2017, Radiological Society of North America [RSNA]) with permission from RSNA.
In clinical practice, SWE is more extensively used to characterize lesions in the breast, liver pathology, and prostate.10,81,125 Within the musculoskeletal system, SWE has most widely been studied for tendinopathic applications,38,46,107 but has also been evaluated for use in muscles, ligaments, and nerves.60,107
SWE for Tendon
Conventional imaging has the ability to detect degenerated and torn tendons, largely via the use of MRI and ultrasound. SWE has been suggested as a tool to characterize tendon structure beyond the morphologic appearance. Earlier studies have evaluated for repeatability, finding SWE measurement fairly repeatable in Achilles and patellar tendons,60,84 among others. SWE tendon stiffness has been shown to change with positioning, increasing as the tendon becomes more taut or loaded.63,97 Torn tendons are softer on SWE and, generally, a degenerated tendon is also expected to be softer on SWE. 25,107 Studies have shown tendon SWE correlation with clinical metrics of pain,9,43,80 of particular interest as conventional imaging findings have suboptimal clinical correlation.
There is potential for SWE to be used in the assessment of preoperative tendon quality as well as posttreatment tendon health.28,99 Published studies have evaluated material properties of the rotator cuff muscles and tendons,50,95,123 as well as the Achilles tendon after treatment.25,38,39,46 Frankewycz et al 38 compared changes in material properties in Achilles tendon tears treated either operatively or nonoperatively using SWE. The authors found an increase in elastic properties of the Achilles tendon 6 weeks postinjury (increased stiffness), followed by a plateau, and then a second increase in elastic properties at 3 to 6 months postinjury (Figure 7). Yoo et al 123 found that rotator cuff tendons that were torn at ≤12 months of SWE had lower shear wave velocity, and thus a lower shear modulus and lower modulus of elasticity, compared with tendons that were torn >12 months before imaging. The authors concluded that SWE could potentially be used to provide insight into the chronicity of rotator cuff tendon injury, which provides valuable information when considering rotator cuff repair. However, the utility of SWE for the purposes of preoperative planning for rotator cuff repairs remains mixed in the literature. Lawrence et al 66 found that compared with conventional MRI, the shear modulus calculated with SWE was not associated with rotator cuff tear size, retraction, or fatty infiltration. Gilbert et al, 40 by contrast, found that SWE was able to accurately determine the amount of fatty infiltration of the rotator cuff when compared with conventional MRI. Unlike Lawrence et al, Deng et al 30 determined that SWE was able to accurately identify the degree of supraspinatus tendon tears (partial- vs full-thickness) compared with arthroscopic findings. Moreover, several studies have found that shear modulus values calculated with SWE corresponded well with the degree of muscle stiffness in patients with supraspinatus tendonitis.49,127 Pertaining to perioperative assessment of the rotator cuff, SWE may serve as an adjunct to conventional MRI.

Images of a torn Achilles tendon treated nonoperatively using B-mode ultrasound (left side) and shear wave elastography (SWE) (right side): (A) day of injury and (B) 1 week, (C) 3 weeks, (D) 6 weeks, (E) 12 weeks, and (F) 6 months postinjury. Red areas on the SWE color map are associated with increased stiffness, and blue areas are associated with increased compliance. The Achilles tendon demonstrated increased stiffness as healing occurred. Image reprinted from Frankewycz et al 38 via CC BY 4.0 (https://creativecommons.org/licenses/by/4.0/)
Tendon stiffness on SWE increases with active loading, but some studies have also detected persistent changes in SWE tendon stiffness after repetitive loading as seen in athletes44,103 (Figure 8). Given that SWE can detect stiffness changes in tendons that have undergone varied biomechanical loading, it might be a useful tool to measure efficacy of tendon rehabilitation programs and potentially as a marker for overuse.

Nonweightbearing shear wave elastography measurement of patellar tendon stiffness in the nondominant (top) and dominant (bottom) knees of an asymptomatic college basketball player. Arrows on the right-hand images show the stiffness color map in the patellar tendon. Note deeper blue measurement color map within the patellar tendon in the dominant knee, indicating greater stiffness.
SWE for Muscle
Muscle strain, fatty atrophy, and muscle spasticity conditions such as cerebral palsy and cerebrovascular injury have all been investigated using SWE.64,71,124 Injected saline causes a decrease in muscle stiffness on SWE in the immediate postinjection time period, 79 and edematous muscle in inflammatory myositis has been shown to be less stiff than healthy muscle on SWE. 4 This suggests that, in general, edematous muscle is less stiff on SWE. SWE has detected longitudinal increases in muscle stiffness while healing after strain injury, 124 similar to the findings in tendon after repair. Affected muscles in spastic cerebral palsy are stiffer than healthy muscle, 65 and similar increased muscle SWE stiffness measurements have been seen in patients with poststroke spasticity.114,118 In addition, changes in SWE muscle stiffness are detectable via SWE after intramuscular botulinum toxin injection51,64 (Figure 9), and these changes have been associated with clinical metrics of muscle stiffness. 51 With regard to muscle atrophy, a number of investigations have looked at SWE to assess rotator cuff fatty infiltration. As with the rotator cuff tendon investigations, SWE for rotator cuff muscle investigations have shown varied results, from poor to good correlation with MRI grades of fatty infiltration.53,71,83 Given that conventional computed tomography and MRI can effectively grade fatty infiltration, it appears SWE is not appropriate for this application. It should be noted that load- and pressure-based differences in SWE measurements described in tendon also apply to muscle, 63 so interpretation of SWE in muscle should be made noting those caveats.

(A) Baseline and (B) 1-month follow-up shear wave elastography (SWE) measurements of flexor pollicis brevis (FPB) muscle stiffness after intramuscular botulinum toxin injection. Images show transverse thenar eminence musculature, with the SWE color map (red-shaded box) and stiffness measurement (dashed yellow tracing) centered at the FBP. Decreased SWE stiffness is seen on the 1-month follow-up SWE measurement in (B).
The Current State of SWE
SWE is not yet widely used in clinical settings for musculoskeletal conditions, although the technology has existed for 30 years. 82 A conventional ultrasound machine may be used for image acquisition providing that the additional software required for SWE is available. Knowledge of sonographic technique is required to correctly perform SWE, and SWE training opportunities are not widespread.
SWE is FDA approved but is not yet widely implemented for evaluation of musculoskeletal tissues, likely due to the aforementioned logistical issues and limitations. To date, a majority of published studies are demonstrating correlation between SWE and conventional imaging findings for musculoskeletal conditions.40,99 However, there remains a need for further research investigation into the applicability of SWE in musculoskeletal health, with hopes to answer clinically pertinent questions beyond what can be addressed by conventional imaging techniques.
Limitations of SWE
There are limitations to SWE, however. In addition to the user-dependence of the technique, SWE values are affected by patient positioning24,94 and potentially by sex 24 and age. 36 Small ROIs and limited depth of penetration are also limitations of SWE, 108 as SWE is less reliable at assessing tissues at depths >7 cm.5,108 SWE is also susceptible to artifact, including artificial elevation of measured stiffness close to very dense tissue such as bone, limiting accuracy. 19 Perhaps most limiting to widespread application is the differences in cutoff values on different ultrasound systems and transducers, 102 limiting comparison across ultrasound systems.
Conclusion
Both qMRI and SWE show promise in the advancement of musculoskeletal imaging by allowing for assessment of not only soft tissue structural properties, but also functional and material properties. Orthopaedic applications of these imaging modalities include the evaluation of ACL graft maturity, meniscal healing, and earlier detection of cartilage degeneration and tendinopathies.
Although T2 mapping is available from all major MRI vendors, T2* mapping using an ultrashort echo acquisition and T1ρ mapping are not yet FDA-approved. Variability in scales used across different vendors limits generalizability of SWE measurements, and the technique requires knowledge of ultrasound and structured acquisition protocols to be reliable. Future investigations are needed to fully garner clinical the utility of qMRI and SWE findings beyond what is available from conventional imaging.
Footnotes
Final revision submitted July 28, 2024; accepted September 12, 2024.
One or more of the authors has declared the following potential conflict of interest or source of funding: The Hospital for Special Surgery has an institutional research agreement in place with GE Healthcare and Siemens Healthineers. O.K.N. has received consulting fees from Samsung. S.A.R. has received research support from Angiocrine Biosciences; consulting fees from DJO, Novartis, and Advance Medical; and nonconsulting fees from Terumo and Smith & Nephew. He has stock/stock options in Ortho RTI and Smith & Nephew. AOSSM checks author disclosures against the Open Payments Database (OPD). AOSSM has not conducted an independent investigation on the OPD and disclaims any liability or responsibility relating thereto.