
Abstract
Background:
Strength assessment and the single-leg hop test are used to assess an athlete's readiness to return to sports after anterior cruciate ligament (ACL) reconstruction (ACLR). Other factors may confound this relationship, limiting the clinical utility of the single-leg hop test.
Purposes:
To determine whether the relationship between single-leg hop performance and knee extension/flexion torque is affected by confounding variables and to assess whether the strength of the ACL-reconstructed limb could be predicted using the single-leg hop distance.
Study Design:
Cross-sectional study; Level of evidence, 3.
Methods:
Included were 35 men (age, 29.5 ± 6 years; weight, 83.5 ± 8.9 kg) who had undergone ACLR with hamstring tendon autografts. A homogeneous participant population was intentionally recruited to limit variation in outcome measures, increasing the likelihood of successfully predicting strength. The single-leg hop distance and knee extension/flexion strength were assessed. Correlation coefficients were calculated to assess the relationship between single-leg hop test, knee extension/flexion strength, and age. Linear modeling was used to predict knee extension strength, and logistic regression was used to predict which participants met commonly used clinical cutoff values of strength symmetry—measured as the limb symmetry index (LSI).
Results:
Strength variables were moderately related to knee extension strength and the single-leg hop distance, although these relationships exhibited wide 95% CIs. The mean error when predicting knee extension strength based on the single-leg hop distance, eccentric knee flexion strength, and age was 0.38 N·m/kg (18%). Eight participants (23%) were incorrectly classified as having a knee extension strength LSI of <85% when using logistic regression to determine whether clinical cutoff values for symmetry were met.
Conclusion:
Although the relationship between the single-leg hop test and knee extension strength was moderate, this relationship was imprecise, and predicting strength based on the single-leg hop test resulted in a clinically meaningful amount of error. Based on study findings, it is unlikely that the single-leg hop test provides clinical utility if the goal is to assess knee extension strength.
Anterior cruciate ligament (ACL) rupture is a common injury among athletes, which is associated with functional deficits, long rehabilitation periods, increased risk of recurrent injury, early onset of cartilage degeneration, and consequently high risk of osteoarthritis. 7 ACL reconstruction (ACLR) is one of the treatments recommended to restore knee kinematics and function to help athletes return to their preinjury sports level. However, only 67% of the patients return to their preinjury level of sports, 3 and 20% of athletes experience a repeat injury when returning to competition. 4 The risk of reinjury is related to several factors—including but not limited to muscle strength imbalances between the reconstructed and uninjured limb, hop test performance, poor psychological readiness, and time taken to return to competition. 11 Functional performance measures—such as strength and hop test performance—are often used clinically to track rehabilitation progress and inform readiness for return to sports (RTS) after ACLR. 10
Muscle strength deficit is common after ACLR. Asymmetrical knee extensor strength is associated with altered knee biomechanics during functional tests, which could increase the risk of reinjury. 21 In addition, hamstring weakness can affect knee mechanics during gait and jogging. The knee flexors play an important role as an ACL agonist, reducing ligament stress during functional activities.1,8 Muscle strength is commonly evaluated by isokinetic devices, which are expensive and have functional limitations, thereby limiting their use clinically. 29 Therefore, clinicians commonly use the single-leg hop distance as a criterion for athletes to RTS after ACLR. 14 The limb symmetry index (LSI) is used to evaluate the imbalance between the operated and uninjured limbs; an LSI of >85% to 90% on all strength and hop tests is recommended as a cutoff point for a safe RTS. 28 While used by clinicians to estimate knee extension strength, the use of the LSI for the single-leg hop test to evaluate patients’ functionality after ACLR has been questioned. 13
Previous studies have correlated knee extension and flexion strength with the single-leg hop distance, reporting positive relationships.22,25,29 However, bivariate correlations may overinflate the strength of the relationship between the single-leg hop test and muscle strength. Multivariate analysis may provide better insight into this relationship by accounting for the variance that other variables play in this outcome measure. Also, while LSI cutoff values for strength and hop distances are commonly used in clinical settings, previous research has not investigated whether multivariate models can accurately predict whether patients meet common clinical cutoffs for strength symmetry.
This study aimed to examine the relationship between single-leg hop distance and knee extension/flexion strength in the ACL-reconstructed limb when accounting for other potentially important variables. In addition, we aimed to determine whether patients could be accurately classified as meeting clinical cutoff values for knee extension/flexion strength LSI based on the hop test LSI.
Methods
Study Design
The protocol for this study received ethics committee approval, and all included participants provided written informed consent. Participants were included in the study if they were between 18 and 45 years old and had undergone ACLR using a hamstring tendon autograft for an isolated ACL tear. The exclusion criteria for this study were previous contralateral knee injury; residual pain, swelling, or discomfort from surgery; and an inability to perform physical testing.
Participants
Included were 35 recreationally active men (mean age, 29.5 ± 6 years; mean weight, 83.5 ± 8.9 kg). Their preinjury physical activity level was between 5 and 7 on the Tegner activity scale. All participants had sustained a primary unilateral ACL tear that had been reconstructed using a hamstring tendon autograft. All participants were assessed between 6 and 8 months postoperatively (mean, 7.2 ± 0.6 months postoperatively), had completed rehabilitation, and had been cleared to RTS by their surgeon and rehabilitation team. Although all participants completed rehabilitation, standardization of the rehabilitation programs was not possible.
A homogeneous participant sample was recruited, as the primary aim of this study was to determine whether the single-leg hop test could be used to predict the knee extension strength of the previously injured limb. Sources of known and unknown variation in knee extension strength and single-leg hop distance would make predictions less accurate and recruitment of a homogeneous cohort improves our ability to achieve the aims of the study. If knee extension strength cannot be predicted in a homogeneous cohort, it is highly unlikely that it can be predicted in other cohorts with increased variability. Therefore, the recruitment of a homogeneous sample was intentional to determine whether the prediction was possible.
Testing Procedure
Strength Tests
Participants cycled for 5 minutes on a stationary bicycle as a warm-up. Knee extension and flexion strength was assessed using a Biodex Systems 4 isokinetic dynamometer (Biodex Medical Systems). The participants were seated upright in the dynamometer with their hips and knees flexed at 90°. Restraints were applied at the knee, hips, and shoulders to limit unwanted movement. As a further warm-up, participants performed a practice trial at a velocity of 90 deg/s for 5 repetitions of concentric knee extension and flexion, followed by 1 minute of rest.
The protocol for strength testing consisted of 5 maximal concentric knee extension and flexion contractions at 60 deg/s, 10 maximal concentric knee extension and flexion contractions at 300 deg/s, and 5 maximal eccentric knee flexion contractions at 60 deg/s. Sets were separated by 1 minute, and the uninjured limb was always tested first. Standard instructions, feedback, and verbal encouragement were provided during tests. For each contraction mode and speed, the peak torque from the single best repetition was used for analysis. In addition, the peak torque values were converted to LSI, calculated as follows: (ACL-reconstructed limb/uninvolved limb) × 100% and expressed as percentages.
Single-Leg Hop Test
For the single-leg hop test, participants started from a quarter squat position and were instructed to hop forward as far as possible, land on the take-off foot, and hold the position for 2 seconds. The distance between the start line to the heel of the landing leg was measured with tape on the floor. If the participant did not meet landing criteria (nonlanding leg hits the floor or skipping during landing), the trial was discarded, and the test was repeated. Participants performed 2 practice trials before testing. The uninjured limb was tested first, and no restrictions were given for arm movements. Participants had to complete 2 successful trials on each limb. The mean distance was used for statistical analyses. 18 As with the strength tests, hop test distance values were converted to LSI.
Functional Outcomes
Subjective knee function was evaluated using the International Knee Documentation Committee and the Anterior Cruciate Ligament–Return to Sport after Injury questionnaires.
Statistical Analysis
Statistical analysis was completed in R (RStudio Inc). The sample size for this study (N = 35) was determined using methods described by Algina and Olejnik. 2 A sample size of 35 patients was necessary to detect a sample correlation coefficient (between single-leg hop distance and knee extension strength) of r = 0.65 ± 0.20, with a probability of 95%. 2 This correlation coefficient and the surrounding interval were chosen as it is representative of correlations reported in the literature.9,20,22 In addition, recognizing that there is variation in single-leg hop distance and knee extension strength between samples, the sample size for this study should, at worst, result in a moderate correlation between single-leg hop distance and knee extension strength.
Descriptive statistics (mean ± SD) are reported for each variable. There was no missing data for any participants or variables. All variables were assessed for normal distribution using the Shapiro-Wilk test and visually by histograms. Pearson correlation coefficients were calculated to determine the relationship of the single-leg hop distance to knee extension/flexion strength and patient age, with r values interpreted as negligible (0-0.09), weak (0.10-0.39), moderate (0.40-0.69), strong (0.70-0.89), or very strong (0.90-1.00). 26 The single-leg hop test, eccentric knee flexion strength, and age were then included in multiple linear regression models to predict knee extension/flexion strength. The assumption of linearity was checked by visual inspection of Q-Q plots and plots of residuals versus fitted values; no models violated this assumption. Model fit was assessed using the adjusted R2 value, and the root-mean-square error was used to make inferences regarding the precision of the model. Logistic regression models were used to predict which participants would meet the clinical cutoff of 85% for knee extension and eccentric knee flexion strength LSI at 60 deg/s. 20 The hop test distance LSI was used as a predictor in this model for both strength and hop test distance, with LSI values closer to 100% representing more symmetry between limbs. Statistical significance was established a priori as P < .05.
Results
The outcomes for knee extension/flexion strength (peak torque), hop test distance, and functional scores are shown in Table 1.
Descriptive Statistics for Peak Torque, Single-Leg Hop Test, and Subjective Knee Function a

ACL, anterior cruciate ligament, ACL-RSI, Anterior Cruciate Ligament–Return to Sport after Injury; IKDC, International Knee Documentation Committee; Max, maximum; Min, minimum; LSI, limb symmetry index. Dashes indicate not applicable.
Limb symmetry index was calculated as (ACL-reconstructed limb/uninvolved limb) × 100.
Relationship Between Thigh Muscle Strength and Single-Leg Hop Test
All knee extension and flexion strength values at both 60 and 300 deg/s in the ACL-reconstructed limb were significantly correlated with the single-leg hop distance in the ACL-reconstructed limb (Table 2 and Figure 1). Hop test limb symmetry index was correlated with knee extensor strength limb symmetry index at 60°/sec (r = 0.52, p = 0.001) and 300°/sec (r = 0.61, p < 0.001). Age was also significantly correlated with the single-leg hop distance in the ACL-reconstructed limb (P= .05).
Correlation Between Single-Leg Hop Distance and Strength and Age Variables

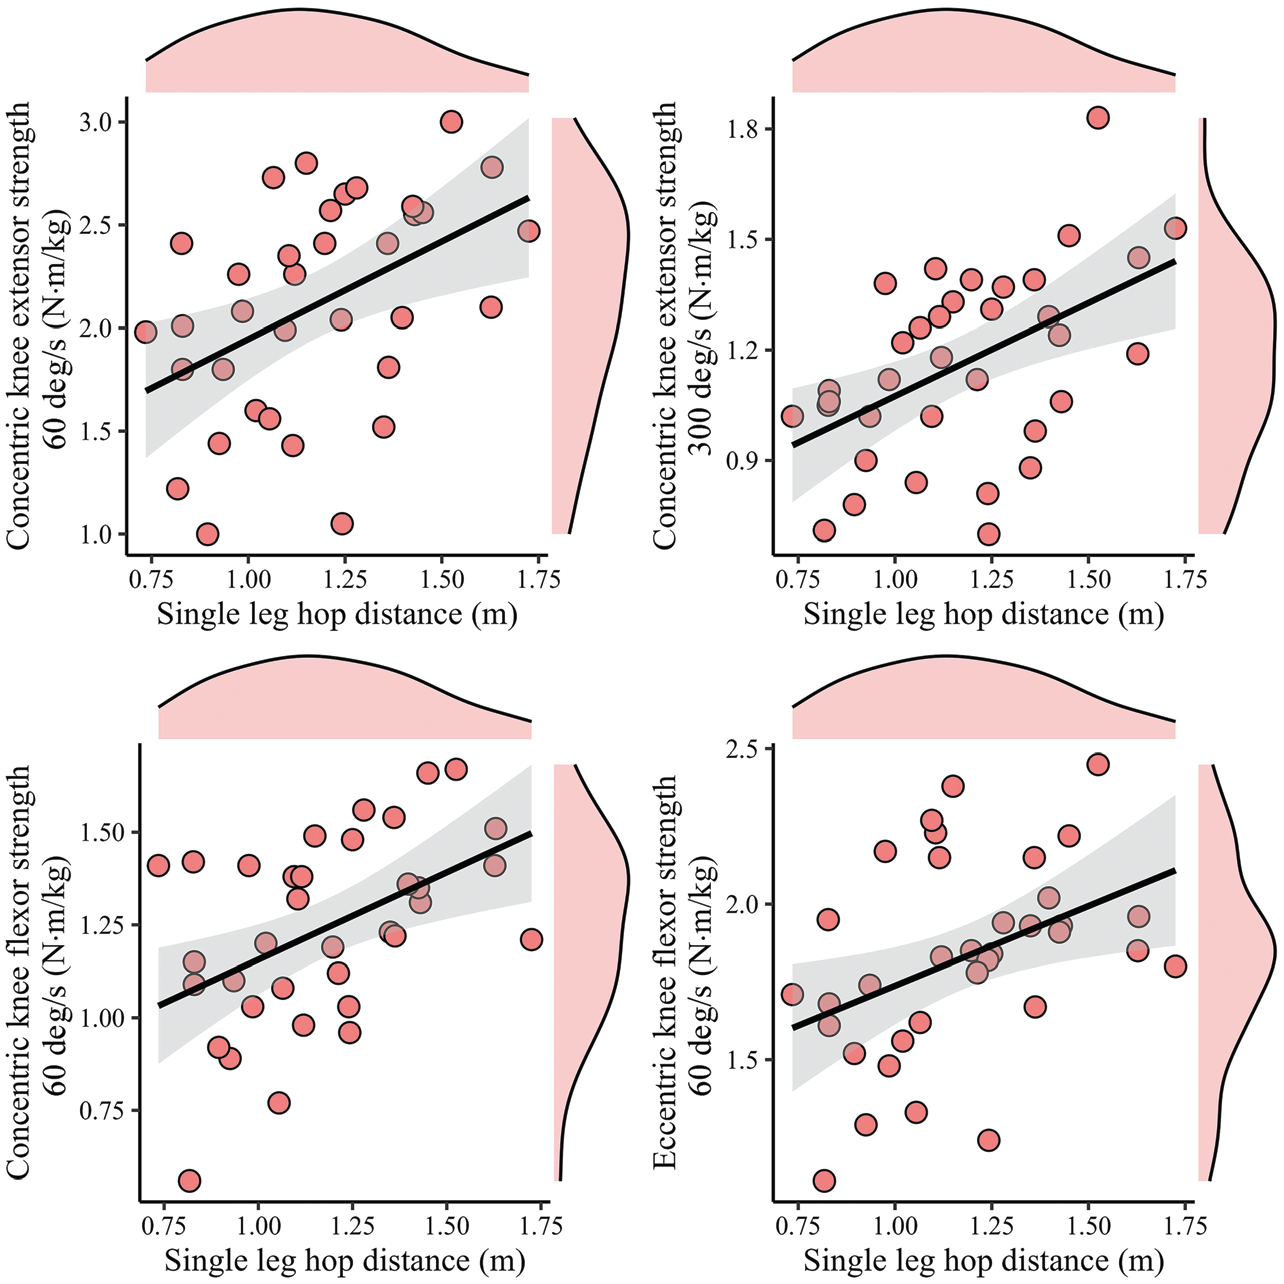
Scatterplots demonstrating the relationship between single-leg hop distance and concentric knee extension/flexion peak torque. Each point represents a single participant. The black lines depict the line of best fit, with the shaded area depicting 95% CIs. The distribution of each variable is displayed by the shaded area above (single-leg hop distance) and to the right (strength variable) of each graph.
Linear Models of Knee Extension Strength
Including single-leg hop distance of the ACL-reconstructed limb, eccentric knee flexion strength of the reconstructed limb, and age as predictors of reconstructed-limb knee extension strength at 60 deg/s resulted in a statistically significant model (adjusted R2 = 0.42; P < .001). Within this model, eccentric knee flexion strength was significantly associated with knee extension strength (β = 0.88 [95% CI, 0.39 to 1.36]; P = .001); however, single-leg hop test (β = 0.42 [95% CI, –0.21 to 1.07]; P = .18) and age (β = −0.01 [95% CI, –0.03 to 0.02]; P = .57) were not associated with knee extension strength. When using this model to predict knee extension strength at 60 deg/s in the reconstructed limb, there was a root-mean-square error of 0.38 N·m/kg (18%).
Single-leg hop distance in the reconstructed limb, age, and eccentric knee flexion strength in the reconstructed limb also resulted in a statistically significant model when predicting reconstructed-limb knee extension strength at 300 deg/s (adjusted R2 = 0.53; P < .001). Within this model, eccentric knee flexion strength (β = 0.48 [95% CI, 0.27 to 0.70]; P = .001) was associated with the outcome, but age (β = −0.002 [95% CI, –0.01 to 0.01]; P = .72) and single-leg hop distance (β = 0.23 [95% CI, –0.04 to 0.52]; P = .09) were not. The root-mean-square error associated with this model was 0.16 N·m/kg (14%).
Classifying Patients into Strength Symmetry Cutoffs Based on Single-Leg Hop Test Symmetry
The single-leg hop distance LSI was used to predict which patients would meet clinical cutoffs for knee extension strength LSI (measured at 60 deg/s) and eccentric hamstring strength LSI . The slope of the logistic regression model demonstrated that a more symmetrical single-leg hop test distance was associated with a higher probability of exceeding a knee extension strength LSI of 85% (β = 0.09 [95% CI, 0.02 to 0.21]; P = .04) (Figure 2). The model correctly classified 77% of patients; 96% of patients with a knee extension strength LSI <85% (23/24 patients) and 36% of patients with a knee extension strength LSI >85% (4/11 patients) were correctly classified. The hop test LSI could not classify patients as above or below clinical cutoffs for eccentric hamstring strength (β = 0.02 [95% CI, –0.03 to 0.07]; P = .50).

(A) The relationship between the single-leg hop test distance LSI and the knee extension strength LSI (clinical cutoff: >85% or <85%). The vertical bars at the top and bottom of the graph represent the values of participants. The red line depicts the logistic regression line fitted to the data, with the gray shaded area representing 95% CIs. (B) The relationship between knee extension strength LSI and single-leg hop LSI. Each circle represents a single participant. The distribution of each variable is depicted by the shaded area above (knee extensor strength LSI, %) and to the right (single-leg hop test LSI,%) of each individual graph. The solid line depicts the line of best fit, and the shaded gray area depicts the 95% CI. LSI, limb symmetry index.
Discussion
Similar to previous studies,9,19,20 we observed correlations between the single-leg hop distance and knee extension and flexion strength. Multiple linear regression models were used to predict knee extension strength, although these models performed poorly. Logistic regression models accurately classified participants not meeting the 85% cutoff for strength symmetry, although most participants with a knee extension strength symmetry index of >85% were inaccurately classified. We observed a clinically meaningful amount of error when predicting the knee extension strength of the reconstructed limb using the single-leg hop distance. We recruited a homogeneous sample, and given the error observed here, it is unlikely this test offers utility for assessing strength in other clinical populations (eg, women and teenagers who have undergone ACLR), where there are other factors contributing to variability in strength and hop test ability.
Several studies have reported moderate to strong relationships between knee extension strength and single-leg hop distance.9,19,20 Based on the findings from these studies, it is suggested that the single-leg hop distance could be used clinically as a surrogate measure of knee extension strength. 9 Assessing knee function after reconstruction is important; however, clinical tests must demonstrate appropriate precision. The confidence intervals for the correlation coefficients of most strength variables were similar (r = 0.22-0.70). Based on interpretations of correlation coefficients, the relationship between knee extension and flexion strength and single-leg hop distance could be anywhere from weak to strong. 26 The wide range of confidence intervals around correlation coefficients may suggest that other factors contribute to the variation in strength, and the clinical use of this test as a marker of knee extension strength is questionable. 26 Therefore, when assessing knee extension strength in the context of ACL rehabilitation, clinicians should be aware that there are no surrogate tests available and clinicians need to conduct a specific strength test for a valid measure of strength—such as using hand-held dynamometry, a custom load cell set-up, or gymnasium-based equipment.
Some studies have inferred that strength can be predicted using the single-leg hop test (or vice versa) in the context of ACL rehabilitation.6,24 Quadriceps strength is an important variable to measure after ACLR, as it is related to performance during functional tasks and sport-specific activities.15,16,23 While the multiple linear regression model fit our data relatively well (adjusted R2 = 0.42 and 0.53 for models of reconstructed-limb strength at 60 and 300 deg/s, respectively), coefficient precision and the predictive ability of the model were poor. When including the eccentric knee flexion strength of the reconstructed limb in the model, there was no longer an association between the single-leg hop distance and age or knee extension strength of the reconstructed limb. The fact that eccentric knee flexion strength had the strongest association with knee extension strength could be explained by neural factors. Patients who have undergone ACLR demonstrate difficulties recruiting high threshold motor units of the quadriceps and hamstrings 1 year after surgery. 17 Reconstruction may cause consistent and widespread inhibition of thigh muscles, resulting in weakness of the knee extensor and knee flexor muscles. Predicting knee extension strength of the reconstructed limb using the multiple linear regression model resulted in an error of 18% for knee extension at 60 deg/s and 14% for knee extension at 300 deg/s. Considering that differences of 10% in strength measures can help inform clinical decision-making, 11 it is unlikely the single-leg hop distance accurately measures knee extension strength. Moreover, predictions were on the same data used to train the model, and the real error when predicting knee extension strength using a single-leg hop test is likely larger. Overall, clinicians should be aware that older patients with an ACLR are likely to have lower strength compared with younger patients and that there is likely widespread weakness in muscles acting on the thigh in patients after ACLR. Clinicians need to keep these factors in mind when making decisions around rehabilitation progression and return to activity.
Most studies have reported on the degree of asymmetry for strength and hop tests.9,11,20 In the present study, the relationship between hop asymmetry and strength asymmetry (r = 0.52; P = .001) was stronger than the relationship between hop test and strength in the reconstructed limb and may yield more accurate predictions than multiple linear regression models. Despite stronger relationships between strength and hop test measures, symmetry measures when presented on a continuous scale demonstrate considerable individual variation (see Figure 2B). This variation results in wider confidence intervals around estimates of the true population value of these measures.
The logistic regression model correctly classified 77% of participants. Almost all the participants with a hop test distance LSI of <85% were correctly classified (23/24). This has important clinical implications. If a patient is classified as having knee extension strength LSI of <85% based on their single-leg hop distance, the clinician would focus on improving knee extension strength. Therefore, the single-leg hop distance LSI may be a useful tool in identifying strength asymmetry, prompting a focus on knee extension strength. Most errors were due to incorrect classification of participants with an LSI of >85% of the single-leg hop test. While the use of ratio measures such as LSI should be questioned, 12 classifying participants based on LSI values at least provides some indication that the function of 1 limb may be lacking. While the error associated with this model can be improved, from a clinical perspective it is more important to identify which patients do not meet cutoff values than those who do meet them. Incorrect classification of patients who do not meet a cutoff value (ie, incorrectly classifying them as exceeding the cutoff) means they are potentially progressing through rehabilitation stages before they are adequately prepared. This might increase the risk of reinjury. Incorrectly classifying patients as not meeting a clinically meaningful cutoff value (when they have exceeded it) means that they may spend more time in a rehabilitation stage before progression. This is problematic at the elite level of competition, where there is increased pressure on player availability; however, at lower levels of competition, this could have beneficial effects, as delayed return to play is associated with reduced reinjury risk. 5
Limitations
There are several study limitations that require acknowledgment. The study recruited a homogeneous sample—all participants were men, received a hamstring autograft, and were >20 years old. This limits the extrapolation of these results to other populations, for example, in teenagers and women, where ACL injury is common. 27 Sample homogeneity could also be viewed as a benefit of this study, as this limited the sources of variation in predictors and the outcome variable. Given that predictive ability was poor and unknown sources of variation may be limited due to sample homogeneity, this provides further confidence that the hop test has limited capacity to predict knee extension strength. The same surgeon did not perform ACLR on all participants, and we did not record which patients suffered concomitant meniscal damage; these may have been sources of homogeneity that influenced predictive ability. Prediction models also perform poorly when trained with small numbers of observations. While the sample size recruited for this study was sufficient to achieve our aims, accurate clinical prediction models generally require far larger sample sizes than those recruited for this study. Consequently, future studies aiming to develop prediction models of knee extension strength during ACL rehabilitation that could be implemented in clinical practice should aim to recruit larger sample sizes. Furthermore, to calculate the error associated with models in this study, the same data were used for model training and prediction. Models generally perform better when making predictions on the same data used for training. Therefore, the error when using these models to make predictions in the wider population is likely larger than reported here.
Conclusion
Despite previous research reporting moderate to strong relationships between single leg hop distance and knee extension strength of the ACL-reconstructed limb, there was considerable error when using this variable to predict strength. Classifying patients as above or below 85% knee extension strength symmetry yielded less error, although model performance was still poor. Using the single-leg hop test to make predictions regarding knee extension strength was limited, and practitioners should consider other clinical tests if the goal is to make inferences regarding knee extension strength during rehabilitation from ACLR.
Footnotes
Final revision submitted March 25, 2024; accepted June 10, 2024.
The authors have declared that there are no conflicts of interest in the authorship and publication of this contribution. AOSSM checks author disclosures against the Open Payments Database (OPD). AOSSM has not conducted an independent investigation on the OPD and disclaims any liability or responsibility relating thereto.
Ethical approval for this study was obtained from the Federal University of Health Science of Porto Alegre (ref No. 2.547.728).