
Abstract
Background:
Traumatic rotator cuff tears can result in retraction of the tendon and may be associated with muscle edema, which may be confused with fatty infiltration as seen on magnetic resonance imaging (MRI).
Purpose:
To describe the characteristics of a type of edema associated with acute retraction of the rotator cuff tendon (termed “edema of retraction”) and to highlight the risk of mistaking it with pseudo–fatty infiltration of the rotator cuff muscle.
Study Design:
Descriptive laboratory study.
Methods:
A total of 12 alpine sheep were used for analysis. On the right shoulder, osteotomy of the greater tuberosity was performed to release the infraspinatus tendon; the contralateral limb acted as the control. MRI was performed immediately after surgery (time zero) and at 2 and 4 weeks postoperatively. T1-weighted, T2-weighted, and Dixon pure-fat sequences were reviewed for hyperintense signals.
Results:
Edema of retraction resulted in hyperintense signals around or within the retracted rotator cuff muscle on both T1- and T2-weighted imaging, but there was an absence of hyperintense signals on Dixon pure-fat imaging. This represented pseudo–fatty infiltration. Edema of retraction created a characteristic “ground glass” appearance of the muscle on T1-weighted sequences and was often found in either the perimuscular or intramuscular location of the rotator cuff muscle. Compared to time zero values, a decrease in the percentage of fatty infiltration was observed at 4 weeks postoperatively (16.5% ± 4.0% vs 13.8% ± 2.9%, respectively; P < .005).
Conclusion:
The location of edema of retraction was often peri- or intramuscular. Edema of retraction presented as a characteristic “ground glass” appearance of the muscle on T1-weighted sequences and led to a decrease in the fat percentage because of a dilution effect.
Clinical Relevance:
Physicians should be aware that this edema can result in a form of pseudo–fatty infiltration, as it is associated with hyperintense signals on both T1- and T2-weighted sequences, and it can be mistaken for fatty infiltration.
Keywords
Rotator cuff muscle edema can occur as a result of various abnormalities. The presence of edema can be a pathophysiological consequence of acute rotator cuff tendon detachment from bone, midsubstance lesions, 13 or musculotendinous junction ruptures. 10,14,23 It can also occur in denervation conditions such as compression of the suprascapular nerve 3 and Parsonage-Turner syndrome. 1 Understanding the causes of edema formation and the characteristics of this finding on magnetic resonance imaging (MRI) can assist in treatment strategies and their timing. The degree of fatty infiltration may be confounded by muscle edema when assessing it via T1- and T2-weighted MRI sequences and may instead appear as “pseudo–fatty infiltration” mimicking fatty infiltration. Even though traumatic edema has clearly been described, 16 –18 there is currently a paucity of literature regarding how to interpret edema formation, the timing of edema development, and its potential consequences. 4 –6,15
The aim of this study was to describe a type of edema associated with acute rotator cuff tendon retraction, which we have termed “edema of retraction,” and to detail its characteristics in an animal model. The hypothesis was that edema of retraction does exist and may be associated with the development of pseudo–fatty infiltration on T1-weighted MRI sequences.
Methods
This study was performed in accordance with the Swiss laws of animal welfare, and the study protocol received institutional review board approval. A total of 14 alpine sheep were used for analysis: 2 sheep were used for the preliminary study, and the remaining 12 sheep were included in the main study. On the right shoulder of each sheep, osteotomy of the greater tuberosity was performed to release the infraspinatus tendon. The left shoulder acted as the control. MRI was performed immediately after surgery (time zero) and at 2 and 4 weeks postoperatively. The outcome of interest was the demonstration of edema of retraction on MRI after a rotator cuff tear.
Surgical Technique
All surgical procedures were performed by an author (B.v.R.) who has 20 years of experience with similar procedures. 7 –9 An established sheep model with acute release of the infraspinatus tendon (osteotomy of the greater tuberosity) was used. 7 –9 Through a 15-cm curved incision 2 cm caudal to the scapular spine, the infraspinatus tendon was released via flake osteotomy of the greater tuberosity. Hence, to allow for retraction of the muscle and avoid fibrotic adhesion over time, the tendon was wrapped in a 12 mm–diameter silicone tube (silicone Penrose drain; Fortune Medical Instrument) to prevent spontaneous reattachment by scar tissue, and the wound was closed.
MRI Scanning
In the preliminary study (n = 2 sheep), MRI was performed at time zero and at 1, 2, 3, and 4 weeks after surgery to determine the time point for peak edema formation, which we observed at 2 weeks after osteotomy. Thereafter, for the main study (n = 12 sheep), MRI was performed at time zero and at 2 and 4 weeks after surgery. Imaging was not performed at 6 weeks after surgery, as this information is already available in the literature. 5
MRI was performed with the animal positioned supine with the legs strapped together and bent forward. A 3-T system (Philips) with a dedicated receive-only extremity coil and a slice thickness of 3.5 mm was used. Both scapular spines were positioned in the imaging plane, resulting in transverse sections of the sheep’s shoulders perpendicular to the glenoid cavity. Pulse sequences were as follows: T1-weighted turbo spin echo (TSE) transverse, proton density–weighted TSE transverse, T1-weighted TSE coronal, T2-weighted spectral presaturation with inversion recovery coronal, and Dixon method (in-phase transverse, out-of-phase transverse, water-only transverse, and fat-only transverse).
Rehabilitation and Sacrifice
To reproduce normal conditions in humans, the animals were not prevented from weightbearing or stress after the initial surgery. Pain medication and prophylactic antibiotics were given for 3 days postoperatively. No unexpected adverse events were observed. All animals were euthanized at 4 weeks after the original tenotomy and after undergoing the last MRI examination and biopsy under general anesthesia (pentobarbital; Streuli Pharma).
MRI Evaluation
All MRI analyses were performed by a senior musculoskeletal radiologist (F.K.).
Determination of Muscle Edema
Muscle edema was defined as hyperintense signals of the affected muscle on T2-weighted MRI sequences. Normalization was performed on the unoperated contralateral limb as the control, which was taken as the “normal” intensity compared to the operated side. These measurements of MRI data were performed by doctoral students and verified by a board-certified radiologist (F.K.) who was blinded to the study groups.
Determination of Fatty Infiltration
The 2-point Dixon sequence was used when calculating fat percentage, with regions of interest drawn on the infraspinatus muscle edema area per the method of Nozaki et al. 21 The mean signal intensity (S) was measured on in-phase (S(In)) and fat- and water-only (S(Fat) and S(Water), respectively) images, and the amount of fat contained in the infraspinatus muscle was calculated using the following equations:


Determination of Pseudo–Fatty Infiltration
Pseudo–fatty infiltration was defined when hyperintense signals on T1-weighted sequences mimicking fatty infiltration were observed in a specific area but were not observed on 2-point Dixon sequences. The appearance of edema on T1-weighted sequences was also evaluated.
Statistical Analysis
Because of the lack of data on the topic, no a priori sample size calculation could be performed for this experimental study. An independent biostatistician performed statistical analyses. The normality of continuous data distribution was assessed using the Shapiro-Wilk test. Because the data were not normally distributed, the difference in the fat percentage on MRI between 2 time points was evaluated using the Wilcoxon signed-rank test. Analyses were performed using R (Version 3.6.2; R Foundation for Statistical Computing). P <.05 was considered significant.
Results
MRI of the 12 sheep included in the main study indicated that edema of retraction occurred after sectioning of the infraspinatus tendon (Figure 1). Edema of the infraspinatus muscle was observed in all sheep and appeared hours after sectioning was performed. The location of this edema was often peri- or intramuscular, and the edema size increased over the 1-month follow-up period. Edema of retraction as seen on T1-weighted sequences appeared characteristically in all sheep as diffuse and poorly defined, with a “ground glass” appearance of the muscle (Figures 1B and 2B). Dixon pure-fat sequences did not reveal any concomitant hyperintense signals (Figure 1C), indicating that the hyperintense signals seen on T1- and T2-weighted MRI (Figures 1A and 2A) were that of pseudo–fatty infiltration resulting from edema formation. The measurements of fat percentage on 2-point Dixon sequences revealed that compared with time zero, there was a significant decrease in fatty infiltration at 4 weeks after surgery (16.5% ± 4.0% vs 13.8% ± 2.9%, respectively; P < .005) (Figure 3).

Magnetic resonance imaging (MRI) at 28 days after surgical release of the infraspinatus tendon. (A) T2-weighted fat-saturated MRI in the sagittal view showing edema of the infraspinatus muscle (arrow). (B) Infraspinatus muscle with a blurry aspect and slight hyperintense signal (circle) in the sagittal view of T1-weighted turbo spin echo MRI. (C) In the axial view of 2-point Dixon pure-fat MRI, no fat is visible (circle), suggesting pseudo–fatty infiltration.
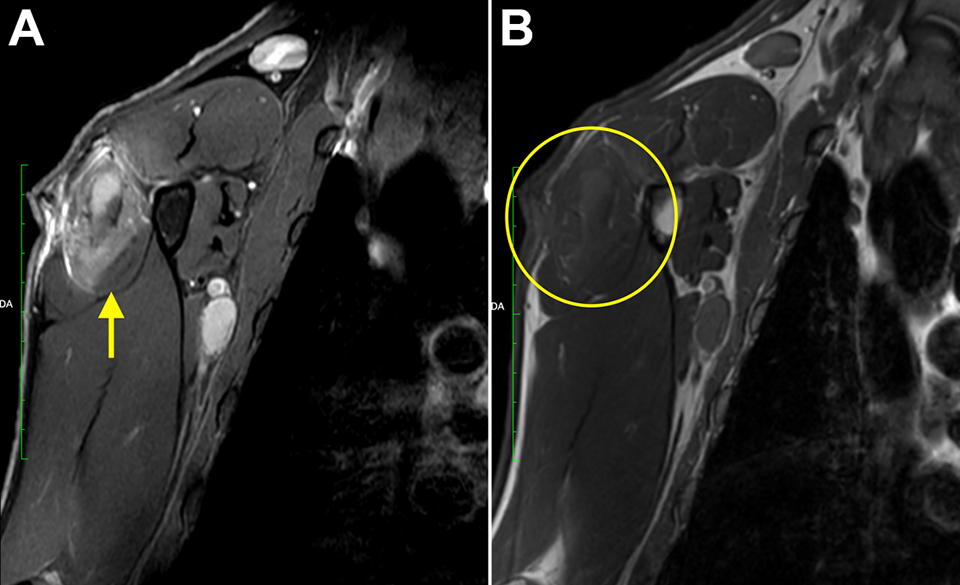
Magnetic resonance imaging (MRI) at 28 days after surgical tendon release. (A) Sagittal view of T2-weighted fat-saturated turbo spin echo MRI showing edema of retraction in the infraspinatus muscle (arrow). (B) Axial view of T1-weighted MRI showing a “ground glass” appearance of the infraspinatus muscle with a blurred aspect and slight hyperintense signal (circle).

Box plot shows that the fat content (%) within the infraspinatus muscle of the sheep decreased significantly from immediately after surgery (T0) to 4 weeks after surgery (T28). The plots illustrate median values (bold lines), interquartile ranges (boxes), and 95% CIs (whiskers). The dots represent the sheep.
Discussion
This study showed that muscle edema was associated with acute and traumatic retracted rotator cuff tears, confirming our hypothesis. Moreover, edema of retraction resulted in hyperintense signals within the retracted rotator cuff muscle, producing a characteristic appearance and mimicking fatty infiltration. Analysis revealed that compared with time zero, there was a significant decrease in fatty infiltration at 4 weeks after surgery (16.5% ± 4.0% vs 13.8% ± 2.9%, respectively; P < .005).
This is, to the best of our knowledge, one of the first studies describing in detail edema of retraction in terms of its development and characteristic radiological sign (“ground glass” appearance of muscle on MRI). Edema of retraction has 2 important implications. First, it can result in a pseudo–fatty infiltration imaging pattern. It results in hyperintense signals within the retracted rotator cuff muscle on both T1- and T2-weighted imaging. Edema of retraction can mimic the presence of fatty infiltration within the rotator cuff muscle. With true fatty infiltration, however, a corresponding hyperintense signal is expected on Dixon pure-fat sequences, 19 whereas with pseudo–fatty infiltration, there is an absence of such a hyperintense signal. In clinical practice, Dixon pure-fat sequences may not be performed routinely. It is thus important to consider that edema of retraction can potentially result in a pseudo–fatty infiltration appearance, especially when there are hyperintense signals seen on both T1- and T2-weighted sequences.
The second clinical implication of edema of retraction is its influence on fat percentage within the muscle. It has been well established in the literature that the degree of fatty infiltration progresses with time. 22 In this study, however, there was a significant decrease in the fat percentage from 0 weeks to 4 weeks after surgery. This is because of the dilution effect of edema.
Our findings are similar to those of Kim et al, 11 who found that in patients with Duchenne muscular dystrophy, the presence of muscle edema increased the fat fraction ratio and led to an underestimation of the actual amount of fat. This same effect within the rotator cuff muscle leads to underestimating fatty infiltration and consequently the Goutallier stage. Given these 2 implications, clinicians must be aware that in the presence of edema of retraction, assessments of fatty infiltration within the rotator cuff muscle can be unreliable.
There are several possible causes for the appearance of muscle edema or edema-like signal alterations on MRI in humans. These include trauma, 18 muscle denervation, 3 Parsonage-Turner syndrome, 4 infections, ischemia, myonecrosis, musculotendinous junction ruptures, 14 myopathy, and treatment-related responses. 20 These causes can produce similar appearances on fluid-sensitive imaging. 12 Edema of retraction has several differences when compared to edema associated with denervation. 4 First, in terms of timing, it has been noted that edema of retraction occurs quickly, with edema seen hours after trauma. This is in stark contrast to denervation abnormalities in which edema usually takes about 10 days before becoming apparent. 4 Second, there is a difference in the edema location. Edema can be located within the muscle (intramuscular edema) or around the muscle (perimuscular edema), with the latter being classic of acute strains. 2 In the present study, edema of retraction in the infraspinatus muscle was mainly peripheral and perimuscular, in contrast to the global involvement of edema of denervation. These radiological signs may help the clinician to better distinguish between the various causes of rotator cuff muscle edema.
We believe that this animal study has several findings that are clinically relevant. Given that the presence of fatty infiltration affects the surgical outcomes of rotator cuff tears, 6 it is critical to accurately identify fatty infiltration of the rotator cuff muscle. In the presence of a traumatic, retracted rotator cuff tear, physicians should note that hyperintense signals on T1- and T2-weighted MRI may be a form of pseudo–fatty infiltration from edema of retraction. As such, MRI, and T2-weighted sequences in particular, may not be sufficient to conclude if a rotator cuff tear is traumatic or degenerative. Muscle edema, with a characteristic “ground glass” appearance of the muscle on T1-weighted imaging, in a perimuscular or intramuscular location, can be present early in traumatic rotator cuff lesions.
Limitations
There are some limitations to this study. First, we did not examine interobserver or intraobserver repeatability of the MRI measurements. However, previous intraobserver analysis has shown an excellent intraobserver correlation for the volume calculation and fat fraction. 5 Electromyography to exclude neurological impairments was not systematically performed. Nevertheless, it has been proven, at least in humans, that suprascapular nerve involvement is rare in the case of massive rotator cuff tears. 3 In addition, muscle edema secondary to denervation presents differently than that of edema of retraction. This is an important avenue for further research to determine the factors that predispose patients to edema of retraction. Moreover, and despite previous validation, 7 –9 our animal model may not be extrapolated to humans because sheep bear weight on their operative limb. Finally, this study lacked a follow-up longer than 4 weeks, and we did not provide information after the repair and resolution of the MRI phenomena. A longer follow-up should provide valuable knowledge.
Conclusion
Edema of retraction appeared hours after a traumatic rotator cuff tear in this sheep model. The location of this edema was often peri- or intramuscular, and it presented as a characteristic “ground glass” appearance of the muscle on T1-weighted sequences. In traumatic situations, physicians should be aware that this edema can result in a form of pseudo–fatty infiltration, as it was associated with hyperintense signals on both T1- and T2-weighted sequences, and it can be mistaken for fatty infiltration. Using the appropriate imaging technique could provide reliable diagnosis and treatment.
Footnotes
Final revision submitted September 27, 2022; accepted October 21, 2022.
One or more of the authors has declared the following potential conflict of interest or source of funding: This study was supported by FORE. A.L. has received consulting fees from Arthrex, Medacta, and Stryker and is the founder of FORE, BeeMed, and Med4Cast. AOSSM checks author disclosures against the Open Payments Database (OPD). AOSSM has not conducted an independent investigation on the OPD and disclaims any liability or responsibility relating thereto.
Ethical approval for this study was obtained from the regional ethics committee of the canton of Zurich (No. ZH018/19).