
Abstract
Background:
Increased activity level is generally reported to be positively related to improved knee function after knee surgery. However, little research has been conducted into this relationship on an individual patient basis, or the influence of demographic and psychosocial factors such as patient affect—the subjective experience of emotion.
Hypothesis:
The relationship between postoperative activity level and knee function will vary between patients and will be influenced by the patients’ affect and demographic characteristics.
Study Design:
Cohort study; Level of evidence, 3.
Methods:
Activity, knee function, demographic, and affect data were collected from patients enrolled in an ongoing trial for the treatment of articular cartilage lesions at preoperative and 2-, 12-, and 15-month postoperative points. Quantile mixed regression modeling was used to determine the patient-to-patient variation in activity level and knee function. Multiple linear regression and partial correlation analyses were performed to determine whether demographic characteristics and patient affect were associated with this variation.
Results:
A total of 62 patients were included in the study (23 female; 39 male; mean age, 38.3 ± 9.5 years). We found substantial variation between patients in the relationship between activity level and knee function, with most patients (n = 56) demonstrating a positive relation (positive slope), but 6 patients demonstrating a negative relation (negative slope). A negative affect (NA) score was significantly correlated with the slope between activity level and knee function (r S = –0.30; P = .018) and was a significant individual predictor of knee function at 15 months postoperatively (coefficient = –3.5; P = .025).
Conclusion:
Our results suggest that the relationship between activity level and knee function varies between patients. The patients with a higher NA score were likely to report smaller improvements in knee function with increasing activity levels compared with those with a lower NA score.
Lesions of the articular cartilage (AC) are common in the human knee and can cause pain, swelling, functional impairment, and a reduction in quality of life. 53,58 AC has a relatively poor capacity for self-repair, and untreated lesions can predispose the joint to further cartilage loss and to the early onset of osteoarthritis. 17,22,23,32 Several surgical techniques have been developed to treat AC lesions, ranging from palliative approaches to cell-based interventions (eg, autologous chondrocyte implantation), each with its specific indications regarding defect size, depth, and location. 5,34
Regardless of the technique employed, several factors are believed to contribute to the success or failure of cartilage repair surgery. Preoperative demographic and clinical characteristics, such as patient age, the number of defects, defect size and location, symptom duration, and number of previous surgeries, have all been suggested as prognostic or predictive of the outcomes of cartilage repair surgery. 11,13,53 Several studies have suggested that postoperative activity levels also contribute to the outcome of cartilage repair surgery, reporting that patients who are more active in the postoperative period are more likely to demonstrate clinical success. 26,27,29 Although these studies report a general trend for a positive relationship between postoperative activity level and clinical outcome across their patient cohorts, there is little investigation into this relationship for individual patients or the degree of variation between patients.
The idea of patient-to-patient variation in this association was originally highlighted by Tegner and Lysholm 49 in their 1985 publication, in which the authors introduced an activity scale—the Tegner scale—to complement the knee function score. They reported that although there was a generally positive relationship between the 2 scores, almost 20% of patients with a low activity level had a high functional score, suggesting that limitations in knee function may be masked by a low activity level. 49 In a later publication, they further stressed that the functional score (Lysholm score) should be regarded in relation to the activity level (Tegner scale). 50 In this way, patients who have reached a desired high activity level and have a high Lysholm score probably have better function than patients with a high Lysholm score who have a low activity level. 50 Further, anecdotal reports from patients attending postoperative appointments in our institution suggested even more variation between patients in this relationship, with some patients reporting a low Lysholm knee score precisely because they had been more active. Conversely, less active patients may report a higher functional score because they demand less from their recovering knee. Thus, a low functional score can be masked by a low activity level. These observations highlight the importance of taking individual activity levels into account for an accurate assessment of knee function.
Psychosocial factors are also reported to influence the functional outcomes of knee surgery, in addition to influencing activity level. 7,8,20,36,37 Although these reports have largely focused on rehabilitation outcomes after anterior cruciate ligament reconstruction, we suspected that the same factors could play a role in influencing outcomes after cell-based AC repair surgery. Psychological constructs, such as the fear of reinjury, pain-catastrophizing, and self-efficacy, are but a few that have been shown to influence postoperative activity level, return to sport, functional outcome, and pain after ligament reconstruction surgery 7,8,18,20,51,55 or surgery for other orthopaedic conditions. To our knowledge, only Ebert et al 14 have reported on the influence of such constructs on the outcome of orthopaedic cell therapies. Those authors reported that preoperative mental health-related quality of life, determined using the 36–Item Short Form Health Survey, correlated with the Sport and Recreational Activities component of the Knee injury and Osteoarthritis Outcome Score at 5 years after matrix-assisted autologous chondrocyte implantation. 14
We hypothesize that the relationship between activity level and knee function will vary on an individual patient basis and will be influenced by patient attributes, such as demographics and affect. The first objective of the present study was to investigate the patient-to-patient variation in the relationship between activity level and knee function in the short- to mid-term period after cell therapy for AC repair. As affect—the subjective experience of emotion—is a commonly used parameter for assessing the psyche, our second objective was to investigate the influence of negative affect (NA)—the extent to which a person feels subjective distress and unpleasurable engagement—and positive affect (PA)—the extent to which a person feels enthusiastic, active, and alert— 57 , as well as demographic factors, on this variation.
Methods
Patients, Surgical Procedures, and Rehabilitation
This study comprised 62 patients who had been referred to our institution with symptomatic chondral or osteochondral defects in the knee and had completed a 15-month follow-up assessment after receiving cell therapy treatment as part of an ethically approved clinical trial. This trial included patients aged between 18 and 80 years who had symptomatic knee AC defects <20 cm2 in area, extending down to or into the subchondral bone (International Cartilage Repair Society grade 3 or 4), suitable for treatment by autologous cell implantation. Defects were assessed initially via cartilage-specific magnetic resonance imaging sequences and in consultation with an independent radiologist with extensive expertise in musculoskeletal imaging.
The clinical trial aimed to compare 3 treatments: (1) traditional autologous chondrocyte implantation (second generation); (2) implantation of autologous bone marrow-derived stromal cells; and (3) implantation of a 1 to 1 combination of the 2 cell types. 43 Patients were randomly allocated to 1 of the 3 treatments, and all underwent a 2-stage surgical procedure. In the first stage, the required cells were harvested: chondrocytes were isolated from an arthroscopically collected cartilage biopsy, and bone marrow-derived stromal cells were isolated from bone marrow aspirate collected from the iliac crest. Both cell types were separately expanded in monolayer culture before being implanted into the defect beneath a commercially available porcine collagen membrane (Chondro-Gide; Geistlich). Patients in the study might have previously undergone a reparative procedure (eg, debridement or microfracture) to which they had an inadequate response. 43
All patients were enrolled in the OsCell Rehabilitation Program 1 after cell implantation. The program was specifically developed for the rehabilitation of patients after autologous cell implantation and consists of 5 successive phases, each with different goals depending on the time since surgery. The program comprised exercises that were aimed at progressively increasing range of motion, weightbearing, and strength as the time since cell implantation increases. 1 All patients were under the supervision of a physical therapist for at least 12 months postoperatively. The frequency of treatment sessions during this period was dictated by individual needs; however, patients were encouraged to adhere to exercises independently alongside formal one-to-one sessions.
Data Sources and Measurement
Baseline assessments were performed on the day of admission for surgery. At this time, demographic information (age, sex, body mass index [BMI], affected knee, and history of smoking) was collected, along with the modified Lysholm Knee Scale, ranging from 0 to 100 points, with higher scores indicating better function 48 ; the International Positive and Negative Affect Schedule–Short Form (I-PANAS–SF) 52,57 ; and the Human Activity Profile (HAP). 2 The I-PANAS–SF consists of 10 items, 5 of which assess NA (upset, hostile, ashamed, nervous, and afraid) and 5 of which assess PA (alert, inspired, determined, attentive, and active), and participants are asked to indicate the extent to which they generally feel each of the emotions listed on a 5-point scale. The HAP is a 95-item self-reported measure of energy expenditure. The same 3 scores were collected at the 2-, 12-, and 15-month time points after cell implantation.
The completed HAP scoresheets were used to calculate an adjusted activity score (AAS), ranging from 0 to 94 points, with higher scores indicating greater activity level, 10 for each patient at each of the 4 time points. The completed I-PANAS–SF scoresheets were used to calculate a separate value for NA and PA, both ranging from 5 to 25 points, with higher scores indicating stronger affect, for each patient at each of the 4 time points. Rather than a specific mood, affect reflects a person’s general disposition and is considered stable over time. 57 However, the temporal stability of the I-PANAS–SF has only previously been investigated over 8 weeks, 52 not over a period as long as 15 months as in our study, and certainly not including a major medical intervention. 52 We, therefore, investigated longer-term temporal stability as part of the present study.
Statistical Analyses
Nonparametric tests and robust analyses were used throughout because the AAS and PA data and the values for the individual patient slopes between the AAS and Lysholm scores were nonnormally distributed according to quantile-quantile plots. Descriptive statistics (medians and interquartile ranges) were used to assess general trends in the Lysholm, AAS, PA, and NA data. A mixed effects model and Wilcoxon signed-rank tests were used to assess differences in consecutive scores, as well as differences between the baseline and end point (15-month) scores.
The temporal stability of PA and NA over the course of the study was assessed separately using mixed modeling, intrarater reliability, and Bland-Altman analysis. Intrarater reliability was determined as the intraclass correlation coefficient (ICC) for an agreement based on a 2-way analysis of variance model of the 4 time points. 33 Bland-Altman plots were created by plotting the means of the paired baseline and 15-month scores ([15-month score + baseline score]/2) against the differences between the 2 scores (15-month score – baseline score) for NA and PA separately. A value for the mean difference (estimated bias) between the scores at these 2 time points, as well as values for the upper (mean + 1.96 SDdiff) and lower (mean – 1.96 SDdiff) limits of agreement, were determined from the plots, where SDdiff is the standard deviation of the difference. The limits of agreement on the Bland-Altman plots coincided with the Reliable Change Index (RCI), an index that is commonly used to find whether patients have undergone a clinically meaningful change 12 but is also used to demonstrate temporal stability by a lack of change. 15,56 As a result of these analyses, the mean NA and PA for each patient across the 4 time points was used in the subsequent analyses, rather than concurrent NA and PA scores.
AAS values were centered by group-mean centering, subtracting the overall mean AAS value (65 points) from the individual AAS data points to reduce the correlation between the (random) slopes and intercepts of the variables, thus improving convergence and facilitating interpretation of the results. 38 A linear-quantile mixed regression analysis was then performed using the Lysholm score as the dependent variable and the centered AAS as the independent variable to model the patient-level relationships between activity level and knee function. Quantile regression models make no assumption about the distribution of the outcome. 19 The resulting patient-specific slopes were determined and used as summary measures for the relationship between the Lysholm and AAS scores.
The data from the 2-month time point were excluded from subsequent analyses because of the presence of additional confounding variables at this stage compared with the later time points. In particular, at 2 months postoperatively, the rehabilitation protocol was still very restrictive (weightbearing up to 50% of body weight), 1 which would have influenced the correlation between function and activity.
Correlation Analyses
Nonparametric correlation analyses (Spearman rank correlation coefficient; r S) were used to assess the association between the patient-specific slopes from the robust linear multilevel model and the mean NA and PA for each patient. Subsequent multiple linear regression and partial correlation analyses were performed to determine whether demographic factors (age, sex, BMI, and smoking status) influenced the slopes, in addition to psychosocial factors (NA and PA). Finally, multiple linear regression and partial correlation analyses were performed to identify demographic and psychosocial factors that may influence the 15-month postoperative outcomes (Lysholm and AAS) individually. Baseline values for each of the outcome scores were included as covariates for these analyses.
All data analyses were performed using R Version 3.6.1 (R Foundation for Statistical Computing) and the packages nlme, ppcor, and lqmm. 19,25,28,41 The threshold for statistical significance was set at P < .05.
Sample Size Analysis
Before testing the primary hypothesis that the relationship between activity level and knee function varies between patients, the required sample size was calculated using Monte-Carlo simulations of a mixed-effect model (using R, V 3.3.3 and simr package) based on relevant pilot data from an initial study of the first 28 patients who attended their 15-month follow-up appointment. 21,42 Data in the pilot study were collected at 3 time points (baseline and 12-month and 15-month follow-ups), and we aimed for at least a power of 80% at a 2-sided P value of .05. To address the secondary objective, identifying predictors of the slope, a sample size was determined to detect a significant correlation at the 2-sided P = .05 level with an 80% power if the variable explains at least 15% of the variation in the relationship between activity level and knee function (r 2 = 0.15; r = 0.39) using 16,42 G*Power (V 3.1.9.2; Heinrich Heine University of Düsseldorf, Germany). According to these analyses, a sample size of 20 patients would give a 92% power to detect a significant variation in slopes between activity and function. Determining predictors of the slope required a sample size of 50 patients. To determine the limits of agreement (d – 1.96 SD and d + 1.96 SD), with a precision of ±0.5 SD, a sample size of 51 patients was required. Based on this analysis, we decided to include the first 62 patients recruited into the clinical trial.
Results
Participant Characteristics and Outcome Scores
The 62 patients in our study had a mean age of 38.3 years, and the majority (n = 39/62) were men (Table 1). The Lysholm score in the patient cohort increased significantly from baseline to 15 months postoperatively (median increase, 22.9 [95% CI, 16.7-31.2]; P < .001) (Table 2). There was a significant increase in the Lysholm score between the 2- and 12-month follow-ups (median change, 20.8 [95% CI, 14.6-25]; P < .001), but no significant differences were found between any other consecutive time points. The AAS increased significantly from baseline to 15 months postoperatively (median change, 8 [95% CI, 4.5-13]; P < .001). There was a significant drop in the AAS from baseline to 2 months (median drop, 7.5 [95% CI, 2.5-11.5]; P < .001), followed by an increase between 2- and 12-month follow-ups (median increase, 17 [95% CI, 13.5-31.5]; P < .001), but there was no evidence for a change in the final period. The median scores for both NA and PA across the patient cohort demonstrated only minor fluctuations over the course of the study, and there were no statistically significant differences in either construct between any consecutive time points.
Baseline Demographic Parameters a
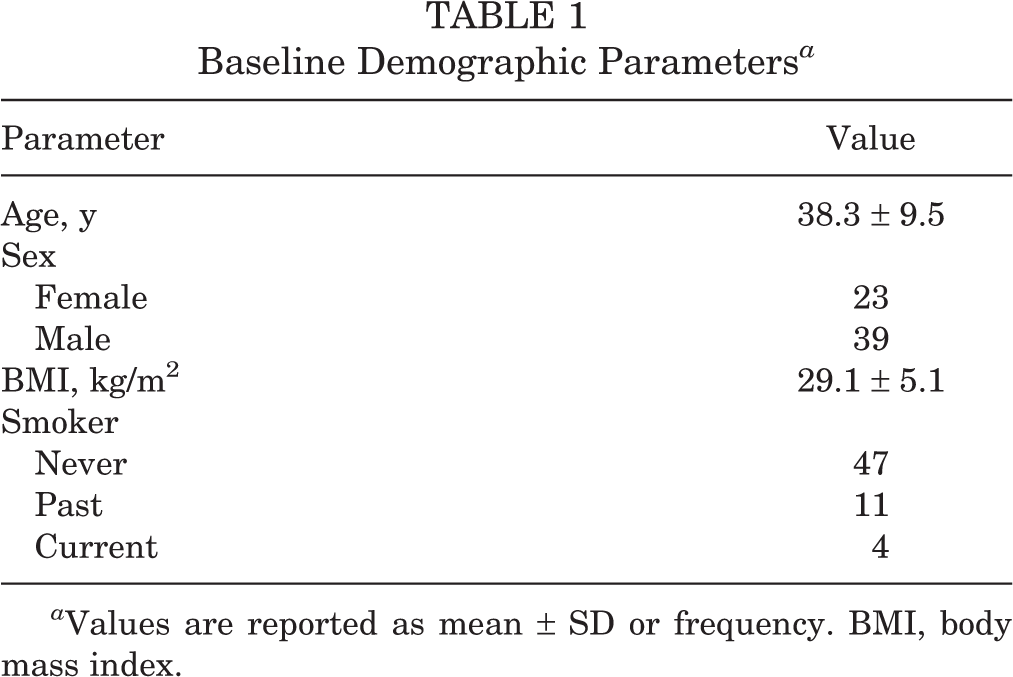
a Values are reported as mean ± SD or frequency. BMI, body mass index.
Outcome Scores at Baseline and 15 Months a

a Outcome scores are reported as median (interquartile range). CIs and P values are based on the Wilcoxon signed-rank test; bold P values indicate statistically significant differences from baseline to the 15-month follow-up (P < .05). AAS, adjusted activity score; NA, negative affect; PA, positive affect.
I-PANAS-SF Temporal Stability Analyses
The changes in the NA and PA scores over time were normally distributed and thus suitable for the Bland-Altman approach. The Bland-Altman analysis demonstrated a good agreement between the baseline and 15-month NA and PA scores (mean difference, 0.51 and -0.28, respectively) (Table 3). The Bland-Altman plots showed a good spread of points above and below zero, suggesting no clear relationship between the difference and the mean value. Because the mean differences between the 2 time points were so small, the upper and lower limits of agreement effectively served as the thresholds (RCI) to detect a clinically meaningful change. Based on these thresholds, 3 patients had a clinically meaningful increase and 1 had a clinically meaningful decrease in the NA score. One patient and 3 patients had a clinically relevant increase and decrease in the PA score, respectively (Table 3). Intrarater reliability analysis also demonstrated a good agreement between the NA and PA scores at the 4 time points.
Results of I-PANAS–SF Temporal Stability Analyses a

a ICC, intraclass correlation coefficient; I-PANAS–SF, International Positive and Negative Affect Schedule–Short Form; NA, negative affect; PA, positive affect.
Variation in Lysholm-Activity Slope Between Patients
We fitted 3 separate quantile mixed models, 1 with a random intercept, 1 with a random slope, and 1 with a random intercept and slope. Based on the Akaike information criterion, the model with random slope fitted the data best (Akaike information criterion, 1444.7, 1438.4, and 1354.9 for a model with random intercept, random slope, and random intercept + slope, respectively; P <.001) using the likelihood-ratio test comparing the model with random intercept + slope versus random intercept or random slope. The median (fixed effects) slope between the AAS and Lysholm scores was positive (0.97 [95% CI, 0.79-1.14]; P < .001), indicating that the median relationship between activity level and knee function was positive across the patient cohort. However, the interpretation of the individual patient slopes suggested that there was substantial variation in this relationship between patients, with 6 patients even demonstrating a negative slope (Figure 1).

Plots of the individual patient plots resulting from a quantile mixed model with random intercept and slope of the data set, excluding the 2-month follow-up. The plots represent the individual relationship between activity level and knee function (Lysholm score) at the 3 time points assessed (baseline, 12 months, and 15 months). The median (fixed effects) slope between the AAS and Lysholm scores was positive (0.97 [95% CI, 0.79-1.14]; P < .001). The majority (n = 56) of patients demonstrated a positive slope, but 6 patients (patients 11, 20, 30, 44, 47, and 61) demonstrated a negative slope. AAS, adjusted activity score.
Factors Influencing Variation Between Patients
The individual patient slopes that resulted from quantile mixed modeling were significantly correlated with the patient’s mean NA (r S = –0.30 [95% CI, –0.51 to –0.05]; P = .018), but not with the mean PA (r S = 0.04 [95% CI, –0.21 to 0.29]; P = 0.74) (Figure 2). When taking into a level and knee function demographic factors (age, sex, and BMI), a larger mean NA was still correlated negatively with individual patient slope, judging by a partial correlation coefficient almost identical to its correlation coefficient (partial r S = –0.28 [95% CI, –0.50 to –0.01]; P = .056). The partial correlation coefficient of the mean PA was near zero (partial r S = –0.01 [95% CI, –0.28 to 0.25]; P = .92).

A scatter plot to demonstrate the correlation between individual patient slopes and mean NA scores, with the 2-month follow-up data excluded. The slope was used as a measure with which to summarize the relationship between activity level and knee function at baseline and 12-month and 15-month follow-ups. Slopes created from these 3 time points were significantly correlated with the mean NA (r S = –0.30 [95% CI, –0.51 to –0.05]; P = .018). PANAS, Positive and Negative Affect Schedule–Short Form. NA, negative affect.
Predictors of Postoperative Outcomes
Multiple linear quantile regression analyses revealed that the best individual predictors of the 15-month Lysholm score were mean NA and male sex (Table 4). The best predictors of the 15-month AAS were baseline AAS and male sex (Table 4).
Results of Multiple Linear Regression Analyses to Determine Predictors of the 15-Month Lysholm and AAS Scores a

a Results are based on quantile regression. Bold P values indicate statistical significance (P < .05). AAS, adjusted activity score; BMI, body mass index; NA, negative affect; PA, positive affect. Dashes indicate not applicable.
Discussion
We were able to demonstrate that there was an overall positive relationship between activity level and knee function across the patient cohort. Over the period assessed (from preoperatively to 15 months postoperatively), a higher patient-reported activity level (AAS) correlated with higher patient-reported knee function (Lysholm score). An overall positive relationship between activity level and knee function was expected in this study and is supported by previous reports in the literature, with several publications reporting on the correlation between increased physical activity level and knee function in the postoperative period. 26,29,54
However, our results also showed that the relationship between activity level and knee function varied substantially between patients, as indicated by the variation in slope on the individual patient plots. Indeed, 6 patients even demonstrated a negative slope, indicating a negative relationship between activity level and knee function in a small number of patients. This finding highlights the importance of individualized rehabilitation strategies, as patients with a lower slope (ie, a less positive relationship) between the AAS and Lysholm scores are likely to report smaller improvements in knee function with the same increase in activity level compared with those with a greater slope (ie, a more positive relationship).
It would be of use to be able to identify the 10% of patients who have a negative relationship preoperatively to enable patient stratification for both treatment and rehabilitation. Thus, the second aim of the present study was to identify and examine demographic and psychosocial factors that could predict the magnitude of the slope between the AAS and Lysholm scores and therefore predict the relationship between activity level and knee function for individual patients.
We focused on the patients’ affect and their general disposition to life, which is considered to be stable over time. 57 However, stability during periods spanning over a year, during which the patient had major surgery, had not been investigated. While not a foreseen outcome of the present study, we were able to independently demonstrate the temporal stability of both dimensions of the I-PANAS–SF (PA and NA) over the course of the study (15 months). It has been reported previously that the scoring system was temporally stable over a period of 2 months, judged from a significant test-retest correlation between the baseline and 2-month follow-up scores collected in a study of 143 volunteers (r = 0.84; P < .01 for both NA and PA). 52 While we found lower ICC values than those reported by Thompson, the cohort assessed in that study consisted of volunteers with no reported health issues and over a shorter time. 52 In contrast, the present study included a longer time frame and the participants also had a varying degree of knee pain and dysfunction and underwent major knee surgery during the period over which stability was assessed. Judged by the criteria 9 commonly used to assess test-retest reliability (fair ICC, 0.40-0.59; good ICC, 0.60-0.74), NA would be regarded as fair and PA good, which is remarkable considering the patients’ experiences over this period.
These findings are supported by a recent study that investigated the stability of PA and NA (measured using the day reconstruction method, rather than the I-PANAS-SF) in a representative sample of the German population (n = 2504) and also reported a significant test-retest correlation between baseline scores and a 2-year follow-up 24 (NA: r = 0.60; PA: r = 0.44). Moreover, we also demonstrated that the number of patients who did undergo a clinically and statistically relevant change, as indicated by the RCI, was no larger than one would expect by chance alone. Although the sample size of the present study was relatively small (n = 62), the stability of the I-PANAS–SF over 15 months that included cell implantation surgery and subsequent rehabilitation, highlights the utility and robustness of the construct of patient affect and the I-PANAS–SF scoring system for use in research of surgical interventions.
The patients’ mean NA correlated negatively with the slopes resulting from quantile mixed modeling, with a higher mean NA being the best predictor of a lower slope, even when accounting for demographic and clinical factors. These results suggest that patients with a higher mean NA score are more likely to report smaller increases or even a decrease in perceived knee function with increasing activity level, and vice versa. Several psychosocial constructs, including NA, have been previously reported to correlate with knee function and activity level independently, both in patients who had undergone surgery 7,8,20,31,36,46,51,54 and in patients who had not. 40,55 To our knowledge, our study is the first to report the influence of these constructs on the relationship between the 2. Our findings suggest that NA acts as a moderator for the relationship between activity level and knee function and is therefore highly important in the rehabilitation period, in which success is commonly judged by an increase in activity level and knee function. Interestingly, the mean PA was not significantly correlated with slope by any of the analyses used in the present study. While the published literature reports a range of findings regarding the relationship between PA, activity level, and knee function, our finding that NA, but not PA, has a significant relationship with slope, does corroborate reports that PA and NA are largely independent and uncorrelated constructs. 35,57
Finally, we sought to identify which of the demographic, clinical, and psychosocial factors investigated in this study could predict the individual 15-month outcome measures, Lysholm score, and AAS. We found that mean NA and male gender were the best individual predictors of the 15-month Lysholm score. This finding corroborates an earlier finding that mental health-related quality of life as measured by the 36–Item Short Form Health Survey is predictive of clinical outcomes following cell implantation. 14 Crucially, however, the present study demonstrates that a specific component of the general disposition to life (NA), and not only mental health-related quality of life, predicts outcome, thus complementing the earlier findings. Of the other factors assessed, we were most surprised to find that the baseline Lysholm score, which could be taken as a proxy of preoperative disease severity, had no predictive value for the outcome of cartilage repair, especially as other reports suggest that the baseline Lysholm score does influence outcome after 1 year. 13,30 Demographic factors that have previously been reported to influence the success of cartilage repair surgery also held no predictive value for the outcomes in this study, 13,30,53 but our study involved a relatively small number of patients compared with previous studies.
The strong predictive nature of NA identified by our study suggests that if one could improve a patient’s NA score, one could improve the outcomes of cell therapy. Techniques such as cognitive behavioral therapy (CBT) have been employed to significantly reduce NA as a treatment modality in mental health conditions characterized by high NA, such as anxiety and depressive disorders. 4,47 Therefore, CBT may also be a viable option to reduce NA in patients who are identified as having a high NA score before cartilage repair surgery to improve outcomes. Interestingly, preoperative CBT has been reported to improve postsurgical pain, disability, and other psychosocial constructs, such as pain catastrophizing after lumbar spinal fusion, cardiac surgery, and total knee replacement. 6,39,44,45 However, there appears to be a slight disconnect in the literature, as none of the published work that describes the benefits of preoperative CBT discusses possible reasons for the beneficial effect. Despite the reported benefit of CBT in reducing NA in the literature in the psychological field, there is no mention of NA and the possibility that the reduction of this psychosocial dimension is responsible for improved results in the surgical literature. In the present study, therefore, we provide a possible missing link, suggesting that CBT may be beneficial as a preoperative intervention for many orthopaedic or indeed other surgical procedures because it can reduce NA. Before this can be implemented, however, further research would be required to determine the efficacy of such an intervention and to establish criteria for its use—for example, a threshold NA score. Additionally, discussions with the whole care team would be required to establish willingness to include CBT in the clinical care plan.
Limitations
The main limitation of the present study was the use of short-term follow-up time points, the longest of which was 15 months postoperatively, which is considered to be relatively short for assessing the outcomes of cell-based cartilage repair. While the patients involved in the clinical trial continue to have their knee function assessed on a long-term basis, the additional data utilized in addressing the present study objectives (I-PANAS–SF and HAP) were not collected after this time point. While longer-term follow-up would be of interest, previous research at our center indicated that knee function after autologous cell implantation improves during the first 15 months postoperatively, after which point no further change is observed up to 9 years postoperatively. 3 This finding informed the choice of time points at which outcomes were collected in the clinical trial, data from which were utilized in the present study. A further limitation of the present study was the use of activity data collected using a patient-completed scoring system, thus limiting the objectivity of these data. Future studies may benefit from the use of objective measures of activity, and the rapid development of wearable technology over recent years means that the use of activity trackers in studies such as this is a realistic possibility. We are currently undertaking such a study to investigate short-term variations in knee function in a range of patients with knee conditions. Specifically, we are seeking to assess the influence of activity level—measured using wearable activity trackers—and psychosocial factors on these fluctuations.
Conclusion
Our results suggest that the relationship between activity level and knee function varies between patients. Additionally, patients with a higher NA score were likely to report smaller improvements in knee function with increasing activity levels compared with those with a lower NA score. Psychosocial factors such as affect may influence the success of treatments for cartilage repair in the knee and, therefore, more credence should be given to these elements in preoperative planning and during rehabilitation.
Footnotes
Acknowledgment
The authors are indebted to all involved in the establishment and running of the clinical trial from which the data analyzed in the present study were gathered. In particular, the authors thank Johanna Wales (trial manager) and Barbara Linklater-Jones (research nurse) for making possible the collection of study data and for advising early on in the study. The authors express gratitude to consultant radiologist Dr Bernhard Tins for the assessment of cartilage defects in the trial, and to Mike Williams for maintaining and managing the trial database and enabling data acquisition.
Final revision submitted August 30, 2022; accepted October 11, 2022.
One or more of the authors has declared the following potential conflict of interest or source of funding: This study was funded by the Orthopaedic Institute Ltd (grant No. RPG143), Versus Arthritis (grant No. 18480, 19429, and 21156), and the Medical Research Council (grant No. MR/L010453/1 and MR/N02706X/1). AOSSM checks author disclosures against the Open Payments Database (OPD). AOSSM has not conducted an independent investigation on the OPD and disclaims any liability or responsibility relating thereto.
Ethical approval for this study was obtained from the National Health Service Health Research Authority (ISRCTN98997175).