
Abstract
Background:
The tibial tuberosity (TT) in the axial plane is located on a curved line along the anterior cortex of the proximal tibia. Therefore, the linear measurement of TT position may not fully reflect TT malposition.
Purpose:
To introduce TT–rotational angle (TT-RA) as a new anatomical parameter, which means the rotation of the TT relative to the dorsal condylar line of the tibia, and to validate its predictive value for patellar dislocation.
Study Design:
Cross-sectional study; Level of evidence, 3.
Methods:
Included were 46 patients with a history of patellar dislocation and 46 age- and sex-matched controls who underwent axial magnetic resonance imaging. Seven radiological parameters were measured and compared between the 2 groups, including TT–trochlear groove (TT-TG) distance, tibial tubercle–posterior cruciate ligament (TT-PCL) distance, TT-PCL ratio, TT lateralization (TTL), trochlear groove medialization (TGM), TT-RA, trochlear groove–posterior condylar axis angle (TG-PCA), and knee rotation. The predictive values of parameters for patellar dislocation were assessed using multiple logistic regression analysis.
Results:
The intra- and interobserver correlation coefficients for measuring the radiographic parameters showed good to excellent values., respectively. There were significant differences in the TT-TG distance (13.9 vs 6.8 mm; P < .001), TT-RA (16.0° vs 9.1°; P < .001), TG-PCA (93.7° vs 95.4°; P = .017), and knee rotation (0.9° vs 5.3°; P < .001) between the 2 groups. However, there was no significant difference in TT-PCL distance (20.7 vs 19.4 mm; P = .075), TT-PCL ratio (28.0% vs 26.6%; P = .136), TTL (65.7% vs 64.9%; P = .270), or TGM (54.9% vs 55.0%; P = .923). Multivariable analysis showed that 3 parameters were significantly associated with patellar dislocation: TT-RA (OR, 1.57; P < .001), TT-TG distance (OR, 1.52; P = .002), and knee rotation (OR, 0.75; P = .022).
Conclusion:
The TT-RA was a reliable predisposing parameter of patellar instability. It can be an alternative method of measurement when the TT-TG distance is not clearly defined.
The tibial tuberosity (TT)–trochlear groove (TT-TG) distance is commonly used for the assessment of TT lateralization (TTL) in patients with patellar dislocation. 9,12,18,29 However, recent studies have suggested that the TT-TG distance is affected by several factors, such as knee rotation, femoral anteversion, and trochlear groove medialization (TGM), rather than TTL alone. 1,3,7,16,23,30 In addition, it is difficult to measure the TT-TG distance in patients with trochlear dysplasia because the deepest point of the trochlea is unclear in these patients. 10,27 Therefore, using it as a single surgical indicator of TT medialization may not be reliable. To overcome these limitations, several parameters have been proposed. 6,14,20,31
The anterior cortex of the proximal tibial section is not straight. The TT in the axial plane is located on a curved line along the cortex rather than a straight line. A tibial tubercle torsion has been proposed as another parameter for representing TT malposition, 5,6 which represents a curved location of the TT relative to the femoral posterior condylar axis. However, as a tibial tubercle torsion can also be affected by the relative rotation between the femur and tibia, this parameter cannot fully represent the malposition of TT itself. To minimize the influence of tibiofemoral rotation, it is necessary to define the TT position using only anatomical landmarks of the tibia.
The purpose of this study was to introduce the tibial tuberosity–rotational angle (TT-RA) as a new anatomical parameter, which represents the curvilinear location of the TT itself, and to validate its predictive value for patellar dislocation. We hypothesized that the TT-RA would be significantly higher in patients with patellar instability than those without patellar instability.
Methods
Patients
This was a retrospective, case-control study. Ethical approval was obtained from the institutional review board of our hospital. Because of the retrospective nature of the study, informed consent was not obtained. Records of patients with a history of patellar dislocation between February 2005 and July 2021 were reviewed, and patients who had undergone magnetic resonance imaging (MRI) within 1 month of dislocation were enrolled in this study. A control group comprised age- and sex-matched patients who had surgery for isolated meniscal tears, with no history of patellar dislocation. The exclusion criteria for both groups were as follows: (1) other combined ligaments or bony injuries, (2) previous knee surgeries, and (3) poor-quality MRI.
The patient group (patellar dislocation [PD] group) included 46 patients (46 knee joints; 17 men, 29 women; mean age, 21.0 ± 7.9 years). Eighteen patients reported that the dislocation was their first, whereas 28 patients had a history of recurrent dislocation. The control group included 46 patients (46 knee joints; 17 men, 29 women; mean age, 22.6 ± 8.5 years).
Measurement of Radiological Parameters
Novel Parameters
Tibial Tuberosity–Rotational Angle
The TT-RA was defined as the angle between the dorsal condylar line and the line passing through the patellar tendon (Figure 1). First, we drew the dorsal condylar line of the tibia as described by Galland et al, 11 at the most inferior section in which the posterior cruciate ligament was clearly identified. Next, a line was drawn between the medial and lateral edges of the patellar tendon at the most proximal section of the complete tendon insertion at the tibial tubercle.

Measurement of the tibial tuberosity–rotational angle (TT-RA). (A) A tibial dorsal condylar line and a line between the medial and lateral edges of the patellar tendon are drawn. The angle between the 2 lines denotes the TT-RA. (B) Measurement of TT-RA on axial magnetic resonance imaging scans.
Trochlear Groove–Posterior Condylar Axis Angle
The trochlear groove–posterior condylar axis angle (TG-PCA) was defined as the angle between the posterior condylar axis of the femur and the line from the center of the posterior condylar axis to the deepest point of the trochlear groove (Figure 2).

Measurement of the trochlear groove–posterior condylar axis angle (TG-PCA). (A) The femoral posterior condylar axis with a line drawn from the center of the posterior condylar axis to the deepest point of the trochlear groove. The angle between the 2 lines denotes the TG-PCA. (B) Measurement of TG-PCA on an axial magnetic resonance imaging scan.
Measurement of Conventional Parameters
The TT-TG distance was measured using a technique described by Schoettle et al. 19 The tibial tubercle–posterior cruciate ligament (TT-PCL) distance and ratio were measured using the method described by Seitlinger et al 20 and Tensho et al. 23 TTL was measured using a method described by Tensho et al 24 (Figure 3). TGM was measured using the technique described by Ando et al 2 and modified by the technique described by Tensho et al. 23 Knee rotation was measured by the angle between the posterior condylar lines of the femur and tibia, as defined by Tensho et al. 23 It increases when the femur is externally rotated while the tibia is fixed (Figure 4).

(A) Measurement of the tibial tuberosity–trochlear groove distance. (B) Measurement of the tibial tubercle–posterior cruciate ligament (TT-PCL) distance and ratio. The TT-PCL ratio is the value obtained by dividing the TT-PCL by the width of the tibia (TW). (C) Measurement of the tibial tuberosity lateralization (TTL). The TTL is the value obtained by dividing the lateralized distance (LD) of the tibial tuberosity by the TW.

(A) Measurement of the trochlear groove medialization (TGM). The total width of the distal femoral condyle is defined as G. The distance between the medial border of the distal femoral condyle and the bottom of the trochlear groove is defined as g. G and g are parallel to the femoral posterior condylar line. The TGM is calculated by dividing g by G. (B) Measurement of knee rotation. A femoral posterior condylar line (f PCL) and tibial posterior condylar line (t PCL) are drawn. Knee rotation is the angle between the 2 lines.
All radiographic parameters were measured by 2 orthopaedic surgeons (T.J.K. and T.J.L.) twice with a minimum 8-week interval between each measurement, on a picture archiving and communication system (INFINITT Healthcare) using a mouse cursor with automated Cobb angle measurement. The intraclass correlation coefficient (ICC) was used to determine intra- and interobserver reliability, with values ≥0.75 considered good. The average value of the measurements was used in the analysis.
Statistical Analysis
In a pilot study with 10 patients from both groups, the mean and standard deviation of all radiological parameters were calculated. To achieve a power of 80% (P < .05), the maximum sample size required for each parameter was 40 per group, which is the value obtained from the TT-RA. For each variable, the intraclass and interclass correlation coefficients were calculated to quantify the agreement between measurements using the criteria of Cicchetti: poor, <0.40; moderate, 0.40 to 0.59; good, 0.60 to 0.74; and excellent, ≥0.75. 8
The normality of the distribution of variables was tested using the Kolmogorov-Smirnov test for all evaluation periods. The comparison of means between the 2 groups was analyzed using the Student t test. The predictive values of parameters for patellar dislocation were assessed using multiple logistic regression. First, the parameters that could potentially affect patellar dislocation were examined separately using univariate logistic regression. Stepwise backward multivariate logistic regression was then performed. Odds ratios (ORs) were obtained to represent the magnitude of the effect of the parameters on the probability of belonging to the PD group. Multicollinearity was analyzed by multilinear regression analysis using a stepwise method to check if TT-TG was closely related to other variables, especially TT-RA.
The discriminant capacity of the parameters was assessed by receiver operating characteristic (ROC) curve, describing sensitivity and specificity. Parameters were compared using the area under the ROC curve (AUC).
The statistical significance was assessed at the 5% level (P < .05). Statistical analyses were performed using SPSS for Windows (Version 20.0; IBM Corp).
Results
Both the TT-RA and the TT-TG distance showed excellent intraobserver agreement (ICCs: TT-TG distance, 0.88; TT-PCL distance, 0.92; TT-PCL ratio, 0.85; TTL, 0.80; TGM, 0.78; TT-RA, 0.93; TG-PCA, 0.83; knee rotation, 0.93) as well as good to excellent interobserver agreement (ICCs: TT-TG distance, 0.78; TT-PCL distance, 0.90; TT-PCL ratio, 0.81; TTL, 0.72; TGM, 0.77; TT-RA, 0.80; TG-PCA, 0.74; knee rotation, 0.87). There were significant differences between the PD and control groups in the TT-TG distance (13.9 vs 6.8 mm; P < .001), TT-RA (16.0° vs 9.1°; P < .001), TG-PCA (93.7° vs 95.4°; P = .017), and knee rotation (0.9° vs 5.3°; P < .001). Mean difference of TT-PCL distance between both groups was 1.3 mm, and mean difference of TT-PCL ratio was 1.4%. All parameter measurements for both groups are shown in Table 1.
Comparisons of Radiological Parameters Between the PD and Control Groups a

a Data are reported as mean ± SD. Boldface P values indicate a statistically significant difference between groups (P < .05). PD, patellar dislocation; TGM, trochlear groove medialization; TG-PCA, trochlear groove–posterior condylar axis angle; TTL, tibial tuberosity lateralization; TT-PCL, tibial tubercle–posterior cruciate ligament; TT-RA, tibial tuberosity–rotational angle; TT-TG, tibial tuberosity–trochlear groove.
On univariate analysis, 4 variables (TT-TG distance, TT-RA, TG-PCA, and knee rotation) were significantly associated with patellar dislocation (Table 2). Multivariable analysis showed that 3 parameters were significantly associated with patellar dislocation: TT-RA (OR, 1.57; P < .001), TT-TG distance (OR, 1.52; P = .002), and knee rotation (OR, 0.75; P = .022) (Table 3).
Results of the Univariable Logistic Regression Analysis a
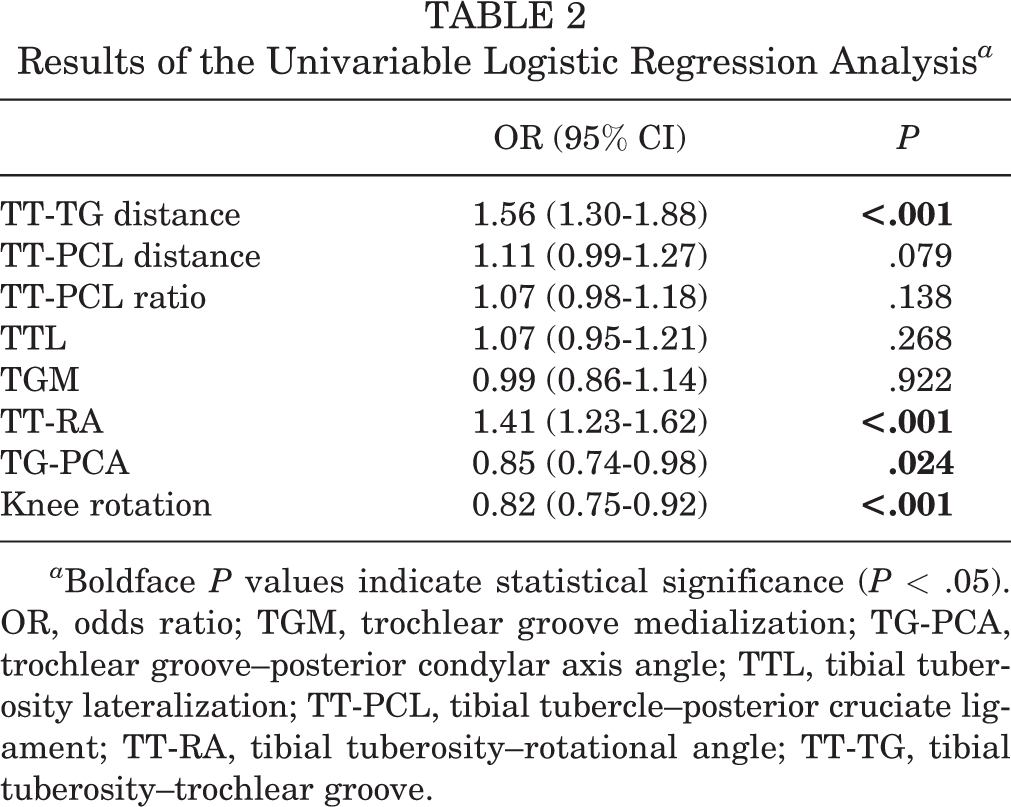
a Boldface P values indicate statistical significance (P < .05). OR, odds ratio; TGM, trochlear groove medialization; TG-PCA, trochlear groove–posterior condylar axis angle; TTL, tibial tuberosity lateralization; TT-PCL, tibial tubercle–posterior cruciate ligament; TT-RA, tibial tuberosity–rotational angle; TT-TG, tibial tuberosity–trochlear groove.
Final Model of Multivariable Logistic Regression Analysis a

a Boldface P values indicate statistical significance (P < .05). OR, odds ratio; TG-PCA, trochlear groove–posterior condylar axis angle; TT-RA, tibial tuberosity–rotational angle; TT-TG, tibial tuberosity–trochlear groove.
In the multilinear regression analysis with the TT-TG distance as a dependent variable, 4 variables (knee rotation, TT-RA, TTL, and TGM) were significantly associated with TT-TG distance. However, the variance inflation factors of all 4 variables with the TT-TG distance were lower than 10, indicating that there was no multicollinearity between the TT-TG distance and other variables (Table 4).
Results of Multicollinearity and Multiple Linear Regression Analysis for TT-TG Distance a
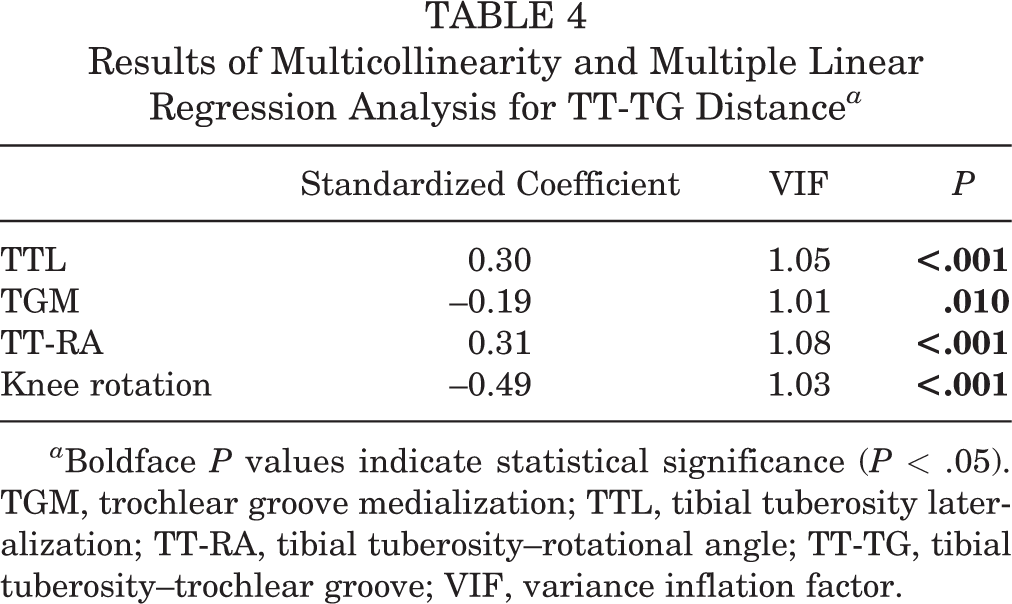
a Boldface P values indicate statistical significance (P < .05). TGM, trochlear groove medialization; TTL, tibial tuberosity lateralization; TT-RA, tibial tuberosity–rotational angle; TT-TG, tibial tuberosity–trochlear groove; VIF, variance inflation factor.
The ROC curves for TT-RA, TT-TG distance, and TT-PCL were obtained (AUCs: TT-TG distance, 0.88; TT-RA, 0.86; TT-PCL, 0.60). A cutoff value of 14.31° TT-RA showed 93.8% specificity and 70.2% sensitivity (positive predictive value, 91.7%; negative predictive value, 75.8%) (Figure 5).

Receiver operating characteristic (ROC) curve of tibial tuberosity–rotational angle (TT-RA), tibial tuberosity–trochlear groove (TT-TG) distance, and tibial tubercle–posterior cruciate ligament (TT-PCL) distance.
Discussion
As the anterior cortex of the proximal tibia is a curved line, the linear measurement of the TT position may not fully reflect TT rotation. We attempted to define the TT position using an angular parameter and investigated the association between TT-RA and patellar dislocation. In this study, we found that MRI measurement of TT-RA was highly reliable, and TT-RA in the PD group was significantly higher than that in the control group, confirming the study hypothesis. Furthermore, multivariate regression analysis showed that TT-RA was a predisposing parameter for patellar dislocation. Therefore, TT-RA can be an alternative method to determine malposition of the TT itself, and it is useful especially when measuring the TT-TG distance is ambiguous.
The TT-PCL distance was proposed to determine the true lateral position of the TT. 4,20 As the TT-PCL distance is not influenced by knee flexion or rotation, this parameter was expected to overcome the limitation of the TT-TG distance. However, a recent study reported that the TT-TG distance has a better diagnostic capacity than the TT-PCL distance. 32 In addition, the pathologic value of the TT-PCL distance seems to be associated with individual tibial size, and therefore, standardization of the TT-PCL distance with individual tibial width was proposed; this was named the TT-PCL ratio. Tensho et al 23 reported that the TT-PCL distance and ratio showed a statistically significant difference between the recurrent PD and control groups. However, the mean differences in the TT-PCL distance and ratio were too small to be clinically meaningful (TT-PCL distance, 1.9 mm; TT-PCL ratio, 2.9%). In our study, both TT-PCL distance and ratio were statistically insignificant and showed small mean differences between the PD group and control group (TT-PCL distance, 1.3 mm; TT-PCL ratio, 1.4%). We believe that this may serve as a basis for indicating the need for alternative and compensatory rotation parameters for TT-TG distance. This study may partially explain why there is no significant difference in TT-PCL distance between patients with patellar instability and healthy individuals, as a recent systematic review showed. 29 Individualized measurements of the TT-TG distance were also proposed for diagnosing a lateralized TT in patients with recurrent patellar dislocation. 15,17,21,22 TT-RA is not affected by individual tibial size; therefore, the individual variability of pathologic values may be minimized.
A recent biomechanical study suggested that internal torsion of TT osteotomy improves patellar instability. 5 Those authors developed a triangular TT osteotomy to produce isolated 30° internal torsion of the TT without medialization. They found that patellar displacement and tilt were significantly reduced. This technique also seemed to reduce the TT-RA by decreasing the tilt of the patellar tendon.
It is not clearly known whether the rotation of the trochlear groove in the coronal plane affects patellar instability. TG-PCA is a novel proposition of our study, and this parameter showed a significant difference between patients with patellar dislocation and the control group. However, the difference in the mean values between the 2 groups was less than 2°, which seems to be of little clinical significance. In addition, it was confirmed as an insignificant variable in the final multivariate regression analysis model.
Our multivariable logistic regression analysis showed that TT-RA (OR, 1.57), TT-TG distance (OR, 1.52), and knee rotation (OR, 0.75) were predictive factors for patellar dislocation. Therefore, all these factors should be evaluated in patients with patellar instability. When both the TT-TG distance and TT-RA increase beyond the cutoff value, correction of the TT malposition is indicated. When the TT-TG distance increases but TT-RA is within the cutoff value, causes other than TT malposition should be suspected. 13
Limitations
This study has several limitations. First, we analyzed the parameters using MRI, although a computed tomography (CT) scan is the gold standard for measuring the TT-TG distance. However, there are previous studies on the quantitative reliability of MRI and the correlation of CT with MRI when measuring the TT-TG distance. 25,26,28 In addition, a TT-RA may not be useful in a CT scan because the patellar tendon cannot be defined in CT images. Second, the control group included patients with meniscal injuries. However, this was not expected to affect the bony anatomical shapes. Third, other risk factors for patellar instability, such as patellar tilt, height, trochlear dysplasia, and the Q angle, were not evaluated in this study. Fourth, subgroup analysis between first-time and recurrent dislocation was not performed.
Conclusion
The findings of the current study indicated that the TT-RA was a reliable predisposing parameter of patellar instability. It can be an alternative method of measurement when the TT-TG distance cannot be clearly defined.
Footnotes
Acknowledgment
The authors thank the Medical Science Research Center and Sports Medical Center at their institution.
Final revision submitted July 27, 2022; accepted September 15, 2022.
The authors declared that they have no conflicts of interest in the authorship and publication of this contribution. AOSSM checks author disclosures against the Open Payments Database (OPD). AOSSM has not conducted an independent investigation on the OPD and disclaims any liability or responsibility relating thereto.
Ethical approval for this study was obtained from Korea University Guro Hospital (reference No. 2022GR0009).