
Abstract
Background:
Increased tibial tuberosity–trochlear groove (TT-TG) distance is an important indicator of medial tibial tubercle transfer in the surgical management of lateral patellar dislocation (LPD). Changes to TT-TG distance are determined by a combination of several anatomical factors.
Purpose:
To (1) determine the anatomical components related to increased TT-TG distance and (2) quantify the contribution of each to identify the most prominent component.
Study Design:
Case-control study; Level of evidence, 3.
Methods:
Included were 80 patients with recurrent LPD and 80 age- and body mass index–matched controls. The 2 groups were compared in TT-TG distance and its related anatomical components: tibial tubercle lateralization (TTL), trochlear groove medialization, femoral anteversion, tibiofemoral rotation (TFR), tibial torsion, and mechanical axis deviation (MAD). The Pearson correlation coefficient (r) was calculated to evaluate the association between increased TT-TG distance and its anatomical parameters, and factors that met the inclusion criteria of P < .05 and r ≥ 0.30 were analyzed via stepwise multivariable linear regression analysis to predict TT-TG distance.
Results:
The LPD and control groups differed significantly in TT-TG distance, TTL, TFR, and MAD (P < .001 for all). Increased TT-TG distance was significantly positively correlated with TTL (r = 0.376; P < .001), femoral anteversion (r = 0.166; P = .036), TFR (r = 0.574; P < .001), and MAD (r = 0.415; P < .001), and it was signficantly negatively correlated with trochlear groove medialization (r = −0.178; P = .024). The stepwise multivariable analysis revealed that higher TTL, excessive knee external rotation, and excessive knee valgus were statistically significant predictors of greater TT-TG distance (P < .001 for all). The standardized estimates that were used for evaluating the predictive values were larger for TFR compared with those for TTL and MAD.
Conclusion:
TTL, TFR, and MAD were the main independent anatomical components associated with increased TT-TG distance, with the most prominent component being TFR. The association of TT-TG distance to each component analyzed in our study may help guide surgical planning.
Keywords
Recurrent lateral patellar dislocation (LPD) is a debilitating musculoskeletal disorder among children and adolescents, especially in young female patients. 2 The incidence of LPD ranges up to 43 per 100,000, accounting for 2% to 3% of knee injuries. 4 The reported anatomical risk factors for LPD include trochlear dysplasia, patellar alta, increased tibial tuberosity–trochlear groove (TT-TG) distance, rotational deformity, and medial patellofemoral ligament insufficiency. 6,21 Of these anatomical abnormalities, TT-TG distance is of particular importance in the evaluation and treatment of LPD. 18
The TT-TG distance is measured on axial imaging to quantify tibial tubercle lateralization (TTL), which represents the lateral force vector on the patella. 19,39 It was historically believed that TTL was the leading contributor to increased TT-TG distance. 5,42 However, increases in TT-TG distance are determined by a combination of several other anatomical components, including TTL, trochlear groove medialization (TGM), torsional deformities, and coronal alignment. 5,15,33,42,43 Understanding the components of TT-TG distance is a key step in determining optimal surgical plans.
The purpose of our study was to (1) determine the anatomical components related to increased TT-TG distance and (2) quantify the contribution of each to identify the most prominent component.
Methods
Participants
Ethical approval for this study was obtained from our hospital, and informed consent was obtained from all enrolled patients. We retrospectively reviewed computed tomography (CT) images and full-length anteroposterior radiographs of the lower limb of patients seen at our institution from May 2016 to May 2021. A senior professional orthopaedic surgeon (F.W.) conducted the selection process. Ultimately, 80 patients with atraumatic LPD and 80 matched controls were included in our study.
Patients in the first group (LPD group) were required to have had at least 2 episodes of nontraumatic patellar dislocation, with physical and radiological examinations confirming the diagnoses, to meet the inclusion criteria. Patients with a history of operation or trauma, generalized joint laxity (defined as a Beighton score of ≥4 points), 35 passive hyperextension greater than 10° (bilateral testing), and patellofemoral osteoarthritis were excluded.
For each included patient with LPD, a control patient matched by age (±3 years) and body mass index (±1 kg/m2) was selected. Patients with a history of operation or trauma, a ligamentous injury, or patellofemoral instability were excluded.
Imaging
For the CT scans, the patients were placed in the supine position on the scanning table, with the knee positioned in extension with slight external rotation (up to 15°) as needed for comfort and the foot positioned in 90° of flexion. Straps were wrapped around the thigh and lower leg to avoid further rotation of the leg. A 16-detector row CT scanner (SOMATOM Sensation 16; Siemens Medical Solutions) was used. These CT scans were acquired using the following parameters: 512 × 512 matrix, 120 kV, 100 mAs, 1-second rotation time, 1-mm slice thickness, 0-mm slice skip, a 14-cm field of view, and bone kernel.
The anteroposterior radiographs were performed with the patient in a standing position. Each patient started the radiograph with the knee joint fully extended, legs shoulder-width apart, and feet and toes facing forward.
Anatomical Measurements
The CT and radiographic images were imported into a personal computer to conduct our measurements using RadiAnt DICOM software (Medical Ltd.), which has an accuracy of 0.1° and 0.1 mm. This system allows linear and angular measurements to be made on images and marked while scrolling through successive axial CT images. For each patient, we measured the TT-TG distance as well as its related anatomical parameters: TTL, TGM, femoral anteversion, tibiofemoral rotation (TFR), tibial torsion, and mechanical axis deviation (MAD). A senior orthopaedic surgeon (C.X.) and an experienced radiologist (Z.Ch.) independently conducted each measurement twice in a 2-week interval in a randomized and blinded manner. The intraclass correlation coefficient (ICC) was calculated to assess the intra- and interobserver reliability; an ICC of ≥0.75 was considered excellent.
TT-TG Distance
The TT-TG distance was defined as the distance between the deepest part of the trochlear groove and the tibial tubercle. 36 Two axial CT slices were used for calculation. The first slice, with the most prominent Roman arch, was chosen to draw the posterior condylar line of the femur (fPCL). Then, a line perpendicular to the fPCL was drawn at the deepest point of the trochlear groove (Figure 1A). On the second slice, the tibial tuberosity was measured at the level where the patellar tendon is completely in contact with the tibia. Another line was drawn perpendicular to the fPCL at the most forward point of the tibial tubercle, and the distance between the 2 vertical lines was considered the TT-TG distance (Figure 1B). For severe trochlear dysplasia, the highest point of the Roman arch was taken as an approximation for measurements.
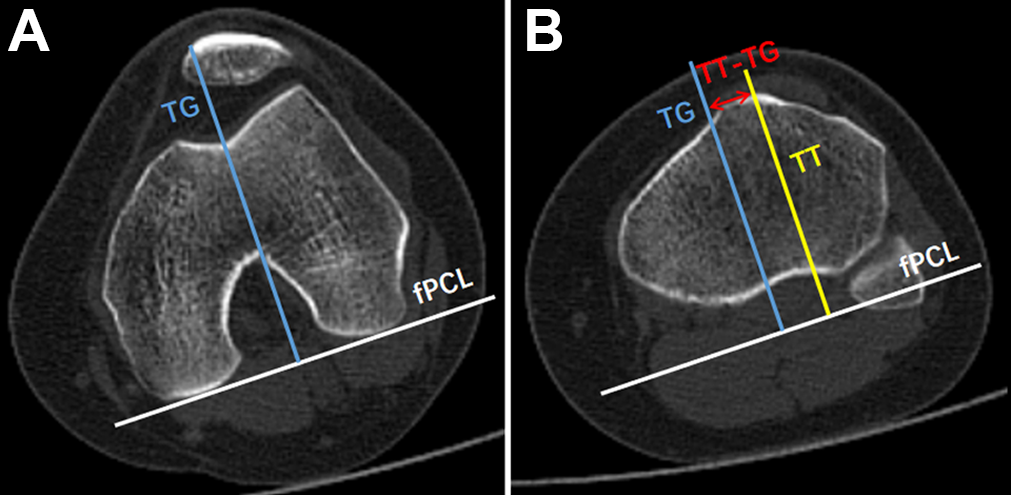
Measurement of TT-TG distance. (A) The white line indicates the fPCL. A line perpendicular to the fPCL was then drawn at the deepest point of the TG (blue line). (B) The yellow line is another vertical line of fPCL at the most forward point of the TT. The TT-TG distance (red line) is the distance between 2 lines. fPCL, posterior condylar line of the femur; TG, trochlear groove; TT, tibial tubercle.
Tibial Tubercle Lateralization
TTL assesses the lateral shift of the tubercle. 42 We chose the slice that represented the most prominent posterior condylar notch for further measurements. Then, the posterior condylar line of the tibia (tPCL) was drawn as a reference line. A line parallel to the tPCL was drawn from the medial border to the lateral border of the proximal tibial condyle to detect the maximum width (Figure 2A). The lateralization was determined as the distance between the midpoint of the patellar tendon and the medial edge of the proximal tibial condyle. The proportion was considered the TTL (Figure 2B).
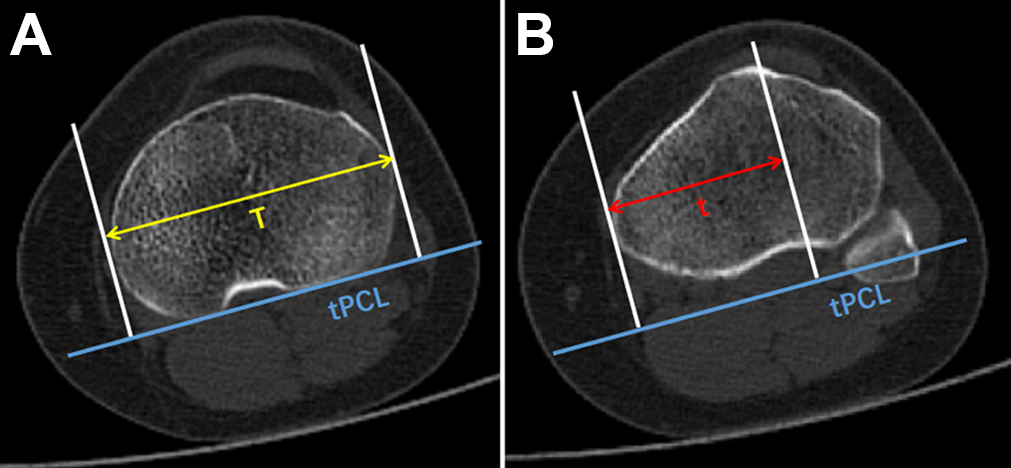
Measurement of tibial tubercle lateralization (TTL). (A) The blue line indicates the tPCL. The yellow line (T) that is parallel to the tPCL from the medial border to the lateral border of the proximal tibial represents the maximum width of the proximal tibia. (B) The red line (t) is the distance between the midpoint of the patellar tendon and the medial edge of the proximal tibial condyle. TTL was calculated as t/T. tPCL, posterior condylar line of the tibia.
Trochlear Groove Medialization
TGM assesses the medial shift of the trochlear groove. 3 The level in which the lateral epicondyle and medial sulcus could be clearly identified was selected for further measurements. A parallel line of fPCL was placed from the medial border to the lateral border of the femoral condyle to detect the maximum width. The medialization was determined by the distance between the deepest point of the trochlear groove and the medial margin of the femoral condyle; that proportion was considered the TGM (Figure 3).

Measurement of trochlear groove medialization (TGM). The fPCL was determined. The yellow line (G) parallel to the fPCL from the medial border to the lateral border of the femoral condyle represents the maximum width of the femoral condyle. The red line (g) is the distance between the deepest point of the trochlear groove and the medial margin of the femoral condyle. TGM was calculated as g/G. fPCL, posterior condylar line of the femur.
Femoral Anteversion
Femoral anteversion is defined as the angle between the femoral neck axis and the lesser trochanter axis. 37 The first image was at the level of the femur head–femoral neck junction. Briefly, the femoral neck axis connected the femoral head center and the femoral neck center (Figure 4A). The second image was at the level of the femoral lesser trochanter. The lesser trochanter axis connected the femoral shaft center and the lesser trochanter center (Figure 4B).

Measurement of the rotational parameters. (A) The red line is the femoral neck axis, connecting the femoral head center and the femoral neck center. (B) The purple line is the lesser trochanter axis, connecting the femoral shaft center and the lesser trochanter center. The angle between femoral neck axis and lesser trochanter axis is the femoral anteversion. (C) The white line indicates the fPCL. (D) The blue line indicates the tPCL. The angle between fPCL and tPCL is the tibiofemoral rotation. (E) The yellow line is the transmalleolar axis, connecting the midpoint of the medial and lateral malleolus. The angle between the tPCL and the transmalleolar axis is the tibial torsion. fPCL, posterior condylar line of the femur; tPCL, posterior condylar line of the tibia.
Tibiofemoral Rotation
TFR, the relative rotation between the distal femur and proximal tibia, 7 was evaluated by measuring the angle between fPCL and tPCL (Figure 4C and D). Positive values indicated external rotation, while negative values indicated internal rotation.
Tibial Torsion
Tibial torsion was measured as the angle formed between the proximal tibia and ankle joint. 7 The first image used for measurement was at the level of the tibial plateau, and the second was in the proximal tibiofibular joint. The transmalleolar axis was determined as the straight line connecting the midpoint of the medial and lateral malleolus on the second slice, and tibial torsion was then measured as the angle between the tPCL and the transmalleolar axis (Figure 4E). Positive values indicated relative external rotation of the distal tibia, while negative values indicated relative internal rotation.
Mechanical Axis Deviation
The mechanical axis was defined as the axis connecting the femoral head center and the ankle center, 22 and MAD was measured as the perpendicular distance from the center of the knee to the mechanical axis (Figure 5). 41 Positive values indicated knee valgus, while negative values indicated knee varus.

Measurement of the mechanical axis deviation. The black line is the mechanical axis, connecting the femoral head center and the ankle center. The mechanical axis deviation (red line) is the perpendicular distance from the center of the knee to the mechanical axis.
Statistical Analysis
All results were calculated as means and standard deviations with 95% CIs. The Kolmogorov-Smirnov test was applied to check data normality. Continuous variables between the LPD and control groups were compared using the unpaired t test, and categorical variables were compared using the chi-square test. Pearson correlation was performed to evaluate the linear association between increased TT-TG distance and the anatomical components studied. Afterward, factors that met the inclusion criteria of P < .05 and correlation coefficient (r) ≥0.30 were enrolled into a further stepwise multivariable linear regression analysis until the best model was obtained. The final model fits were assessed by normal quantile-quantile plots and standardized residuals. The standardized estimate (β) was used to quantify the relative predictive value of each variable. Statistical analysis was conducted with SPSS Version 21.0, and P < .05 was considered a significant statistical difference.
A power analysis was performed using GPower Version 3.1.3. 17 With 6 initial predictor variables, the minimum sample size required for our study was 144 (2-tailed; α = .05; power = 0.80). Thus, the study sample size of 160 patients provided adequate statistical power.
Results
The demographic characteristics of the LPD and control groups are shown in Table 1, and the anatomical measurements are shown in Table 2. The values between the LPD and control groups differed significantly regarding TT-TG distance, TTL, TFR, and MAD (P < .001 for all). However, the other anatomical parameters (TGM, femoral anteversion, tibial torsion) were not significantly different between the 2 groups (Table 2). The intraobserver and interobserver agreements were excellent, with ICCs >0.75 (Table 3).
Characteristics of Included Patients a

a Data are presented as mean ± SD (95% CI) unless otherwise indicated. Boldface P values indicate statistically significant difference between groups (P < .05). BMI, body mass index; LPD, lateral patellar dislocation.
Results of Measurement of Anatomical Components a
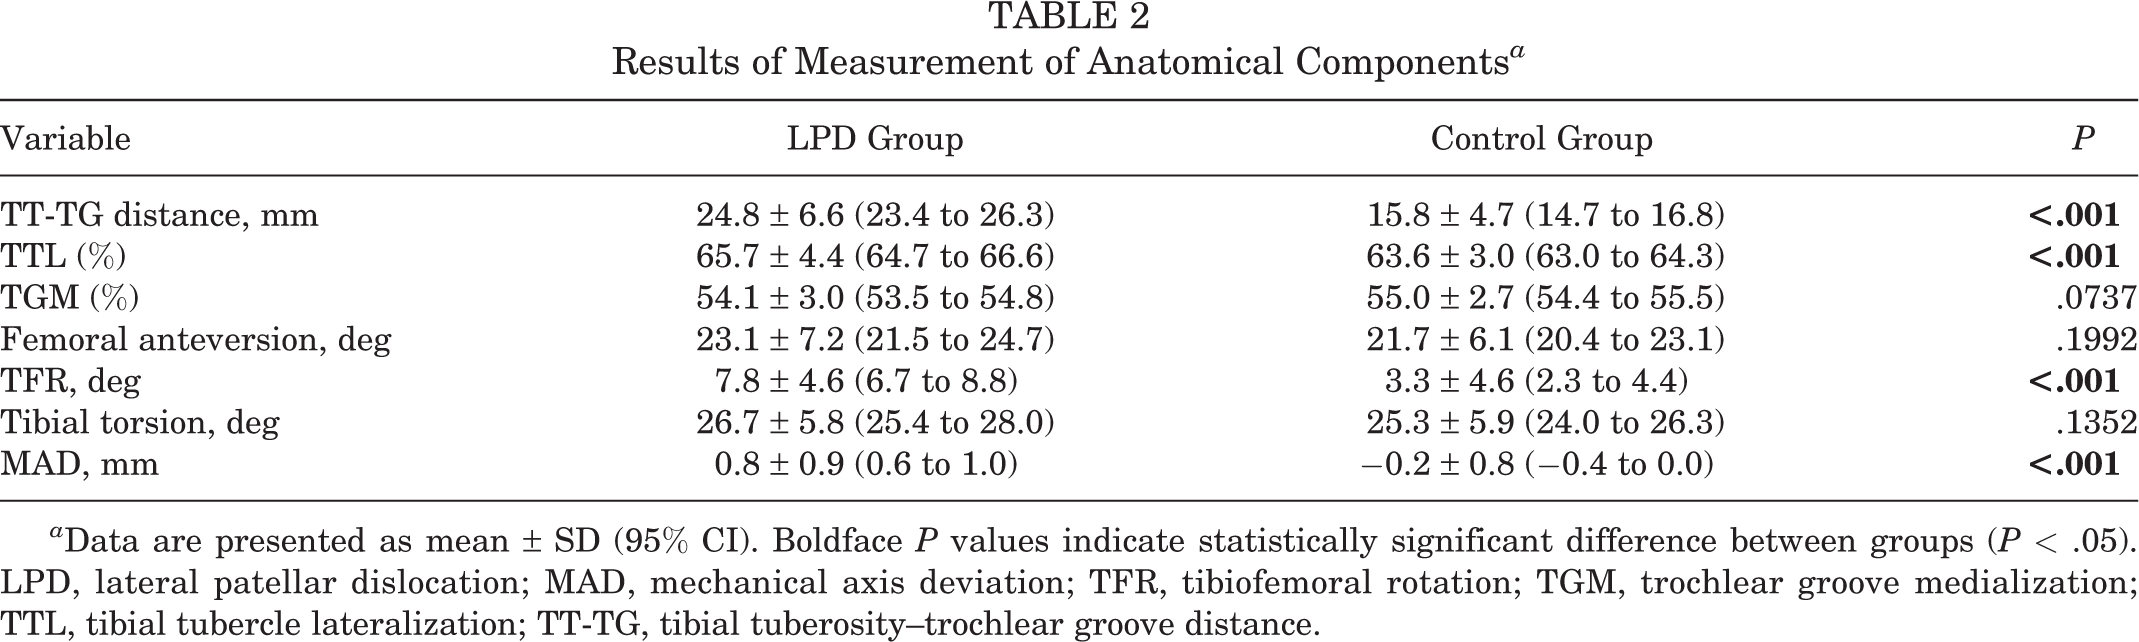
a Data are presented as mean ± SD (95% CI). Boldface P values indicate statistically significant difference between groups (P < .05). LPD, lateral patellar dislocation; MAD, mechanical axis deviation; TFR, tibiofemoral rotation; TGM, trochlear groove medialization; TTL, tibial tubercle lateralization; TT-TG, tibial tuberosity–trochlear groove distance.
ICC of Measurements a

a ICC, intraclass correlation coefficient; MAD, mechanical axis deviation; TFR, tibiofemoral rotation; TGM, trochlear groove medialization; TTL, tibial tubercle lateralization; TT-TG, tibial tuberosity–trochlear groove distance.
The association between TT-TG distance and the other anatomical components is shown in Table 4. Increased TT-TG distance was significantly positively correlated with TTL (r = 0.376; P < .001) (Figure 6A), femoral anteversion (r = 0.166; P = .036) (Figure 6B), TFR (r = 0.574; P < .001) (Figure 6C), and MAD (r = 0.415; P < .001) (Figure 6D) and was negatively correlated with TGM (r = −0.178; P = .024) (Figure 6A).
Results of Pearson Correlation Analysis Between TT-TG Distance and Anatomical Components a

a Boldface P values indicate statistical significance (P < .05). MAD, mechanical axis deviation; TFR, tibiofemoral rotation; TGM, trochlear groove medialization; TTL, tibial tubercle lateralization; TT-TG, tibial tuberosity–trochlear groove distance.
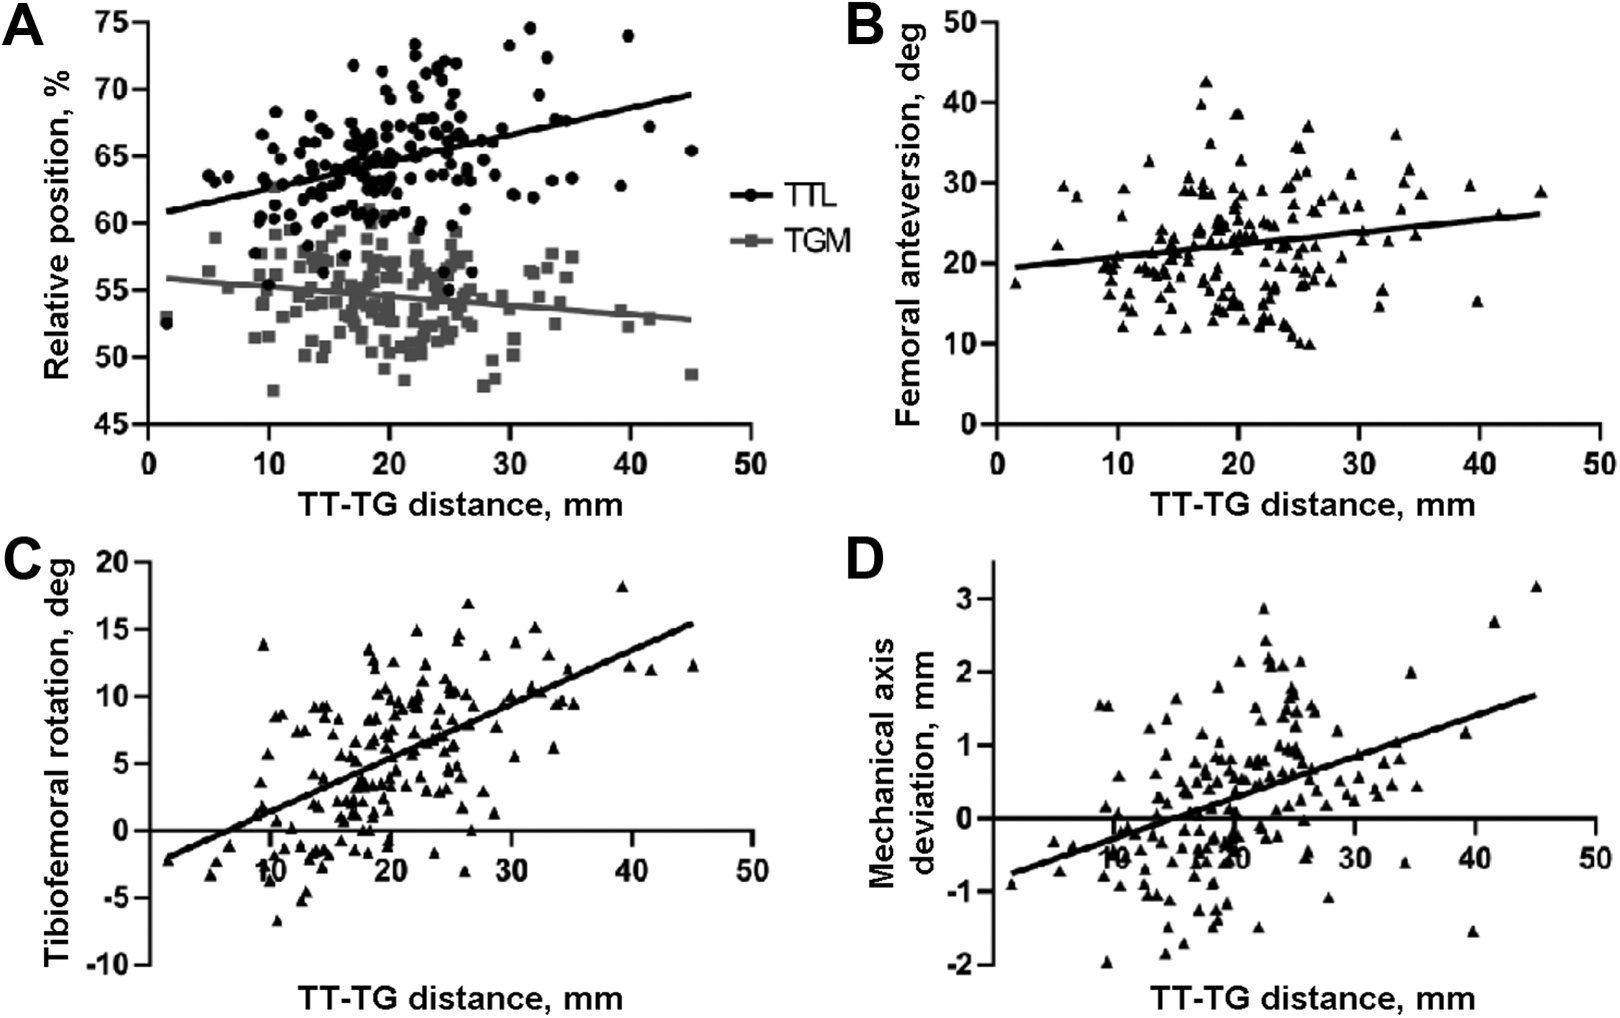
Significant correlations between TT-TG distance and other anatomical components. Increased TT-TG distance was positively correlated with (A) TTL (r = 0.376; P < .001) and negatively correlated with TGM (r = −0.178; P = .024), (B) positively correlated with femoral anteversion (r = 0.166; P = .036), (C) positively correlated with tibiofemoral rotation (r = 0.574; P < .001), and (D) positively correlated with mechanical axis deviation (r = 0.415; P < .001). TGM, trochlear groove medialization; TTL, tibial tubercle lateralization; TT-TG, tibial tuberosity–trochlear groove distance.
TTL, TFR, and MAD were further enrolled in the multivariate linear regression model. Tolerance was >0.10 for all and variance inflation factor was <2 for all, indicating that there was no multicollinearity among the selected factors. The model F value of 51.39 implied that the model was significant. The regression coefficients were −18.28 of the constant, 0.53 for TTL, 0.67 for TFR, and 2.16 for MAD (Table 5). The R 2 and adjusted R 2 of the model were 0.497 and 0.487, respectively. The regression formula of the model for predicting TT-TG distance was as follows: TT-TG distance = −18.28 + 0.53 (TTL) + 0.67 (TFR) + 2.16 (MAD).
Multivariate Linear Regression Model for Corresponding Factors of TT-TG Distance a

aR 2 = 0.497, adjusted R 2 = 0.487. Boldface P values indicate statistical significance (P < .05). Standardized estimates were used to quantify the relative contribution of selected anatomical factors to TT-TG distance. The standardized estimate of TFR (β = 0.469) was larger than those of TTL (β = 0.283) and MAD (β = 0.292), suggesting that TFR was the most prominent component associated with TT-TG distance. MAD, mechanical axis deviation; TFR, tibiofemoral rotation; TTL, tibial tubercle lateralization; TT-TG, tibial tuberosity–trochlear groove distance. Dash indicates there is no β for intercept.
Discussion
The major finding of our study was that TTL, TFR, and MAD were the main independent anatomical factors associated with TT-TG distance. Higher TTL, excessive knee external rotation, and excessive knee valgus were statistically significant predictors of greater TT-TG distance. In contrast to traditional opinions, 23,42 our results indicate that TFR, rather than TTL, was the most prominent anatomical component influencing TT-TG distance.
This is the first study to our knowledge to assess the association of the TT-TG distance to its anatomical components collectively. In the current study, the mean TT-TG distances in the LPD and control groups were 24.8 and 15.8 mm, respectively, which are close to values from a previous study (24.3 and 17.6 mm, respectively). 30 The mean difference in TT-TG distance between the 2 groups was 10 mm, which is similar to the findings of a study with another Asian cohort. 33 It has been reported that about 56% of patients with LPD have an increased TT-TG distance, and a threshold of 20 mm has been set for medial tibial tubercle transfer. 12 In our study, nearly 80% of patients with LPD had an increased TT-TG distance. The higher proportions of increased TT-TG distance in the LPD group might be because these patients experienced more severe symptoms.
There is wide variability in what is considered “normal” TT-TG distance, with a range from 9.4 to 22.4 mm according to different racial groups. 1,6,10,13 In addition, the TT-TG distance can be influenced by imaging modality and flexion angle during imaging. 8,9 Thus, using an absolute number to determine whether to perform a surgery seems to be imprecise. According to Steensen et al, 40 about 60% of patients with LPD have at least 2 abnormal anatomical factors. Therefore, it is necessary to determine the root cause of increased TT-TG distance and identify its contributing components. This systematic analysis offers a theoretical foundation for providing evidence-guided treatment for patients with LPD.
An increased TT-TG distance originally represented lateralization of the tibial tubercle. 12,20 Our study found that TTL was increased in patients with LPD and was strongly correlated with TT-TG distance. Medial tibial tubercle transfer, which can restore the alignment of the tibial tubercle and trochlear groove and reduce lateral force vector on the patella, 31,33 would be effective in patients with TTL and normal rotational alignment. However, an increased TT-TG distance is not determined by only TTL, and the impact of TTL on TT-TG distance is less important than previously thought. 38 Thus, the decision to perform medial tibial tubercle transfer for patients with LPD should not rely solely on a single TT-TG distance value. Further studies are required to validate the appropriateness of the current surgery threshold and elucidate under what circumstances the surgery should be performed so that it can better restore normal joint anatomy and function.
Torsional deformities have been regarded as potential predictors for LPD. 16,22 Of the torsional parameters measured in our study, TFR was the only parameter to differ significantly between the LPD and control groups. We also found TFR to be the most prominent anatomical component associated with TT-TG distance. In previous studies, TFR has been strongly correlated with femoral anteversion and tibial torsion, which means increased TFR may be due to excessive internal femoral or/and external tibial torsion. 26,31,34 Internal femoral rotation can lead to a relatively medialized trochlear groove, while external tibial rotation can lead to a relatively lateralized tibial tuberosity, all of which contribute to increased TT-TG distance. 25,28,32 During a long-term postoperative follow-up study of medial tibial tubercle transfer, outcomes worsened with time, and 42% of patients progressed to osteoarthritis in the patellofemoral joint. 29 A possible explanation was that medial tibial tubercle transfer might not restore rotational malalignment, and abnormal stress on the patellofemoral joint may persist. 27
Coronal malalignment is another mechanical anomaly that has been associated with an increased risk of LPD. 11,15,24 Valgus malalignment has resulted in larger MAD, leading to an increase in lateral force vector of patellar and abnormal patellar tracking. 14,41 Our study was consistent with previous studies in that an excessively valgus knee was significantly and positively associated with an increased TT-TG distance. 11,15 Moreover, the Pearson correlation coefficient and standardized estimate for MAD were higher than those for TTL, suggesting that TT-TG distance was affected more strongly by MAD than by TTL. Therefore, surgeons should also take MAD into consideration in surgical decision making. For those patients in whom MAD is the main cause of increased TT-TG distance, coronal plane osteotomy may be an alternative surgical procedure to restore normal anatomy. Further biomechanical and clinical studies are needed to confirm whether patients with LPD can benefit from surgical correction of the valgus deformity.
Currently, no clear consensus on the treatment of LPD has been reached. The systematic evaluation of TT-TG distance and its related anatomical components is crucial to determine the type and magnitude of surgical correction, so as to provide optimal treatment on a patient-specific basis. For example, if the increased TT-TG distance stems mainly from higher TTL, medial tibial tubercle transfer would be the preferred treatment. For patients in whom excessive TFR and/or excessive knee valgus are the main contributors to increased TT-TG distance, osteotomy would be an alternative procedure; if the abnormal TT-TG distance cannot be corrected, additional medial tibial tubercle transfer would be reasonable. Furthermore, if the increased TT-TG distance is because of a combination of TTL, TFR, and MAD, a combination of procedures might be necessary.
Limitations
There are several limitations to our study. First, all the included patients were from a single hospital. In addition, only those patients who were currently symptomatic would take further imaging examination. Therefore, selection bias may exist. Second, we used a new method to evaluate TTL rather than the tibial tubercle–posterior cruciate ligament. However, this new method has been proven to be valid and truly representative of the TTL. 10,42 Third, while our study provided a theoretical foundation for future surgical decision making, further studies are required to examine how our results translate into better anatomical and functional outcomes for patients with LPD.
Conclusion
Our study found that TTL, TFR, and MAD were the main independent anatomical components associated with increased TT-TG distance, with the most prominent component being TFR. The association of each component to TT-TG distance identified in our study may help to guide surgical planning.
Footnotes
ACKNOWLEDGMENT
The authors thank all colleagues in Hebei Medical University Third Affiliated Hospital.
Final revision submitted April 20, 2022; accepted May 17, 2022.
One or more of the authors has declared the following potential conflict of interest or source of funding: This work was supported by the National Natural Science Foundation of China (grant no. 81873983) and Key Program of Natural Science Foundation of Hebei Province (grant no. H2019206694). AOSSM checks author disclosures against the Open Payments Database (OPD). AOSSM has not conducted an independent investigation on the OPD and disclaims any liability or responsibility relating thereto.