
Abstract
Background:
In clinical practice, preoperative radiographic assessment of the tibial tuberosity–trochlear groove (TT-TG) distance in patients with recurrent patellar dislocation (RPD) typically relies on conventional computed tomography (CT). A novel EOS imaging system may be a new option for measuring the TT-TG, which provides less radiation and costly time to perform.
Purpose:
To determine the reliability and reproducibility of the EOS 3-dimensional (3D) imaging system to measure TT-TG values.
Study Design:
Cohort study (Diagnosis); Level of evidence, 2.
Methods:
Data from 34 patients (36 knees) diagnosed with RPD in our sports medicine department were retrospectively analyzed. Two senior radiologists independently measured the alignment of the patients’ lower limbs via EOS images. The TT-TG values measured by EOS 3D images and CT scans were compared. To evaluate intrareader reliability, measurements were repeated on 2 separate occasions ≥3 days apart and intraclass correlation coefficients (ICCs) and Bland-Altman plots were calculated.
Results:
When lower-limb alignment was measured with EOS, there were no statistically significant differences in the femoral and tibial lengths (P = .87 and P = .78, respectively), femoral offset (P = .83), knee joint varus and valgus angles (P = .73), femoral and tibial mechanical angle (P = .70 and P = .83, respectively), and femorotibial torsion angles (P = .82) measured by the 2 radiologists. Excellent intraobserver ICC (>0.75) was observed. The TT-TG measurements using EOS 3D were 18.4 ± 4.2 mm (radiologist 1) and 18.4 ± 3.5 mm (radiologist 2), while the corresponding values from CT were 19.2 ± 4.0 mm and 18.5 ± 3.7 mm, respectively. The measurements between EOS and CT showed good intrarater consistency (ICC > 0.7). Bland-Altman analysis revealed mean differences of 0.743 mm and 0.081 mm between the 2 methods, with >91% of data points falling within ±1.96 SD, indicating strong agreement between the 2 measurement techniques.
Conclusion:
Our study showed that the EOS 3D imaging system provides reliable and reproducible TT-TG measurements comparable with CT. This technology has the potential to serve as an alternative method for assessing lower-limb alignment and TT-TG values in patients with RPD.
Keywords
Recurrent patellar dislocation (RPD) is a common knee disorder, especially in young and active populations. 13 Although the pathogenesis of recurrence is multifactorial, it involves abnormalities in limb alignment, the bony structure of the patella and trochlea, and the integrity of soft tissue constraints. Hence, an excessive tibial tuberosity–trochlear groove (TT-TG) has been identified in patients with RPD and has been found to be caused by an externally rotated distal tibia and misalignment of the patella with the femoral trochlea. 2 To address this risk factor, some studies have recommended a surgical treatment strategy involving TT osteotomy. 5 To achieve the desired intraoperative results, a reliable method for measuring the preoperative TT-TG is crucial. The gold standard for measuring TT-TG is computed tomography (CT), but this method is not always accessible and leads to overestimation. 12
In recent years, the EOS imaging system (EOS Imaging Inc), which provides simultaneous biplanar imaging of the lower limb and enables 3-dimensional (3D) reconstruction, has been proposed as a promising alternative imaging modality. This technology has been reported to be widely used in orthopaedic clinics.11,14 It offers the advantage of lower radiation exposure compared with conventional radiography and could provide an excellent advantage in dealing with torsional and rotational issues. Therefore, to the best of our knowledge, no studies in the literature have reported the use of 3D models from EOS radiography to calculate TT-TG values in patients with RPD. The purpose of the present study was to determine whether TT-TG measurements on EOS radiographs are as reliable as those on CT images in patients with RPD. We hypothesized that the TT-TG value can be measured on EOS radiographs with good reliability compared with CT images.
Methods
Patient Selection
A series of patients diagnosed with RPD in the sports medicine center of Honghui hospital were recruited between March 2022 and December 2023. All patients met the following inclusion criteria: (1) all patients with recurrent patellar instability who had experienced ≥2 dislocations of the patella despite undergoing nonoperative treatment and (2) patients who had undergone an EOS scan and an additional rotational CT scan of their lower extremities before surgery. The exclusion criteria were as follows: (1) patients with other types of dislocation, such as habitual or fixed patellar dislocation; (2) patients with history of knee surgery due to patellofemoral joint issues; and (3) patients with patellofemoral osteoarthritis or previous intra-articular fractures of the knee. A senior clinician with 10 years of experience (X.Z.) reviewed the patient data based on the inclusion and exclusion criteria. A total of 34 patients (36 knees) with RPD were included in the study, including 11 male patients (11 knees) and 23 female patients (25 knees). The median age of the patients was 19.5 years (range, 15-39). This study was approved by the ethics committee of the Health Science Center of Xi'an Jiaotong University.
EOS Examination and Analysis
The EOS imaging system (Figure 1A) protocol for the lower limbs included simultaneous anteroposterior and lateral image acquisition from the pelvis to the feet in a physiological load-bearing position. All patients were instructed to stand with their knees facing forward and one foot placed approximately 2 inches in front of the other (Figure 2A). The arms were raised to 90° with the hands holding a stabilization bar for balance. Upright anteroposterior and lateral radiographs of the lower limbs were taken simultaneously. To confirm the accuracy of the irradiation field and center line, a prescan was conducted. Two orthogonal 90° tubes were exposed simultaneously and continuously from top to bottom via the slit exposure technique. The exposure parameters were adjusted according to the patient’s body mass index. To obtain a higher-quality image, the patient was instructed not to move the affected limb during biplanar x-ray exposure. The general exposure parameters included an exposure time of 12 to 20 seconds, 80 kV, a tube voltage of 280 mA, and a tube current. Radiological parameters were automatically estimated by the imaging system (Figure 1, B and C).

EOS imaging-derived quantitative measurements of lower limb alignment parameters in recurrent patellar dislocation cases. (A) EOS imaging system. (B) EOS 2-dimensional image of the patient’s lower limbs showing anteroposterior and lateral radiographs. (C) Various parameters of the lower limbs were automatically calculated via the EOS imaging program. HKS, hip-knee-shaft.

EOS 3-dimensional (3D) image modeling compared with conventional computed tomography (CT) for tibial tuberosity–trochlear groove (TT-TG) distance measurement. (A) Patients were instructed to stand in a position with their kneecaps facing forward and one foot placed approximately 2 inches in front of the other. (B) Two-dimensional sagittal image from EOS showing the position of the bony structures and a reference line for TT-TG measurement. The red line depicts the bone contour (tibia), and the yellow line represents the bone axis of the lower limb. The blue lines were projected onto a plane to locate the deepest point of the femoral TG and the most convex midpoint of the TT. (C) Using the sterEOS processing workstation, the EOS 3D reconstruction was performed. The blue lines were adjusted to represent the bony anatomic landmarks associated with TT-TG measurement. After adjustment, the 3 blue lines represented TT-TG standard value, and the distance between the deepest point of the TG and the midpoint of the TT was calculated via the blue lines. (D) CT scans were performed with patients in the supine position, with hips extended and thighs horizontal and parallel. (E) 3D CT reconstruction of the lower extremity. (F) The axial CT images of the lowest point of the femoral trochlea and the TT were used to superimpose 2 images. The TT-TG distance was measured as the length between a line drawn from the deepest portion of the TG and a line drawn parallel to this line at the most prominent anterior portion of the TT.
EOS 3D Modeling for Patient TT-TG Measurement
The sterEOS software utilizes a technique based on 3D parametric models and statistical inference. The reconstruction process is a software-based, step-by-step method that includes the recognition of anatomic landmarks. This procedure has previously been validated for assessment of the rotational alignment of the lower extremity.8,15 The 3D models were semiautomatically adjusted to fit the bony contours of the lower limb. The patient’s lower limb was represented by the adapted 3D model created through this fitting process. Accurate identification of anatomic landmarks was critical for accurate measurement. In this process, several anatomic landmarks (cortical bone of femoral head and greater trochanter, medial and lateral femoral condyles, tibial plateau and distal) were accurately identified by spatial manipulation of the object using the epipolar line, which allowed each landmark to be reflected simultaneously in both the coronal and the sagittal planes.
The EOS 3D modeling of each patient was completed independently by 2 senior consultant-grade radiologists (with 3 years of experience in EOS). The first step was to locate the posterior condylar contour of the medial and lateral femoral condyles on the 2-dimensional (2D) image and then establish the posterior condylar line (the tangent to the posterior edge of the medial and lateral femoral condyles). The second step involved identification of the deepest point of the femoral TG and the most convex midpoint of the TT. These points were connected by vertical lines that intersected with the posterior condylar line (Figure 2B). The final step included precise adjustment of the position of these 3 lines to represent the bony anatomic landmarks. After these adjustments, the 3 lines that were previously shown in the 2D image were now represented in the reconstructed 3D image (Figure 2C; blue lines). The distance between the deepest point of the TG and the midpoint of the TT represented the TT-TG standard value.
CT Measurement of a Patient’s TT-TG Value
The CT measurement and reconstruction protocol included the following: CT scans (Philips Brilliance 64-MDCT; Philips Medical Systems) were performed with patients in the supine position, with the hips extended and the thighs horizontal and parallel. Axial images (120 kV, tube voltage; 185 mAs/slice, tube current; 1 mm, reconstruction thickness) of the hip, knee, and ankle were acquired without any body movement. The images were reconstructed using a 3D reconstruction workstation to generate 3D models (Figure 2E). The axial images of the lowest point of the femoral trochlea and the TT were used to superimpose 2 images. The TT-TG distance was measured as the length between a line drawn from the deepest portion of the TG perpendicular to the posterior condylar line and a line drawn parallel to this line at the most prominent anterior portion of the TT (Figure 2F).
Statistical Analysis
All data were analyzed using SPSS 22.0 software (IBM Corp). Measurement data were assessed for normal distribution, and all continuous variables are expressed as means ± SDs. A paired sample t test was used to compare the results between different radiologists measuring lower-limb alignment using EOS. P values <.05 were considered statistically significant. The EOS TT-TG measurements were performed independently by 2 senior radiologists. To evaluate intrareader reliability, measurements were repeated on 2 separate occasions ≥3 days apart, and intraclass correlation coefficients (ICCs) were calculated (poor, <0.40; moderate, 0.40-0.59; good, 0.60-0.74; excellent, ≥0.75. ICCs are presented with a 95% CI. Comparisons of intrareader reliability were performed using Bland-Altman plot analysis. The Bland-Altman plot shows a scatterplot of the mean CT and EOS measurements against their differences. If an agreement was good, then the differences should be randomly scattered around the zero-difference reference line (Figure 3).
Results
EOS Imaging Assessment of Lower-Limb Alignment
There was no statistically significant difference between the readers in terms of the measured data, such as femoral and tibial length, functional and anatomic length, femoral neck-shaft angle and offset, knee joint flexion or extension angle, varus or valgus angle, hip-knee-shaft, or mechanical and torsion angles (P > .05). Excellent intraobserver reliability was observed, with ICCs >0.75 (Table 1).
Comparison of Lower-Limb Alignment in Patients With Recurrent Patellar Dislocation by EOS 2D Imaging a

Data are presented as means±SD. Significant differences were considered at P < .05. 2D, 2-dimensional; EOS, EOS imaging system; HKS, hip-knee-shaft; ICC, intraclass correlation coefficient.
ICC < 0.40 = poor; 0.40-0.59 = fair; 0.60-0.74 = good; 0.75-1.00 = excellent.
Comparison of TT-TG Values Between EOS 3D Images and CT Scans
For radiologists 1 and 2, the TT-TG values measured by EOS 3D were 18.4 ± 4.2 mm and 18.4 ± 3.5 mm, respectively. Meanwhile, the 2 radiologists used conventional CT to measure the TT-TG values, which were 19.2 ± 4.0 mm and 18.5 ± 3.7 mm, respectively. The intraobserver ICC for radiologist 1 was 0.765 (95% CI, 0.587-0.873), indicating good intraobserver reliability. Radiologist 2 results were similar and showed high intraclass agreement, with an ICC of 0.741 (95% CI, 0.547-0.859). Good agreement (ICC > 0.7) was observed between the measurements obtained via EOS imaging and those obtained via the CT method (Table 2).
Descriptive Statistics of the TT-TG Measurements a

Data are presented as mean ± SD. CT, computed tomography; EOS, EOS imaging system; ICC, intraclass correlation coefficient; TT-TG, tibial tuberosity–trochlear groove.
The Bland-Altman plot showed that the mean differences in TT-TG values between the CT and EOS measurements were 0.743 (6.174 to −4.687) mm and 0.081 (5.189 to −5.028), respectively. The variability of the measurement results was consistent throughout the graph, with no tendency for the differences to increase as the mean of the EOS and CT measurements increased. More than 91.7% (33/36) and 97.2% (35/36) of the points are within the range of ±1.96 SD (Figure 3).
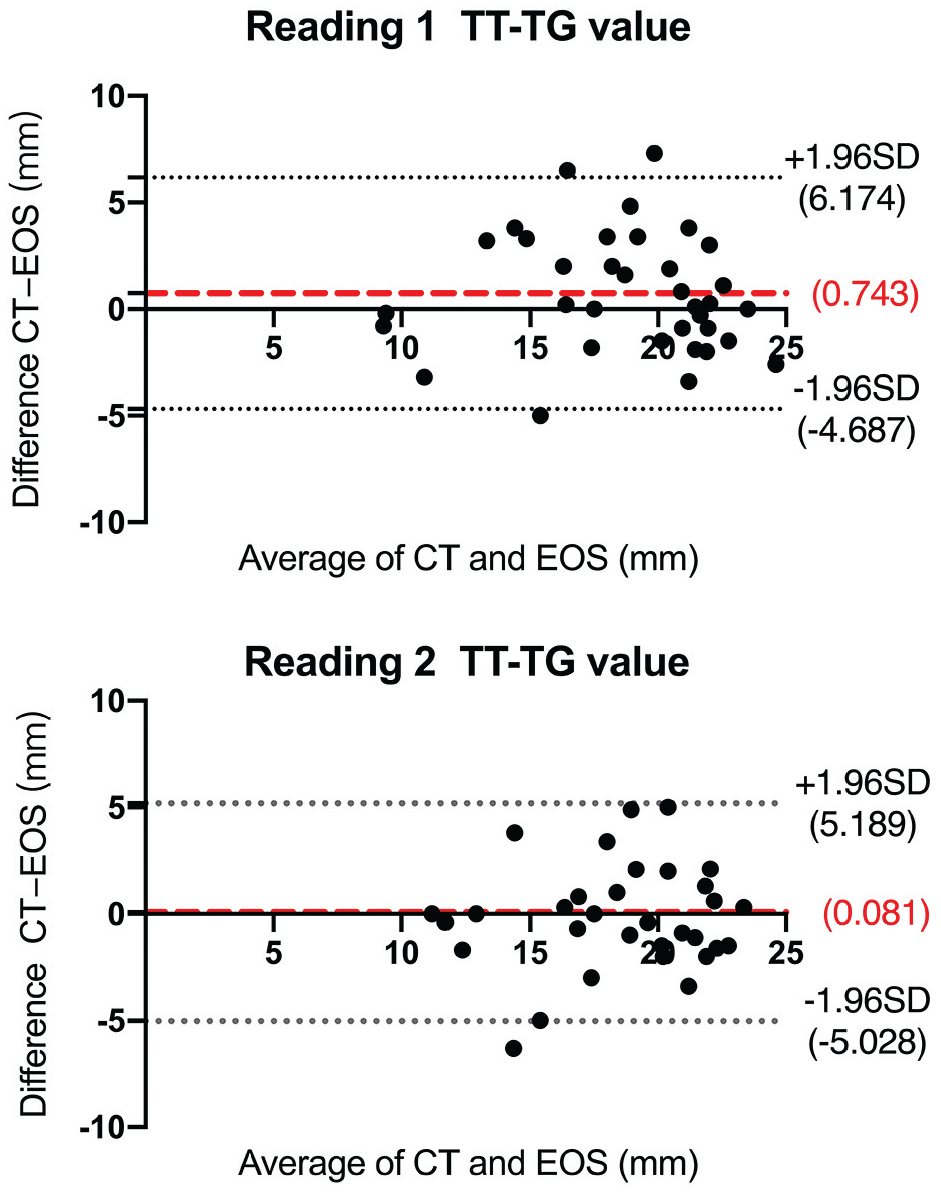
Bland-Altman plots of TT-TG values measured by 2 readers using EOS 3D and CT. The red lines represent the mean of the differences, while the gray lines represent the upper and lower horizontal lines marking ±1.96 SD of the differences. CT, computed tomography; EOS, EOS imaging system; TT-TG, tibial tuberosity–trochlear groove.
Discussion
The most important finding of this study is that the 3D EOS workstation can provide equivalent results for TT-TG values when compared with conventional CT. Good agreement (ICC > 0.7) was observed between the measurements obtained via EOS imaging and those obtained via CT. Although some studies have utilized EOS to measure femoral and tibial torsion, no reports have yet been published on the measurement of TT-TG values.6,8 Therefore, this study used the EOS 3D imaging system to validate the reliability and accuracy of measuring TT-TG values in patients with RPD.
With the continuous promotion and application of the EOS system, an increasing amount of clinical evidence has confirmed the reproducibility and reliability of its measurements. 15 In particular, EOS 3D reconstruction is a technique similar to CT, which can improve the accuracy of measurements. One of the more challenging aspects of the measurement process is the lack of relevant parameters for TT-TG values in the EOS workstation. Accurate landmark identification relies on locating the deepest point of the femoral TG and the most convex midpoint of the TT. Bony landmarks were marked in 2D images, and measurements were performed in 3D images. This is also the main reason why the ICC for automatically measured lower-limb parameters is higher than that for the TT-TG measurement. Due to the limitations of the current method, it is not yet possible to automatically delineate and calculate TT-TG values for clinical use. The potential shortcomings of manual goniometric measurements based on conventional CT scans and EOS 3D radiography is that they reduce the consistency and repeatability of the results (radiologist 1: ICC, 0.765; radiologist 2: ICC, 0.741). Therefore, it may be possible to establish an automated measurement program with the training of professional technical staff and the assistance of engineers.
Abnormal lower-limb alignment is one of the primary causes of patellofemoral joint instability. 9 Accurate measurement and assessment of alignment are critical for preoperative planning and postoperative evaluation. While CT provides an intuitive and reliable method for assessing TT-TG values, concerns about the associated radiation risk limit its use in pediatric patients. While magnetic resonance imaging shows good correlation with CT, it lacks the ability to assess lower-limb alignment and is costly. An alternative for measuring torsional profiles is biplanar reconstruction radiography, commonly referred to as EOS imaging. Escott et al 3 used 3 different imaging modalities (radiograph, CT, and EOS) to perform repeated imaging assessments of lower-limb alignment in children. They reported that the EOS was more accurate in assessing length compared with conventional CT radiographs. In adolescent patellar dislocation patients suspected of poor lower-limb alignment, CT scans impart substantial radiation exposure. EOS exposes patients to significantly lower radiation compared with CT, making it more suitable for children and adolescents. Our analysis included 34 patients with RPD, along with their corresponding EOS images and CT scans. We compared TT-TG measurements to assess the agreement between the 2 methods. The results revealed that both methods exhibited good reliability measures of the TT-TG, with a high ICC (>0.7). These findings suggest that EOS imaging technology can provide clinical data as reliably as conventional CT scans.
The accuracy of TT-TG measurements in patients with RPD may be influenced by the presence of lower-limb deformities, which are typically absent in healthy adolescents. 10 The assessment of lower-limb mechanics, especially 3D analysis of standing weightbearing positions, provide more objective information about the human body. 7 Chen et al 1 applied the EOS imaging system to measure rotational deformities in patients with RPD in the standing weightbearing position. The femoral anteversion angle was significantly lower in the CT supine position compared with the EOS standing weightbearing position. Folinais et al 4 used EOS to measure femoral and tibial rotation for 3D reconstruction and compared its accuracy with that of CT, the gold standard. Ultimately, the difference between the 2 methods was not statistically significant. Our measurements indicate that the TT-TG value measured by the EOS are similar to those measured by CT, and both can be influenced by body position. Conventional CT scans allow TT-TG measurements without being influenced by femoral or tibial positioning. The internal rotation angle of the femur is greater in the weightbearing position, while the external rotation angle of the tibia is restricted in the weightbearing position. However, the CT results in our study are similar to the EOS results, which may be due to the positioning during the CT scan. During the radiographic procedure, we took care to ensure that both knees were maximally extended and that the feet pointed forward. This ensured that the lower-limb position on the CT scan was neutral and uniform, although not weightbearing.
Limitations
This study has several limitations. First, although patients were instructed not to flex the knees intentionally during each assessment, there might be subtle differences in the knee flexion/extension angle between 2 images. Second, a key source of error in clinical TT-TG measurement lies in the selection of the axial plane corresponding to the lowest point of the femoral trochlea. Expert radiologist for CT measurements often make different in the selection of planes, especially in patients with RPD, most of whom had trochlear dysplasia (Dejour B-D). This can lead to a large difference in the results of the 2 methods. Increasing the number of radiologists can reduce this error. This study did not assess interreader reliability, which also is a limitation. This approach was intended to assess the consistency of repeated measurements by the same reader, which is critical for evaluating this technique in routine clinical settings. While intrareader reliability was high, future studies involving multiple raters are necessary to further validate the reproducibility and generalizability of the EOS measurement protocol. Third, the existing EOS 3D reconstruction method remains unable to produce complete and clear 3D reconstructions using the standard EOS workstation due to technical limitations. The spatial resolution of EOS 3D reconstructions is a critical determinant of measurement precision, highlighting the need for enhanced software algorithms to overcome this technical constraint. Future development of a standardized TT-TG measurement protocol within the EOS software system will enhance measurement accuracy while maintaining the operational efficiency comparable to existing lower-limb alignment parameters.
Conclusion
Our study showed that the EOS 3D imaging system provides reliable and reproducible TT-TG measurements comparable with CT. This technology has the potential to serve as an alternative method for assessing lower-limb alignment and TT-TG values in patients with RPD.
Footnotes
Final revision submitted April 8, 2025; accepted May 6, 2025.
One or more of the authors has declared the following potential conflict of interest or source of funding: this research was funded by Shaanxi Province Natural Science Foundation [2024JC-YBMS-630]. AOSSM checks author disclosures against the Open Payments Database (OPD). AOSSM has not conducted an independent investigation on the OPD and disclaims any liability or responsibility relating thereto.
Ethical approval for this study was obtained from Health Science Center of Xi'an Jiaotong University (ID No. HH-2022013).