
Abstract
Background:
The cross-sectional area (CSA) of the anterior cruciate ligament (ACL) and reconstructed graft has direct implications on its strength and knee function. Little is known regarding how the CSA changes along the ligament length and how those changes vary between treated and native ligaments over time.
Hypothesis:
It was hypothesized that (1) the CSA of reconstructed ACLs and restored ACLs via bridge-enhanced ACL restoration (BEAR) is heterogeneous along the length. (2) Differences in CSA between treated and native ACLs decrease over time. (3) CSA of the surgically treated ACLs is correlated significantly with body size (ie, height, weight, body mass index) and knee size (ie, bicondylar and notch width).
Study Design:
Cohort study; Level of evidence, 2.
Methods:
Magnetic resonance imaging scans of treated and contralateral knees of 98 patients (n = 33 ACL reconstruction, 65 BEAR) at 6, 12, and 24 months post-operation were used to measure the ligament CSA at 1% increments along the ACL length (tibial insertion, 0%; femoral insertion, 100%). Statistical parametric mapping was used to evaluate the differences in CSA between 6 and 24 months. Correlations between body and knee size and treated ligament CSA along its length were also assessed.
Results:
Hamstring autografts had larger CSAs than native ACLs at all time points (P < .001), with region of difference decreasing from proximal 95% of length (6 months) to proximal 77% of length (24 months). Restored ACLs had larger CSAs than native ACLs at 6 and 12 months, with larger than native CSA only along a small midsubstance region at 24 months (P < .001). Graft CSA was correlated significantly with weight (6 and 12 months), bicondylar width (all time points), and notch width (24 months). Restored ACL CSA was significantly correlated with bicondylar width (6 months) and notch width (6 and 12 months).
Conclusion:
Surgically treated ACLs remodel continuously within the first 2 years after surgery, leading to ligaments/grafts with heterogeneous CSAs along the length, similar to the native ACL. While reconstructed ACLs remained significantly larger, the restored ACL had a CSA profile comparable with that of the contralateral native ACL. In addition to size and morphology differences, there were fundamental differences in factors contributing to CSA profile between the ACL reconstruction and BEAR procedures.
Registration:
NCT 02664545 (ClinicalTrials.gov identifier).
Several studies have used cross-sectional area (CSA) as a measure of size in the anterior cruciate ligament (ACL) and investigated its effect on the function of the ligament. 4,5,7,8,14,18,28,36 CSA has an effect on the biomechanical behavior of the healthy ACL, such as the ability to withstand loads, and is therefore crucial for better understanding of mechanisms of injury. 5 It is important to note that increased CSA, especially during the early stages of ligamentization–a time of decreased mechanical properties–may be attributed to hypertrophy due to revascularization and remodeling. 11 Thus, increased CSA during early remodeling does not necessarily directly correlate with improved biomechanical properties. Still, it is a useful metric by which to estimate structural properties. Among the important structural properties indicative of ligament rupture, energy at failure, elongation at failure, and linear stiffness have been shown to be size sensitive. 7 While a larger reconstructed graft or restored ACL may withstand higher loads, it may not fully result in native knee biomechanics. An accurate measure of the CSA is thus crucial for the prediction of ACL injuries and would help optimize surgical treatment (eg, graft selection and sizing) to restore the native ACL function and knee biomechanics.
Optimizing ACL reconstruction to mimic the complex morphology of the native ACL, including similar size (ie, CSA) has been a topic of extensive study. 1,22,28,37 Nevertheless, inconsistencies in optimal graft size have been reported in the literature. Several previous studies have reported a larger graft CSA compared with the native ACL, with this size discrepancy remaining over time. 6,18,28,31,36 These measurements were performed primarily on a single location (eg, midsubstance of the graft) or reported as an average along the length of the graft. 18,28,31,36 Although those measures inform us about the graft size, they lack necessary details on how the graft CSA may vary along its length and how successfully ACL reconstructions may replicate the complex morphology of the native ACL. Such information may help better interpret the outcomes of ACL surgery and its ability to restore knee function and biomechanics. It may also help with assessing the relative efficacy of new surgical treatments, such as bridge-enhanced ACL restoration (BEAR), with the ultimate aim of restoring the ACL as close to its native state as possible.
The primary study objective was to establish variations in CSA along the length (CSA profile) of ACL reconstructions and restored ACLs (BEAR), relative to the contralateral intact ACL, within the first 2 years after ACL surgery. To further shed light on previous reports of the effect of body size or knee size on treated ACL CSA, 7,34 the secondary study objective was to systematically investigate the relationships between body size (ie, height, weight and body mass index [BMI]) or knee size (ie, bicondylar width and intercondylar notch width) and regional measurements of CSA along treated ACL length. We hypothesized that (1) CSA varies along the length of the reconstructed ACL and restored ACL, with different trends compared with native contralateral ACL; (2) the difference in CSA between treated ACLs and native contralateral ACLs decreases in the time from 6 to 24 months after surgery; and (3) the CSA of the reconstructed ACL and restored ACL is correlated with both body size (ie, height, weight, and BMI) and knee size (ie, bicondylar width and intercondylar notch width).
Methods
Participants
The imaging data from the BEAR II randomized clinical trial (IDE G150268, IRB P00021470, NCT 02664545) were obtained. The details of the trial including the recruitment criteria and outcome measures have been presented previously. 24 Briefly, the trial included 100 patients (aged 14-35 years) with complete midsubstance ACL tears who were eligible for surgery within 45 days from injury. All patients had closed physes. Patients were excluded if they had a history of previous ipsilateral knee surgery, history of previous knee infection, or risk factors that could adversely affect ligament healing (nicotine/tobacco use, corticosteroids in the past 6 months, chemotherapy, diabetes, inflammatory arthritis). Patients were also excluded if they had a displaced bucket-handle tear of the medial meniscus requiring repair, a full-thickness chondral injury, a grade 3 medial collateral ligament injury, a concurrent complete patellar dislocation, or an operative posterolateral corner injury.
Patients were assigned randomly (2:1 ratio) to be treated with either bridge-enhanced ACL restoration (BEAR group, n = 65, 57% female, age: 17 years [range, 16-20 years]) or autograft ACL reconstruction (ACLR group, n = 35, 54% female, age: 17 years [range, 15-23 years]). All patients granted their informed consent before participating. For this study, patients with revised ACLs/grafts and contralateral ACL injured cases were excluded. We also excluded the 2 bone–patellar tendon–bone autograft ACL reconstructions considering established mismatch in graft size between bone–patellar tendon–bone and hamstring autografts, giving us a total of 98 patients for CSA analysis (n = 33 ACLR, 65 BEAR). 28 This led to total of 84 ACL reconstructions (n = 30 at 6 months; n = 29 at 12 months; n = 25 at 24 months), 179 restored ACLs (n = 64 at 6 months; n = 61 at 12 months; n = 54 at 24 months) and 238 contralateral native ACLs (n = 64 at 6 months; n = 90 at 12 months; n = 84 at 24 months) for final analysis.
Surgical Procedures
ACLR Group
A standard hamstring autograft procedure was performed using a quadruple semitendinosus-gracilis graft using a continuous-loop cortical button (Endobutton; Smith & Nephew) for proximal fixation and a bioabsorbable interference screw (BioRCI HA; Smith & Nephew) for tibial fixation. The femoral tunnel was drilled using an anteromedial portal technique and a flexible drill guide system (Clancy Anatomic Cruciate Guide; Smith & Nephew).
BEAR Group
A knee arthroscopy was performed, and any meniscal injuries were treated if present. A tibial aimer (ACUFEX Director Drill Guide; Smith & Nephew) was used to place a 2.4-mm guide pin through the tibia and the tibial footprint of the ACL. The pin was overdrilled with a 4.5-mm reamer (Endoscopic Drill; Smith & Nephew). A guide pin was then placed in the femoral ACL footprint, drilled through the femur and then overdrilled with the 4.5-mm reamer. A whipstitch of No. 2 absorbable braided suture (Vicryl; Ethicon) was placed into the tibial stump of the torn ACL either arthroscopically or via arthrotomy. Two No. 2 nonabsorbable braided sutures (Ethibond; Ethicon) were looped through the 2 center holes of a cortical button (Endobutton; Smith & Nephew). The free ends of a No. 2 absorbable braided suture from the tibial stump were passed through the cortical button, which was then passed through the femoral tunnel and engaged on the lateral femoral cortex. Both looped sutures of the No. 2 nonabsorbable braided (4 matched ends) were passed through the BEAR implant (Boston Children’s Hospital), which was manufactured from bovine connective tissue as previously described, 24 and 10 mL of autologous blood obtained from the antecubital vein was added to the implant. The scaffold was then passed up along the sutures into the femoral notch and the nonabsorbable braided sutures were passed through the tibial tunnel and tied over a second cortical button on the anterior tibial cortex with the knee in full extension. The remaining pair of suture ends coming through the femur were tied over the femoral cortical button to bring the ACL stump into the scaffold using an arthroscopic surgeon’s knot and knot pusher. 24
Imaging Outcomes
Magnetic resonance imaging (MRI) scans of the treated and contralateral knees were obtained using the 3-dimensional (3D) constructive interference in steady state sequence (repetition time/time to echo = 14/7 ms, flip angle = 35°, 16 cm field of view, 80 × 512 × 512 [slice × frequency × phase]) at 6, 12, and 24 months after surgery using a 3-T scanner (Tim Trio; Siemens) and a 15-channel knee coil (Siemens). An experienced member of the team (A.M.K.; intraexaminer reliability of the segmentation intraclass correlation coefficient >0.9) segmented all the ACLs and grafts (Figure 1A) manually using commercial image processing software (Mimics; Materialise). 14,15,26 A custom MATLAB script (MathWorks) was developed to turn the segmented ligaments (Figure 1B) into 3D point clouds (Figure 1C). 21 The program used linear regression to approximate the ligament longitudinal axis in the sagittal plane (Figure 1C).

Measurement technique used to quantify the ACL or graft CSA along its length. (A) Manual ligament segmentation. (B) 3D ligament model. (C) Ligament point cloud in the original sagittal orientation. (D) Horizontally oriented ligament point cloud. (E) Regional slices, perpendicular to ligament longitudinal axis (black line), used to measure ligament CSA along its length at 1% increments. 3D, 3-dimensional; ACL, anterior cruciate ligament; CSA, cross-sectional area; MR, magnetic resonance.
The ligament was then reoriented to be horizontal based on the slope of the fitted regression line (Figure 1D). To accommodate ligament curvature, the regional longitudinal axis of the ligament was automatically determined for every 1% of ligament length (black line in Figure 1E). The regional CSA was then calculated as the area of the cross section perpendicular to the longitudinal axis at every 1% of the ligament length (colored slices in Figure 1E). A member of the team (D.M.) manually reviewed all the images representing the perpendicular slices along the ligament length (Figure 1E) to ensure measurement consistency. A subset of contralateral native ACL MRI scans used in this study were previously used to comprehensively assess the CSA profile of the native ACLs using the same approach. 21
MRI scans were also used to measure bicondylar width and intercondylar notch width using techniques described previously. 14,25 Briefly, intercondylar notch width was measured in the coronal plane, parallel to a line along the most inferior aspects of the femoral condyles. The measurement was done at the middle of the ACL attachment. Bicondylar width of the femur was also measured at the level of the popliteal groove in the same coronal view.
Statistical Analysis
CSA profile was defined as the CSA calculated at 1% increments along the normalized length of the ligament with tibial insertion at 0% and femoral insertion at 100%. Average CSA profiles were generated for each group (ie, ACLR, BEAR, native ACL) at each time point (6, 12, and 24 months) as means and 95% CIs along the length. Statistical parametric mapping (SPM) with 1-way analysis of variance (ANOVA) was used to test differences in the CSA profile along ligament length between ACLR, BEAR, and native ACL groups at each timepoint. SPM is based on random field theory and has been used extensively in time-series data in imaging and biomechanics. 13,16,17,19,27 SPM accounts for both the magnitude and the shape of the entire data set and calculates a critical threshold for each test. The SPM output includes a graph displaying test statistics along the data set (eg, time series) highlighting shaded regions where the significant differences exist (where the test statistics exceed the threshold). In the event of significant ANOVA test (P < .05), additional pairwise comparisons were conducted to compare CSA profiles between ACLR and native ACL or between BEAR and native ACL groups. The pairwise comparisons were corrected for multiple comparisons using Bonferroni correction.
The peak CSA was compared between the groups at each time point using ANOVA with Bonferroni correction for multiple comparisons. Repeated-measures ANOVA with Bonferroni correction for multiple comparisons was used to compare the changes in peak CSA from 6 to 24 months after surgery in both reconstructed and restored ACLs. Pearson correlation was used to assess the correlations between regional ligament CSA and measures of body size (ie, weight, height, and BMI) and knee size (ie, bicondylar width and intercondylar notch width) for surgically treated ACLs. Separate analyses were performed for each treatment group and each time point. Benjamini-Hochberg correction was used to control the false discovery rate and minimize type I error associated with multiple correlation testing. Pearson correlation coefficients (r) for significant correlations were then plotted along the normalized (%) ACL length. All P values are 2-sided, and the statistical significance was set at P < .05. Analyses were performed with statistical software (Prism v 9.0; GraphPad Software Inc).
Results
Group Differences in Ligament CSA Profile
The mean values and 95% CIs of CSA profiles for reconstructed ACLs, restored ACLs, and contralateral native ACLs are shown in Figure 2 A-C. At 6 months, the ACLR group CSA peaked at 67% ± 11% of length (average peak CSA, 90.4 ± 12.7 mm2) and the BEAR group CSA peaked at 52% ± 21% of length (average peak CSA, 53.4 ± 7.4 mm2), whereas the native ACL group CSA peaked at 37% ± 20% of length (average peak CSA, 44.5 ± 6.6 mm2) (Figure 2A). There were significant differences in CSA profile between the groups (ANOVA, F = 5.7; P < .001). Compared with native ACLs, reconstructed ACLs had larger CSA between 5% and 100% of the length (P < .001) (Figure 2D), whereas the restored ACL CSA was larger, at between 41% and 94% of the length (P < .001) (Figure 2G). At 6 months, the peak CSAs of reconstructed ACLs and restored ACLs were significantly larger than those of contralateral native ACLs (P < .001). The reconstructed ACLs also had a larger peak CSA than restored ACLs (P < .001).
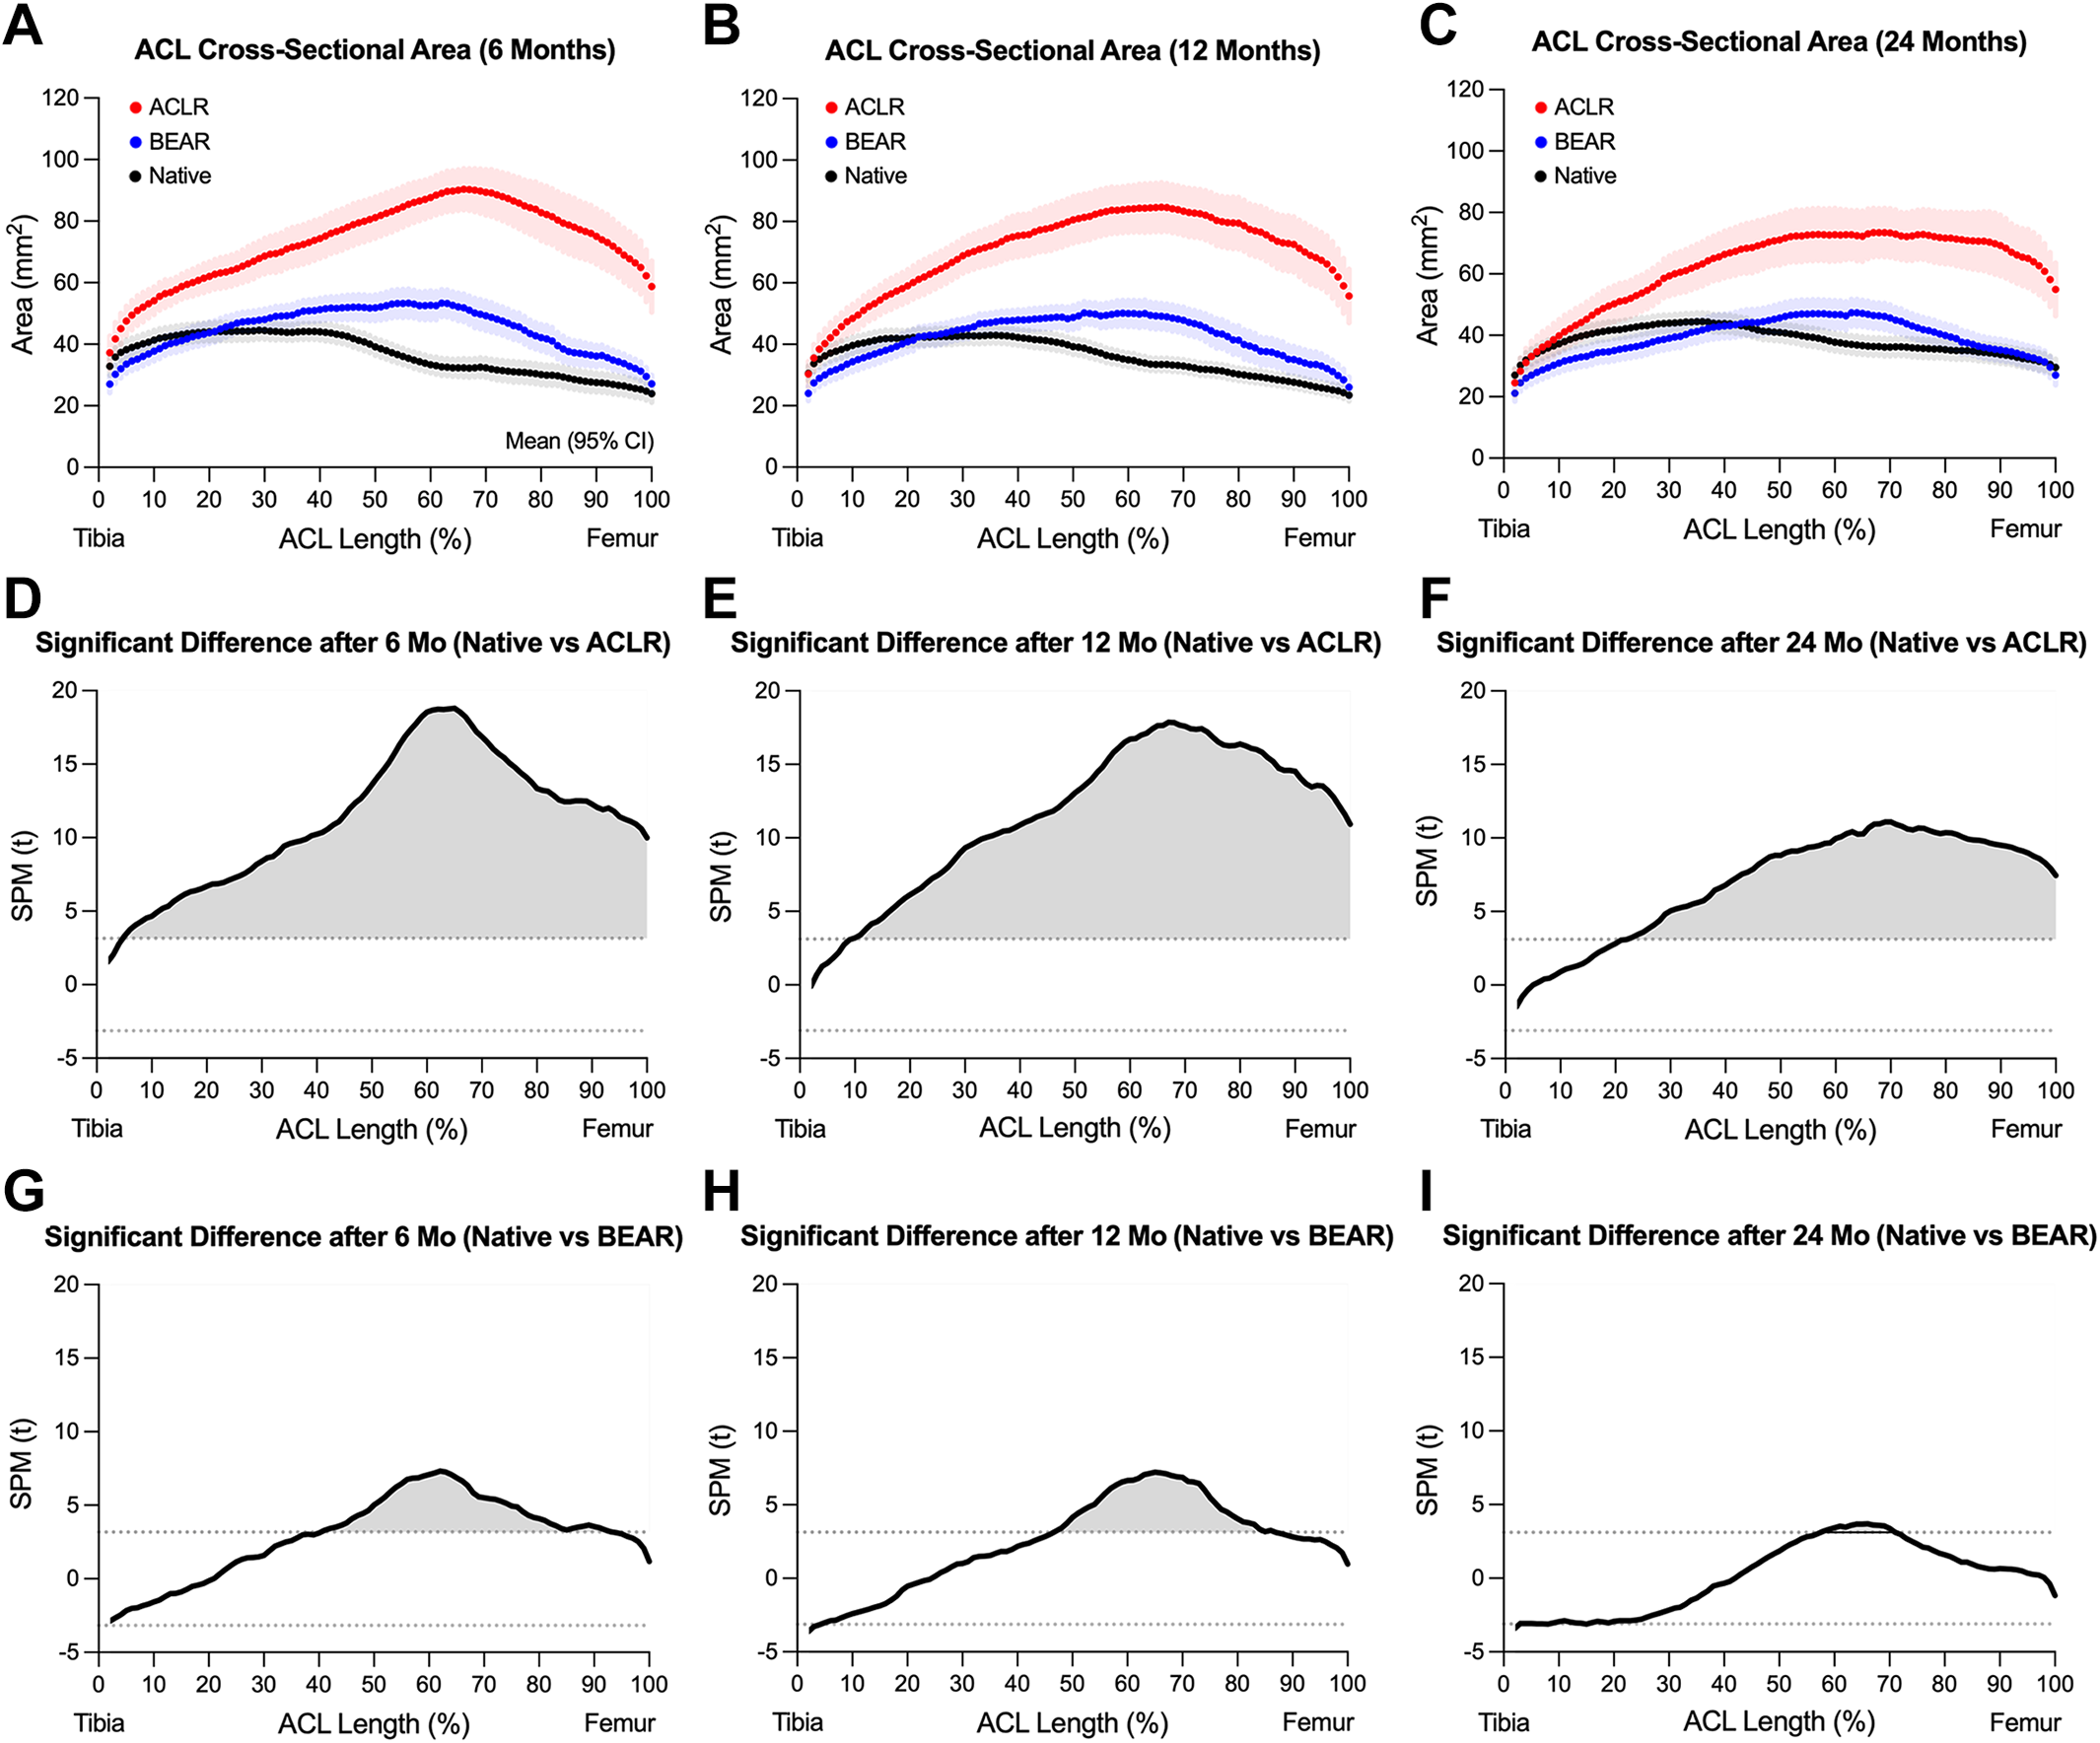
Changes in cross-sectional area along ligament length in ACLR (red), BEAR (blue), and native ACL (black) at (A) 6 months, (B) 12 months, and (C) 24 months after surgery. Data are presented as mean and 95% CI (shaded area). SPM-based pairwise comparisons between ACLR and native ACL at (D) 6 months, (E) 12 months, and (F) 24 months after surgery and between BEAR and native ACL at (G) 6 months, (H) 12 months, and (I) 24 months after surgery. The statistically different regions are highlighted in gray. ACL, anterior cruciate ligament; ACLR, ACL reconstruction group; BEAR, bridge-enhanced ACL restoration group; SPM, statistical parametric mapping.
At 12 months, CSA peaked at 65% ± 17% of the length for the ACLR group (average peak CSA, 84.6 ± 13.1 mm2), at 56% ± 21% of length for the BEAR group (average peak CSA, 50.3 ± 6.9 mm2), and at 35% ± 15% of length for the native ACL group (average peak CSA, 42.9 ± 5.9 mm2) (Figure 2B). There were significant differences in CSA profile between the groups (ANOVA, F = 5.6; P < .001). Compared with native ACLs, reconstructed ACLs had larger CSAs between 10% and 100% of the length (P < .001) (Figure 2E), whereas the restored ACL CSA was larger, at between 47% and 87% of the length (P < .001) (Figure 2H). At 12 months, the peak CSA of reconstructed ACLs and restored ACLs were significantly larger than those of contralateral native ACLs (P < .001). The reconstructed ACLs also had a larger peak CSA than restored ACLs (P < .001).
At 24 months, CSA peaked at 69% ± 20% of the length for the ACLR group (average peak CSA, 73.5 ± 12.6 mm2), at 61% ± 19% of length for the BEAR group (average peak CSA, 47.4 ± 6.3 mm2), and at 42% ± 21% of length for the native ACL group (average peak CSA, 44.4 ± 4.2 mm2) (Figure 2C). There were significant differences in CSA profile between the groups (ANOVA, F = 5.5; P < .001). Compared with native ACLs, reconstructed ACLs had larger CSA between 23% and 100% of the length (P < .001) (Figure 2F), whereas the restored ACL CSA was only larger between 58% and 71% of the length (P < .001) (Figure 2I). At 24 months, the peak CSA of reconstructed ACLs was significantly larger than restored ACLs and contralateral native ACLs (P < .001). There were no differences in peak CSA of the restored ACLs and contralateral native ACLs (P = .831).
Peak CSA of the reconstructed ACLs dropped significantly from 6 to 24 months after surgery (P = .006) (Figure 3). There were no differences in peak CSA of the reconstructed ACLs between 6 and 12 (P = .525) or between 12 and 24 (P = .162) months after surgery. Peak CSA of the restored ACLs dropped significantly from 6 to 24 months after surgery (P = .048) (Figure 3). There were no differences in peak CSA of the reconstructed ACLs between 6 and 12 (P = .688) or between 12 and 24 (P = .225) months after surgery.

Changes in peak CSA from 6 to 24 months after surgery in the ACLR and BEAR groups. Data are presented as mean and 95% CI (error bars). The average (black dotted line) and 95% CI (shaded area) of peak CSA of the contralateral native ACLs at 24 months are also shown as a reference. ACL, anterior cruciate ligament; ACLR, ACL reconstruction group; BEAR, bridge-enhanced ACL restoration group; CSA, cross-sectional area.
Ligament CSA Correlations With Body Size
For reconstructed ACLs, there were significant correlations between graft CSA and bodyweight only for proximal 70% of the length at 6 months and only for proximal 75% of the length at 12 months (P < .05) (Figure 4). There were no significant correlations between graft CSA and bodyweight at 24 months. There were also no significant correlations between graft CSA and height or BMI at any time points. For restored ACLs, there were no significant associations with any of the body size measures at any time points (P > .05).

Significant correlations in reconstructed ACL between CSA and weight. Pearson correlation coefficient has only been shown for adjusted significant (P < .05) correlations. ACL, anterior cruciate ligament; ACLR, ACL reconstruction group; CSA, cross-sectional area.
Ligament CSA Correlations With Knee and Notch Size
For reconstructed ACLs, CSA correlated significantly with the bicondylar width in the proximal 87% of the graft at 6 months, in the proximal 93% of the graft at 12 months, and within 29% to 77% of the graft length at 24 months after surgery (Figure 5A). The correlations between reconstructed ACL CSA and notch width were significant only within 24% to 67% of graft length at 24 months after surgery, with no significant correlations between graft CSA and notch width at 6 or 12 months (Figure 5B).

Significant correlations between CSA and (A) BCW and (B) intercondylar NW along graft length in reconstructed ACL. Significant correlations between CSA and (C) BCW and (D) NW along ACL length in restored ACL. Pearson correlation coefficient is shown only for adjusted significant (P < .05) correlations. ACL, anterior cruciate ligament; ACLR, ACL reconstruction group; BCW, bicondylar width; BEAR, bridge-enhanced ACL restoration group; CSA, cross-sectional area; NW, notch width.
For restored ACLs, CSA significantly correlated with the bicondylar width–within 23% to 41% of ACL length at 6 months with no significant correlations at 12 and 24 months after surgery (Figure 5C). The correlations between restored ACL CSA and notch width were significant within the proximal 90% of the ACL at 6 months and within 29% to 61% of ACL length at 12 months. There were no significant correlations between restored ACL CSA and notch width at 24 months (Figure 5D).
Discussion
The current findings supported our first hypothesis, demonstrating location dependence of ligament CSA after ACL surgery in reconstructed ACLs and restored ACLs with patterns that differ from the contralateral native ACL. For both the ACLR and BEAR groups, the difference in CSA profile between the treated ACL and contralateral native ACL decreased significantly from 6 to 24 months after surgery, supporting our second hypothesis. The findings partially supported our third hypothesis, as the only significant correlations between body size and treated ACL CSA were between bodyweight and reconstructed ACL CSA at 6 and 12 months after ACL reconstruction. Further, while CSA of the reconstructed ACLs was correlated with bicondylar width at all time points, the CSA of the restored ligament correlated with bicondylar width only at 6 months. Last, the CSA of the reconstructed ACL correlated with notch width only at 2 years, whereas the CSA of the restored ACL was correlated with notch width at 6 and 12 months after surgery. Overall, the current findings highlight the importance of location in measuring the CSA of the treated ACL and demonstrate fundamental differences in CSA profile, its postoperative changes, and relations to body size and knee size between reconstructed ACLs and restored ACLs, with restored ACLs having a CSA profile closer to that of the contralateral native ACL.
The observed differences in CSA were consistent with previous findings, showing that ACL grafts are significantly larger than the native ACL. 8,18,28,31,36 However, there are differences in the reconstructed ACL CSA and its regional differences in the cited studies compared with measurements reported in the current study. These discrepancies are primarily related to the graft type (ie, hamstrings, patellar tendon, quadriceps tendon), surgical technique (ie, single vs double bundle), graft fixation technique (ie, interference screw fixation vs suspension fixation, tunnel shape and size), measurement technique (ie, MRI from discrete location[s], direct measurement in cadavers), patient population (ie, age and sex), and time after graft reconstruction.
Debates on the optimal size of the graft and its potential clinical consequences can be found among studies. Analysis of ACL reconstruction failures showed smaller graft CSA had a potentially higher risk of rupture. 28 While hamstring autografts with a diameter <8 mm are more prone to revision, 33 oversized replacements have also been found to be problematic, as they might lead to intercondylar roof or posterior cruciate ligament impingement, which can weaken the ACL through graft abrasion or a lower range of motion. 9,28,36 In addition, it has been speculated that larger diameter grafts could negatively affect the healing process. 31 In this study, we showed that hamstring autograft-reconstructed ACLs were significantly larger at 6 months than contralateral native ACLs, almost along the whole length of the graft. This CSA difference decreased in both magnitude and extent (how much of the graft length had a larger CSA) at 12 and 24 months. However, most of the graft tissue (proximal ∼80%) remained significantly larger than the native ACL. Restored ACLs also started with larger CSA compared with contralateral native ACLs over the proximal ∼60% of the ACL, which decreased substantially over time, resulting in a CSA profile comparable with that of the native ACL at 2 years. The initially larger CSA may be attributed to the formation of scar tissue in the area of injury, in line with previous histological findings of animal models that have shown that the restored ACL gradually changes from a relatively disorganized fibrovascular scar to a more highly aligned collagenous structure over the first year of surgery. 2,12,25,30
Combined, these observations indicate continuous tissue remodeling in the grafts/ligaments of both the ACLR and the BEAR groups within the first 2 years after surgery. Interestingly, these changes were different along the length of the ligament, highlighting the importance of the location in studying ACL or graft remodeling after surgery. It has been shown previously that the true anatomic ACL footprint is difficult to reconstruct due to the “C” shape of the tibial insertion. 32 Even if standard-sized tunnels are created accurately within the ACL footprint, the size of the ACL footprint has been shown to be significantly larger than the ACL midsubstance CSA. 8,10 This makes it difficult to find an autograft that can fill the ACL footprint and reproduce the native ACL midsubstance cross-sectional size. The findings here offer more information on the reconstructed ACL morphology along its length that can direct studies on new methods of graft fixation to better replicate the anatomic ACL footprint and midsubstance CSA.
In addition, the study findings have important implications for tensioning patterns across reconstructed and restored ligaments as the knee moves toward extension, with a higher CSA at any point along the length corresponding to a lower tensile stress at that point. Moreover, we saw different patterns in reconstructed ACLs versus restored ACLs, with more remodeling in restored ACLs, which underlines the need for treatment-specific postoperative care plans. Future studies are required to determine how these postoperative regional changes in treated ACLs would influence the time for safe return to sports, with regional CSA differences further elucidating the level of native anatomy restoration and possibly the corresponding level of native function.
It is important to note that, despite the greater impingement risks and associated weakening as well as decreased range of motion, the overall greater CSA provided by reconstructed ACLs will theoretically offer greater load tolerance than the ruptured ACL was able to offer. Most previous work points to the goal of mimicking the native ACL geometry, but this is a point of discussion that deserves further study to examine the tradeoffs between increased mechanical strength and impingement with potential correlation with clinical data regarding retear rates and laxity measurements.23,35
Analysis of the relationships between body size or knee size with the CSA profile of the treated ACL supports weight as a reliable surrogate for reconstructed hamstring autograft CSA within 1 year after ACL reconstruction. Interestingly, we did not find any significant associations between graft CSA and height or BMI, after controlling for false discovery rate. This finding is in agreement with similar associations between CSA profile of the native ACL and weight, 21 as well as several previous studies suggesting weight as a predictor of hamstring autograft size. 3,20,29,38 Similar to weight, knee size (bicondylar width) was also associated with graft CSA along almost the entire graft length within the first year after surgery and along the midsubstance of the graft at 2 years. We also saw significant correlations between notch width and graft midsubstance CSA only at 2 years. Cumulatively, these findings suggest that at early stages of healing, the hamstring autograft size can be predicted by body height or knee size, while at later stages (>1 year) the graft size will be mainly regulated locally (ie, knee size or notch width). In contrast to reconstructed ACLs, no measures of body size were correlated with restored ACL CSA within the first 2 years after the BEAR procedure. Moreover, restored ACL CSA was only correlated with knee size and notch size within the first year after BEAR surgery. These observations suggest that initial remodeling of the restored ACL is primarily modulated locally, independent of body size.
The findings highlight the differences in the remodeling processes of the two procedures and how they relate to CSA, with ACL reconstruction using intraligamentous and intraosseous remodeling to reconstruct the ACL using a tendon from a nonknee environment and the BEAR procedure using mainly aperture-site healing to repair the anatomic structure of the knee. Overall, the BEAR-restored ligaments seemed to more closely mimic the native ACL than did the reconstructed ligaments. However, these differences warrant the need for further research to understand the effect of those remodeling differences on outcomes, which may help in developing accurate subjective criteria to determine time for safe return to sports after each treatment.
Limitations
There were several limitations in this study. First, the data for the native ACLs were collected from the contralateral intact ACLs of patients with unilateral ACL injury, which may have introduced bias to the findings, as these patients may be more susceptible to ACL injury. Despite the relevance of this cohort to ACL injury risk, additional analyses on the ACLs of patients without any ACL injury history may yield different findings. In addition, time-zero data were not recorded so the trend in the surgical to 6-month postoperative profile could not be studied. Another limitation with this study is that it is not currently linked to any biomechanical or clinical data to examine correlations between CSA and strength, laxity, and retear rates. Work is underway to link these findings with these data. Finally, the measurements were done with the knee at full extension, consistent with knee positioning during the MRI. The effect that changing knee flexion would have on current observations requires further investigation.
Conclusion
The study findings demonstrated that both ACL reconstructions using autologous hamstring grafts and restored ACLs continue to remodel within the first 2 years after surgery. Moreover, similar to the native ACL, the surgically treated ACL also has a heterogeneous CSA along its length. However, there are major dimensional and morphological differences between surgically treated and contralateral native ACLs that significantly vary within the first 2 years after surgery. Finally, in addition to differences in size and morphology, there are fundamental differences in factors contributing to ligament CSA profile between the ACL reconstruction and BEAR procedures.
Footnotes
Acknowledgment
The authors acknowledge the significant contributions of the clinical trial team, including Bethany Trainor. They also acknowledge the contributions of the medical safety monitoring team of Joseph DeAngelis, Peter Nigrovic, and Carolyn Hettrich; data monitors Maggie Malsch, Meghan Fitzgerald, and Erica Denhoff; as well as the clinical care team for the trial patients, including Kathryn Ackerman, Alyssa Aguiar, Judd Allen, Michael Beasley, Jennifer Beck, Dennis Borg, Jeff Brodeur, Stephanie Burgess, Melissa Christino, Sarah Collins, Gianmichel Corrado, Sara Carpenito, Corey Dawkins, Pierre D’Hemecourt, Jon Ferguson, Michele Flannery, Casey Gavin, Ellen Geminiani, Stacey Gigante, Annie Griffin, Emily Hanson, Elspeth Hart, Jackie Hastings, Pamela Horne-Goffigan, Christine Gonzalez, Meghan Keating, Elizabeth KillKelly, Elizabeth Kramer, Pamela Lang, Hayley Lough, Chaimae Martin, Michael McClincy, William Meehan, Ariana Moccia, Jen Morse, Mariah Mullen, Stacey Murphy, Emily Niu, Michael O’Brien, Nikolas Paschos, Katrina Plavetsky, Bridget Quinn, Shannon Savage, Edward Schleyer, Benjamin Shore, Cynthia Stein, Andrea Stracciolini, Dai Sugimoto, Dylan Taylor, Ashleigh Thorogood, Kevin Wenner, Brianna Quintiliani, and Natasha Trentacosta. The authors thank the perioperative and operating room staff and the members of the Department of Anesthesia who were extremely helpful in developing the perioperative and intraoperative protocols. They acknowledge the efforts of other scaffold manufacturing team members, including Gabe Perrone, Gordon Roberts, Doris Peterkin, and Jakob Sieker. The authors are grateful for the study design guidance provided by the Division of Orthopedic Devices at the Center for Devices and Radiological Health at the US Food and Drug Administration under the guidance of Laurence Coyne and Mark Melkerson, particularly the efforts of Casey Hanley, Peter Hudson, Jemin Dedania, Pooja Panigrahi, and Neil Barkin. Last, the authors acknowledge funding support from the Translational Research Program at Boston Children’s Hospital, the Children’s Hospital Orthopaedic Surgery Foundation, the Children’s Hospital Sports Medicine Foundation and the National Institutes of Health and the National Institute of Arthritis and Musculoskeletal and Skin Diseases through grant Nos. R01-AR065462 and R01-AR056834. This research was also conducted with support from the Football Players Health Study at Harvard University. The Football Players Health Study is funded by a grant from the National Football League Players Association. The content is solely the responsibility of the authors and does not necessarily represent the official views of Harvard Medical School, Harvard University or its affiliated academic health care centers, the National Football League Players Association, Boston Children’s Hospital or the National Institutes of Health. The authors are especially grateful to the patients and their families who participated in this study; their willingness to participate in research that may help others in the future inspires all of us.
All authors are listed in the Authors section at the end of this article.
AUTHORS
Danilo Menghini, MS (Department of Orthopedic Surgery, Boston Children’s Hospital, Harvard Medical School, Boston, Massachusetts, USA; Department of Health Sciences and Technology, ETH Zurich, Zurich, Switzerland); Shankar G. Kaushal, MS (Department of Orthopedic Surgery, Boston Children’s Hospital, Harvard Medical School, Boston, Massachusetts, USA); Sean W. Flannery, PhD (Department of Orthopaedics, Warren Alpert Medical School of Brown University, Rhode Island Hospital, Providence, Rhode Island, USA); Kirsten Ecklund, MD (Department of Radiology, Boston Children’s Hospital, Harvard Medical School, Boston, Massachusetts, USA); Benedikt Proffen, MD (BEAR Trial Team, Boston Children’s Hospital Boston, Massachusetts, USA); Nicholas Sant, BS (BEAR Trial Team, Boston Children’s Hospital Boston, Massachusetts, USA); Gabriela Portilla, BS (BEAR Trial Team, Boston Children’s Hospital Boston, Massachusetts, USA); Ryan Sanborn, BS (BEAR Trial Team, Boston Children’s Hospital Boston, Massachusetts, USA); Christina Freiberger, MS (BEAR Trial Team, Boston Children’s Hospital Boston, Massachusetts, USA); Rachael Henderson, BS (BEAR Trial Team, Boston Children’s Hospital Boston, Massachusetts, USA); Samuel Barnett, MD (BEAR Trial Team, Boston Children’s Hospital Boston, Massachusetts, USA); Yi-Meng Yen, MD (BEAR Trial Team, Boston Children’s Hospital Boston, Massachusetts, USA); Dennis E. Kramer, MD (BEAR Trial Team, Boston Children’s Hospital Boston, Massachusetts, USA); Lyle J. Micheli, MD (BEAR Trial Team, Boston Children’s Hospital Boston, Massachusetts, USA); Martha M. Murray, MD (Department of Orthopedic Surgery, Boston Children’s Hospital, Harvard Medical School, Boston, Massachusetts, USA); Braden C. Fleming, PhD (Department of Orthopaedics, Warren Alpert Medical School of Brown University, Rhode Island Hospital, Providence, Rhode Island, USA); and Ata M. Kiapour, PhD (Department of Orthopedic Surgery, Boston Children’s Hospital, Harvard Medical School, Boston, Massachusetts, USA).
Final revision submitted July 18, 2022; accepted August 2, 2022.
One or more of the authors has declared the following potential conflict of interest or source of funding: this study received funding support from the Translational Research Program at Boston Children’s Hospital, the Children’s Hospital Orthopaedic Surgery Foundation, the Children’s Hospital Sports Medicine Foundation, the Football Players Health Study at Harvard University, and the National Institutes of Health and the National Institute of Arthritis and Musculoskeletal and Skin Diseases (grants R01-AR065462 and R01-AR056834). M.M.M. is a founder, paid consultant, and equity holder in Miach Orthopaedics, which was formed to work on upscaling production of the BEAR scaffold. M.M.M. maintained a conflict-of-interest management plan that was approved by Boston Children’s Hospital and Harvard Medical School during the conduct of the trial, with oversight by both conflict-of-interest committees and the institutional review board of Boston Children’s Hospital, as well as the US Food and Drug Administration. B.C.F. is an assistant editor for The American Journal of Sports Medicine and the spouse of M.M.M., with the inherently same conflicts. A.M.K. is a paid consultant for Miach Orthopaedics and maintained a conflict-of-interest management plan that was approved by Boston Children’s Hospital and Harvard Medical School during the conduct of the trial, with oversight by both conflict-of-interest committees and the institutional review board of Boston Children’s Hospital. For the BEAR Trial Team, D.E.K., L.J.M., and Y.-M.Y. all have disclosures as listed in the American Academy of Orthopaedic Surgeons database, none of which is related to this current project or technology. These include educational payments from Kairos Surgical (D.E.K., Y.-M.Y.). L.J.M. also has received hospitality payments from various companies. B.P. has manufactured the scaffolds used in the trials at Boston Children’s Hospital and is a paid consultant and equity holder in Miach Orthopaedics at this time, as he assists with transfer of the manufacturing process to the contract manufacturing organization that Miach has engaged to do the manufacturing. N.S. has manufactured scaffolds used in the trials at Boston Children’s Hospital and is a paid consultant for Miach Orthopaedics. B.P. and N.S. maintain a conflict-of-interest management plan that was approved by Boston Children’s Hospital and Harvard Medical School during the conduct of the trial, with oversight by both conflict-of-interest committees and the institutional review board of Boston Children’s Hospital. AOSSM checks author disclosures against the Open Payments Database (OPD). AOSSM has not conducted an independent investigation on the OPD and disclaims any liability or responsibility relating thereto.
Ethical approval for this study was obtained from Boston Children’s Hospital (protocol No. IRB-P00021470).