
Abstract
Background:
Although lower extremity biomechanics has been correlated with traditional metrics among baseball players, its association with advanced statistical metrics has not been evaluated.
Purpose:
To establish normative biomechanical parameters during the countermovement jump (CMJ) among Major League Baseball (MLB) players and evaluate the relationship between CMJ-developed algorithms and advanced statistical metrics.
Study Design:
Cohort study; Level of evidence, 3.
Methods:
MLB players in 2 professional organizations performed the CMJ at the beginning of each baseball season from 2013 to 2017. We collected ground-reaction force data including the eccentric rate of force development (“load”), concentric vertical force (“explode”), and concentric vertical impulse (“drive”) as well as the Sparta Score. The advanced statistical metrics from each baseball season (eg, fielding independent pitching [FIP], weighted stolen base runs [wSB], and weighted on-base average) were also gathered for the study participants. The minimal detectable change (MDC) was calculated for each CMJ variable to establish normative parameters. Pearson coefficient analysis and regression trees were used to evaluate associations between CMJ data and advanced statistical metrics for the players.
Results:
A total of 151 pitchers and 138 batters were included in the final analysis. The MDC for “load,” “explode,” “drive,” and the Sparta Score was 10.3, 8.1, 8.7, and 4.6, respectively, and all demonstrated good reliability (intraclass correlation coefficient > 0.75). There was a weak but statistically significant correlation between the Sparta Score and wSB (r = 0.23; P = .007); however, there were no significant correlations with any other advanced metrics. Regression trees demonstrated superior FIP with higher Sparta Scores in older pitchers compared with younger pitchers.
Conclusion:
There was a positive but weak correlation between the Sparta Score and base-stealing performance among professional baseball players. Additionally, older pitchers with a higher Sparta Score had statistically superior FIP compared with younger pitchers with a similar Sparta Score after adjusting for age.
Keywords
Pitching performance in baseball has historically relied on more traditional statistics, including win-loss record, earned run average (ERA), innings pitched, and walks plus hits per inning pitched. However, there has been a shift toward evaluating the efficacy of advanced statistical metrics, such as fielding independent pitching (FIP), when assessing various outcome measures. 12 These measures attempt to isolate a pitcher’s performance by negating the effect of variable defense and offense. To optimize athletic performance, the goal is to find objective proxy measurements of physical function and, ultimately, athletic ability. The ideal features of any tool should not only include both reliability and reproducibility but also provide actionable data to target athletic deficiencies. 6 With interventions, this could serve as a predictor for superior athletic performance outcomes.
Previous studies have attempted to correlate quantifiable biomechanical measurements with athletic performance in baseball. 18,31 MacWilliams and colleagues 18 observed a strong correlation between lower extremity ground-reaction force (GRF) and wrist velocity in pitchers, concluding that lower extremity biomechanics contributes heavily to the throwing motion. Other studies have attempted to assess the biomechanics of swinging a baseball bat by measuring lower extremity force generation and trunk rotation, leading to predictors of bat swing velocity. 31 However, endpoint measures such as pitch velocity and bat swing velocity do not adequately predict pitcher or batter performance in isolation. 7,29,30
Owing to its simplicity and effectiveness, the countermovement jump (CMJ) has been one of the most utilized tests to monitor a person’s neuromuscular system. 5,9,13 The CMJ is performed by starting in the upright standing position, followed by a downward movement by flexing the knees and hips, and then immediately extending both knees and hips to jump vertically off the ground with maximum force. 3 Within a single CMJ, multiple reliable kinematic measurements can be recorded such as power, force velocity, and duration of muscle contraction. 5 Furthermore, the efficient conversion of force from eccentric to concentric contraction can be measured. The amount of wasted energy during this transition has been shown to be affected by the speed of change from the stretching to shortening of fibers at the initiation of concentric muscle contraction as well as by the consistency and efficiency of body movement patterns. 25 From an aggregation of these measures, scoring systems have been developed to attempt to quantify the overall neuromuscular status. 19,20 These systems generate a composite score of a person’s ability to produce and efficiently apply force.
The purpose of this study was to establish normative biomechanical parameters during the CMJ among Major League Baseball (MLB) players and investigate the relationship between CMJ-developed algorithms and advanced statistical metrics. Our hypothesis was that as composite CMJ values increase, advanced statistical metrics would also increase.
Methods
Data were retrospectively gathered from athletes in 2 professional baseball organizations who played from 2013 to 2017. Study inclusion criteria consisted of being a professional baseball player at the MLB level, currently participating in all training sessions and competitions, and not having undergone orthopaedic surgery in the previous year. Exclusion criteria consisted of reporting pain during testing and currently being under a physician’s care for a musculoskeletal injury or surgery. Ethics approval for this study was waived by an institutional review board.
Before CMJ data collection, each player performed a standardized warm-up consisting of jogging, a dynamic warm-up including high knees and carioca, and practice vertical leaps. Players were then instructed to perform 6 CMJs with maximal height, with a 30-second break in between each trial. A commercially available piezoelectric force plate with a sampling frequency of 1000 Hz (9260AA6; Kistler) and a commercially available software platform (Force Plate Machine Learning; Sparta Science) were used to collect all GRF and athlete descriptive data. Before testing, the force plate was calibrated according to the manufacturer’s specifications, and it was reset to zero before each test. 33
GRF Data Collection and Manipulation
A total of 3 force-time variables (“load” = average eccentric rate of force development; “explode” = average concentric vertical force, and “drive” = average concentric vertical impulse) were extracted from GRF data via numerical integration 16 during both the eccentric and the concentric phases of each jump. 23 For comparisons across variables, “load,” “explode,” and “drive” measurements from each test were converted to normalized T-scores via the following formula:

where 50 is the mean of possible scores (ie, 0-100). After the completion of all 6 jumps, “load” T-scores from the 3 jumps with maximal height were averaged to obtain an overall T-score for “load.” Similar calculations were used to compute T-scores for “explode” and “drive.”
The Sparta Score (Sparta Science) is a proprietary algorithm developed to best represent an athlete’s risk of injuries and improved potential for higher performance. The Sparta Score was calculated from individual T-scores via the following formula:

where avgLED, minLED, and maxLED represent the average, minimum, and maximum of the “load,” “explode,” and “drive” T-scores from the test, respectively. The sequence avgLED + minLED serves as a normalized measure of overall CMJ test performance, while the sequence maxLED – minLED serves as a measure of player imbalance. The coefficients were developed so as to allow the numerical output of the Sparta Score to lie on a continuous scale between 0 and 100 for standardization and ease of use.
Performance Data Collection and Establishing of Normative Parameters
Player performance data were manually obtained from a publicly available online source (www.baseball-reference.com). Performance data and jump-test data were matched using a series of unique identification numbers. Pitcher performance was measured by FIP, defined as

where K represents strike outs, HR represents home runs, BB represents base on balls, HBP represents hit by pitch, and IP represents innings pitched by the starting pitcher. FIP is similar to ERA but only includes events that pitchers have the most control over (ie, strikeouts, unintentional walks, hits by pitch, and home runs) while removing the results on balls hit into the field of play. 22 The FIP constant varies from year to year but was 3.1 for 2013-2017 27 and was the value used for the analysis herein. In general, the constant is chosen to place FIP on the same scale as ERA for easier interpretation. For example, a FIP value of 2.9 would be roughly equivalent to an ERA value of 2.9, assuming that the pitcher had “typical” results on all balls in play. To compare FIP with pitcher CMJ tests, Sparta Scores were averaged across each player-season for major league players only. Players’ mean CMJ values and Sparta Scores were compared with the corresponding FIP value by season.
Weighted on-base average (wOBA) and on-base plus slugging (OPS) by season were used to assess the overall performance of MLB batters in the sample. 28 Base running was assessed by stolen bases (SB) and weighted stolen base runs (wSB). The latter metric is defined as

where runSB represents stolen base runs, CS represents caught stealing, runCS represents caught stealing runs, lgwSB represents league-weighted stolen base runs, 1B represents batter reaching first base with a hit, BB represents base on balls, HBP represents hit by pitch, and IBB represents intentional walk. The variables runSB and runCS represent the added run values of SB and a caught stealing attempt. The values used here were 0.2 and –0.4, respectively. 14 The variable lgwSB is the league average, was around 0.0037 for 2014, and was the value used for the analysis herein. Similarly, players’ mean CMJ values and Sparta Scores were compared with the corresponding wOBA, OPS, SB, and wSB by season.
To establish normative parameters for the CMJ metrics, the minimal detectable change (MDC) was calculated for each GRF variable and Sparta Score. The MDC is defined as the minimum amount of change due to the contribution of real modifications in performance rather than due to random measurement errors. 10,11 As done previously in the literature, the MDC90 for each variable was calculated using the standard error of measurement (SEM) and 90% level of confidence (ie, MDC90 = SEM × 1.96 × √2). 2 Additionally, the intraclass correlation coefficient (ICC) and standard deviation of each variable were used to calculate the SEM (ie, SEM = SD√[1 – ICC]).
Statistical Analysis
Descriptive statistics are reported as mean ± SD unless otherwise stated. The reliability of all test statistics was assessed by calculating ICCs between tests that were administered within 30 days in the same player. Values <0.5 are indicative of poor reliability, values between 0.5 and 0.75 indicate moderate reliability, values between 0.76 and 0.9 indicate good reliability, and values >0.90 indicate excellent reliability. 15 Pearson coefficient analysis was performed to evaluate the correlation between the Sparta Score and each baseball performance value. The strength of the correlation was defined as very strong (≥0.80), moderate (0.60-0.79), fair (0.30-0.59), or weak (0.10-0.29). 1 Regression trees were further used to describe the relationship between the Sparta Score and performance metrics after adjusting for player age as a covariate predictor. Plate appearance (PA) was used as a covariate in the SB model only because SB was the only count-based dependent variable. The Welch 2-sample t test was utilized to determine relationships between groups. All statistical analyses were conducted using R (V3.5.0 [2019]; R Core Team). All regression trees were fit and pruned using the recursive partitioning and regression trees package (V4.15 [2019]; Therneau T, Atkinson B, Ripley B). Tree results were displayed using the Rattle package.
Results
A total of 151 pitchers and 138 batters were included in the final analysis. The mean age of all pitchers was 24.15 ± 4.24 years, while the mean age of all batters was 23.61 ± 3.95 years. CMJ test metrics as well as Sparta Scores are broken down by player position and detailed in Table 1. Pitchers had a total of 2255 CMJ tests with a mean Sparta Score of 84.9 ± 4.1, while batters (ie, nonpitchers) had a total of 1744 CMJ tests with a mean Sparta Score of 85.2 ± 4.5. Of note, there was a statistically significant difference in “explode” (P < .001), “drive” (P = .002), and Sparta Score (P = .039) values in the player groups.
CMJ Values and Sparta Scores by Player Position a

a Data are reported as mean ± SD. Bolded P values indicate a statistically significant between-group difference (P < .05). CMJ, countermovement jump.
MDC and Reliability of CMJ Measures
The MDC values of all CMJ test metrics are summarized in Table 2. The “load,” “explode,” “drive,” and Sparta Score had MDC values of 10.3, 8.1, 8.7, and 4.6, respectively. All 3 CMJ metrics as well as the Sparta Score exhibited good reliability (ICC > 0.75). 12
Reliability of Ground-Reaction Force Measurements a

a ICC, intraclass correlation coefficient; MDC, minimal detectable change; SEM, standard error of measurement.
Analysis Between Performance Metrics and the Sparta Score
Pearson coefficient analysis between FIP and the Sparta Score did not demonstrate any statistical correlation (Table 3). Batter-specific analysis indicated a weak but statistically significantly positive correlation between SB and the Sparta Score (r = 0.24; P = .004) as well as between wSB and the Sparta Score (r = 0.23; P = .007).
Pearson Correlations Between Performance Metrics and the Sparta Score by Player Position a

a Bolded P values indicate a statistical significance (P < .05). FIP, fielding independent pitching; OPS, on-base plus slugging; PA, plate appearance; SB, stolen bases; wOBA, weighted on-base average; wSB, weighted stolen base runs.
Regression analysis indicated that older pitchers (≥29 years) with a Sparta Score ≥85 had the best (ie, lowest) FIP, followed by older pitchers with a Sparta Score <85, younger pitchers (<29 years) with a Sparta Score ≥81, and younger pitchers with a Sparta Score <81 having the worst (highest) FIP (Figure 1 and Table 4). The t test analysis of the subgroups indicated that older pitchers with a Sparta Score ≥85 had statistically lower FIP values compared with older pitchers with a Sparta Score <85 (P = .001), younger pitchers with a Sparta Score ≥81 (P < .001), and young pitchers with a Sparta Score <81 (P = .012) (Table 5).

Regression tree of fielding independent pitching (FIP) by pitcher age and the Sparta Score. The numbers in each node show (from top to bottom, left to right) the mean FIP, sample size, and percentage of the total sample in the node.
FIP From Regression Trees a

a FIP, fielding independent pitching.
Comparison Between FIP, Age, and the Sparta Score for Regression Tree Subgroups a

a Bolded P values indicate a statistical significance (P < .05). FIP, fielding independent pitching; OA, older players with a Sparta Score ≥85; OB, older players with a Sparta Score <85; YA, younger players with a Sparta Score ≥81; YB, younger players with a Sparta Score <81.
Regression analysis for batters demonstrated no statistically significant relationships between the Sparta Score and wOBA or OPS. Both fitted regression trees found only a single difference for age (larger values for age >23 years), with no effect from the Sparta Score. Figure 2 provides the difference in players’ SB based on the Sparta Score, age, and PA. The regression tree showed that players with numerous PAs (>362) who had a Sparta Score ≥89 may be the best base stealers, followed by younger players (<29 years) with a Sparta Score ≥86. The t test subanalysis of those with numerous PAs indicated that the mean SB was statistically higher in the group with a Sparta Score ≥89 compared with the group with a Sparta Score <89 (19.0 vs 7.7, respectively; P = .001).
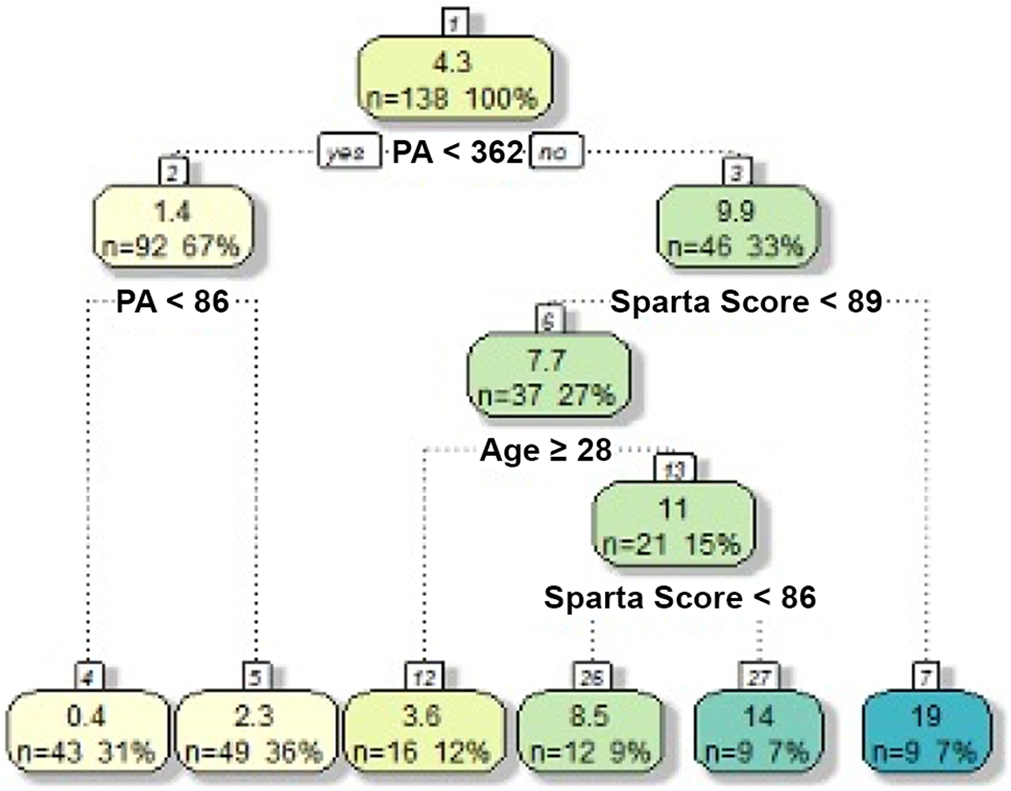
Regression tree of stolen bases by plate appearance (PA), player age, and the Sparta Score. The numbers in each node show (from top to bottom, left to right) the mean, sample size, and percentage of the total sample in the node.
Discussion
The main findings of this investigation were that the CMJ values including “load,” “explode,” “drive,” and the Sparta Score had good reliability within a baseball data set, with a high ICC as well as an MDC of 10.3, 8.1, 8.7, and 4.6, respectively. Additionally, MLB pitchers with higher Sparta Scores tended to have a lower FIP value after adjusting for age. Last, there was a weak but statistically significant correlation between the Sparta Score and an increase in SB; however, no other statistical correlations between the Sparta Score and batter performance were observed.
To our knowledge, this is the first study to provide normative CMJ parameters by establishing the MDC90 for “load,” “explode,” and “drive” as well as the Sparta Score. The MDC90 provides clinicians and athletic staff with the ability to identify a change to which the contribution of real modifications in performance is likely to be greater than that of a random measurement error. 11 Additionally, compared with other measurement tools for baseball players, the Sparta Score had similarly good reliability. 24,32 Nimphius et al 24 examined GRF during specific phases of the windmill pitch and assessed the reliability of 7 data points as well as pitch velocity. They found coefficients of variation (CVs) ranging from 1.4% to 5.2% and good to excellent ICCs for each measured data point. 24 Thomas et al 32 assessed the reliability of the dynamic strength index for the CMJ, finding excellent ICCs and CVs of 2.6% to 4.6%. These previous studies are consistent with our CVs (2%-8%) and good to excellent ICCs among all measured variables.
While the current study did not identify a direct correlation between FIP and the Sparta Score, stratification by age indicated that older players with higher Sparta Scores had statistically lower FIP values compared with older players with lower scores and younger players. These observations may be caused by a combination of both refined techniques and physical ability more commonly seen in veteran pitchers. 8,26 Whiteside et al 35 showed that FIP could be predicted by not only pitch speed but also pitch speed variation, release location consistency, and horizontal release location. The latter 3 variables relate to technique as opposed to physical ability. Thus, pitchers and coaches should focus on improving the pitching technique and, as this study suggests, neuromuscular performance to enhance pitching outcomes.
The ability to successfully steal bases has previously been shown to rely on speed, acceleration, reaction time, and processing a pitcher’s motion. 4 Furthermore, efficiency in producing a large initial GRF correlates with a better base-stealing start. 21 Watanabe et al 34 found that vertical jump height was a significant predictor of SB performance. When investigating the advanced wSB metric, we found that there was a significant correlation with the Sparta Score, with a predicted increase of 0.04 wSB for each 1-point increase in the Sparta Score. When looking at traditional metrics, there was a small positive correlation between the Sparta Score and SB, with a mean predicted increase of 1 SB for every 3-point increase in the Sparta Score after adjusting for age and PA. The Classification and Regression Tree model (Figure 2) suggests that players with a higher volume of PA (>362) who had a Sparta Score ≥89 may be the best base stealers, followed by younger players (<29 years) with a Sparta Score ≥86. These findings are not surprising, considering that higher volume base runners have more opportunities to improve technical aspects such as reaction time and ability to read pitchers’ movements. Those with higher Sparta Scores have greater CMJ force variables, which have been shown to correlate with better acceleration and speed. 17 In the context of previous studies, our study demonstrated a moderate correlation between improved Sparta Scores and traditional and advanced base-stealing metrics.
Finally, the current study did not observe a relationship between the Sparta Score and wOBA or any other less global measures of hitting, including hits, home runs, runs, on-base percentage, slugging percentage, or runs batted in. Similar findings were maintained after adjusting for age, games played, PA, and position. Previous studies have shown that an increase in physical ability such as lower extremity power and rotational strength correlates with increased bat velocity. 30 However, the previous literature has observed that bat velocity only moderately correlates with exit velocity of the baseball and is not the only variable that translates to statistical batting success. 7,29 Other measures such as plate discipline, bat vibration on impact, and pitch speed also play a role in batting success. Therefore, we did not find a statistical significance in our endpoint measures as they relate to the Sparta Score.
Limitations
There are a number of limitations in the current study that should be addressed. First, as with all retrospective cross-sectional studies, this analysis was limited by a lack of longitudinal follow-up and access to additional variables, which may have confounded the results. Second, the study lacked test-retest ability, standardized time points for testing, and standardized warm-ups before testing. Third, while differences in the CMJ values and Sparta Scores were observed when compared by field player groups, there were large differences in group sizes, which may have led to type I errors. Fourth, while there have been internal validation studies of the Sparta Score within Sparta Science, there are no independent validation studies currently available in the literature. Future studies may seek to validate the Sparta Score for use in baseball as well as other sports. Fifth, publicly sourced performance data were used in this study, which could decrease the reliability of the data. Additionally, a validation analysis on the public data was not performed to evaluate reliability. Sixth, there is the opportunity for nonrepresentative results based on small sample sizes in those players who are called up to MLB from the minor leagues for short stints, meaning that those players who participate in only a small number of innings as opposed to a full season may not be a large enough sample to allow for “normalized” FIP. Last, only 2 MLB club teams were included in the study, which may limit the generalizability of the results for other teams.
Conclusion
The MDC for “load,” “explode,” “drive,” and the Sparta Score was 10.3, 8.1, 8.7, and 4.6, respectively, and all demonstrated good reliability. There was a positive correlation between the Sparta Score and base-stealing performance among professional baseball players. Additionally, older pitchers with higher Sparta Scores tended to have statistically lower FIP values after adjusting for age. These results suggest that a combination of both refined techniques and physical ability, more commonly seen in older players, results in superior MLB pitching metrics.
Footnotes
Final revision submitted October 18, 2020; accepted December 14, 2020.
One or more of the authors has declared the following potential conflict of interest or source of funding: B.R.W. has received grants from Arthrex, Encore Medical, and Smith & Nephew; education payments from Arthrex; consulting fees from Genzyme; nonconsulting fees from Arthrex; royalties from Elsevier; honoraria from Vericel; and hospitality payments from Wright Medical and DePuy. AOSSM checks author disclosures against the Open Payments Database (OPD). AOSSM has not conducted an independent investigation on the OPD and disclaims any liability or responsibility relating thereto.
Ethical approval for this study was waived by Wake Forest University (exemption protocol: IRB00065241).