
Abstract
Major league baseball (MLB) pitchers are at risk of numerous injuries during play, and there is an increasing focus on evaluating their performance in the context of injury. Historically, performance after return to play (RTP) from injury has focused on general descriptive statistics, such as innings or games played, or rate statistics with inherent variability (eg, earned run average, walks and hits per inning pitched, strikeouts per 9 innings, or walks per 9 innings). However, in recent years, MLB has incorporated advanced technology and tracking systems in every stadium, allowing for more in-depth analysis of pitcher-specific data that are captured with every pitch of every game. This technology allows for the ability to delve into the pitching performance on a basis that is more specific to each pitcher and allows for more in-depth analysis of different aspects of pitching performance. The purpose of this narrative review was to illustrate the current state of injury recording for professional baseball pitchers, highlight recent technological advances in MLB, and describe the advanced data available for analysis. We used advanced data in the literature to review the current state of performance analysis after RTP in MLB pitchers after injury. Finally, we strived to provide a framework for future studies to more meticulously assess RTP performance given the current available resources for analysis.
Given the demands of the position, baseball pitchers are inherently at significant risk of injury, with Camp et al 4 reporting that they account for 39% of professional baseball injuries. Pitchers typically occupy approximately 46% to 50% of roster spots per the Major League Baseball (MLB) website. 1 These injuries range from shorter-term soft tissue injuries to ulnar collateral ligament (UCL) injuries that lead to an extended loss of play and extended recovery. 4 In particular, return to play (RTP) after UCL reconstruction (UCLR) has been extensively studied ∥ given the reported nearly US$2 million in cost of recovery per MLB pitcher after UCLR. 45 Studies have also begun to examine performance after RTP for other injuries, including revision UCLR, 31,37,41 thoracic outlet syndrome, 26,62 superior labral anterior-posterior (SLAP) or labral tears, 5,56,60 olecranon fractures, 15 rotator cuff tears, 18 latissimus or teres major tears, 17 ulnar neuropathy at the elbow, 19 forearm flexor tendon injuries, 28 femoroacetabular impingement (FAI), 8,22,59 pars defects, 24 and cervical or lumbar disk herniations. 57
The majority of MLB pitcher analysis after injury has focused on general descriptive statistics (such as wins, innings pitched, and games played) or on rate statistics with inherent variability (such as earned run average [ERA], walks and hits per inning pitched [WHIP], strikeouts per 9 innings [K/9], or walks per 9 innings [BB/9]). 10,63 However, in our opinion, and that of many in the baseball community, these rate statistics are confounding variables that may be limited by small sample sizes or variability because of factors outside of the pitcher’s control (such as team fielding, catching performance and framing, or different stadiums). In addition, descriptive statistics, such as innings pitched or games played after injury, may reflect different roles on a team, different teams, or midseason returns, and they alone do not sufficiently state the true performance of a player.
There is now a private electronic medical record (EMR) database, the Health and Injury Tracking System (HITS), 52 of MLB injuries that allows for increased precision and accurate analysis of player injuries in comparison with public databases or public review of injuries. 29 Recent advances related to in-game tracking technology allow for a more comprehensive analysis of pitcher-specific data captured with every pitch thrown by pitchers. These technological advances produce a tremendous amount of data, including pitch velocity and spin rate, which allows for the ability to delve into the pitching performance on a basis that is more specific to each pitcher and further allows for a more granular analysis of pitching performance.
The purpose of this narrative review was to illustrate the current state of injury recording for professional baseball pitchers, highlight recent technological advances in MLB, and describe the advanced data available for analysis. We then reviewed the current state of performance analysis using advanced data in the literature after RTP in MLB and professional pitchers after injury. Finally, we aimed to provide a framework for future studies to more meticulously assess performance after injury given the current available resources for analysis.
Injury Collection and Recording
Accurate injury collection and recording is essential for high-quality analysis of performance after RTP. Many studies have previously used a review of MLB injury reports and press releases in order to identify injuries. Specific to UCL injuries, there is also an up-to-date database of all college and professional UCL injuries (Tommy John Surgery List 58 ). We are unaware of any extensive public databases for other MLB injuries. The use of publicly available data is inherently limited by the public nature of the information and generally limited to analysis from the MLB injured list (previously the MLB disabled list), which will not include all injuries or offseason injuries. 29,52 In addition, public analysis of injuries is unable to ascertain any possible differences in specific injury pattern, rehabilitation protocols, or operative techniques or variations, as well as the accuracy of the actual diagnosis. Inclan et al 29 reported in a review of the National Football League (NFL) for anterior cruciate ligament (ACL) injuries that studies relying on publicly obtained data only reported 66% of ACL injuries reported by the team medical staffs, with a bias of reporting injuries in more distinguished players.
In 2010, the MLB and MLB Players Association reached an agreement to create the HITS database. As stated by Pollack et al, 52 “the primary goal of the new system was to create a more efficient method to track medical histories of players longitudinally as they move across major and minor league affiliates. A second goal was to identify and monitor injury trends in the sport, identify areas of specific concern, and conduct epidemiologic research to better understand injuries and optimize player health and safety through possible rules changes, equipment modifications, or medical education.” Variables available for every injury entry include level of play, body region, side of injured body, injury mechanism and location of field of injury, International Classification of Diseases, 9th Revision, code, injury date and medical clearance date (allowing for calculation of time lost), need for surgery, whether injury happened in-game, and field surface. 52 The introduction of this EMR database of all professional baseball players affiliated with the MLB allows for a significantly increased accuracy and precision for research on performance after injury and is increasingly utilized in epidemiological analysis 2 –4,7,9 and performance after injury research. 15 –17,19,24,25,31 There are limitations, as the data rely on each organization entering detailed and correct information. While the HITS database can increase accuracy and precision for research, 29 it should also be noted that access to the HITS database is limited, which restricts the ability of interested groups to become involved in research.
Technological Advances in MLB Pitch Tracking
Recent advances in technology have provided additional means of evaluating pitching performance through in-game tracking systems. In 2006, MLB installed PITCHf(x) (Sportsvision) in all MLB stadiums, which provided the ability to track the velocity of all recorded pitches in MLB parks. 30 The advancement of technology utilized in MLB continued with the installation of Statcast (MLB Advanced Media) in all MLB stadiums in 2015. 61 This system comprises 12 Hawk-Eye cameras in each stadium, 5 of which are dedicated to pitch tracking, operating at 100 frames per second. 64 According to the MLB, Statcast provides the maximum speed of a pitch at any point in its flight, including the release point, while the previous PITCHf(x) recorded the velocity of each pitch when it was 50 feet from the back tip of home plate. 64 It should be noted that the change from the PITCHf(x) to the Statcast system inherently comes with this error in measurement. The amount of publicly available data that has resulted from these new systems has significantly increased since their installation.
Advanced Data
Before the 2007 regular season, MLB did not have a standardized velocity recording across all MLB stadiums, and performance analysis was limited to traditional rate statistics, such as ERA, WHIP, BB/9, K/9, and ERA+ (ERA adjusted to a player’s ballpark) (Table 1). However, the installation of the PITCHf(x) system allowed for the standardized collection of velocity, pitch selection by pitch type, and the horizontal and vertical movement of each pitch across different stadiums. With Statcast, the available advanced metrics further increased, with the addition of spin rate in particular gaining increasing interest in the baseball community; however, only a few studies have researched spin rate at this time. 27,42,43,47,48,67,68
Rate Statistics in MLB Pitching a
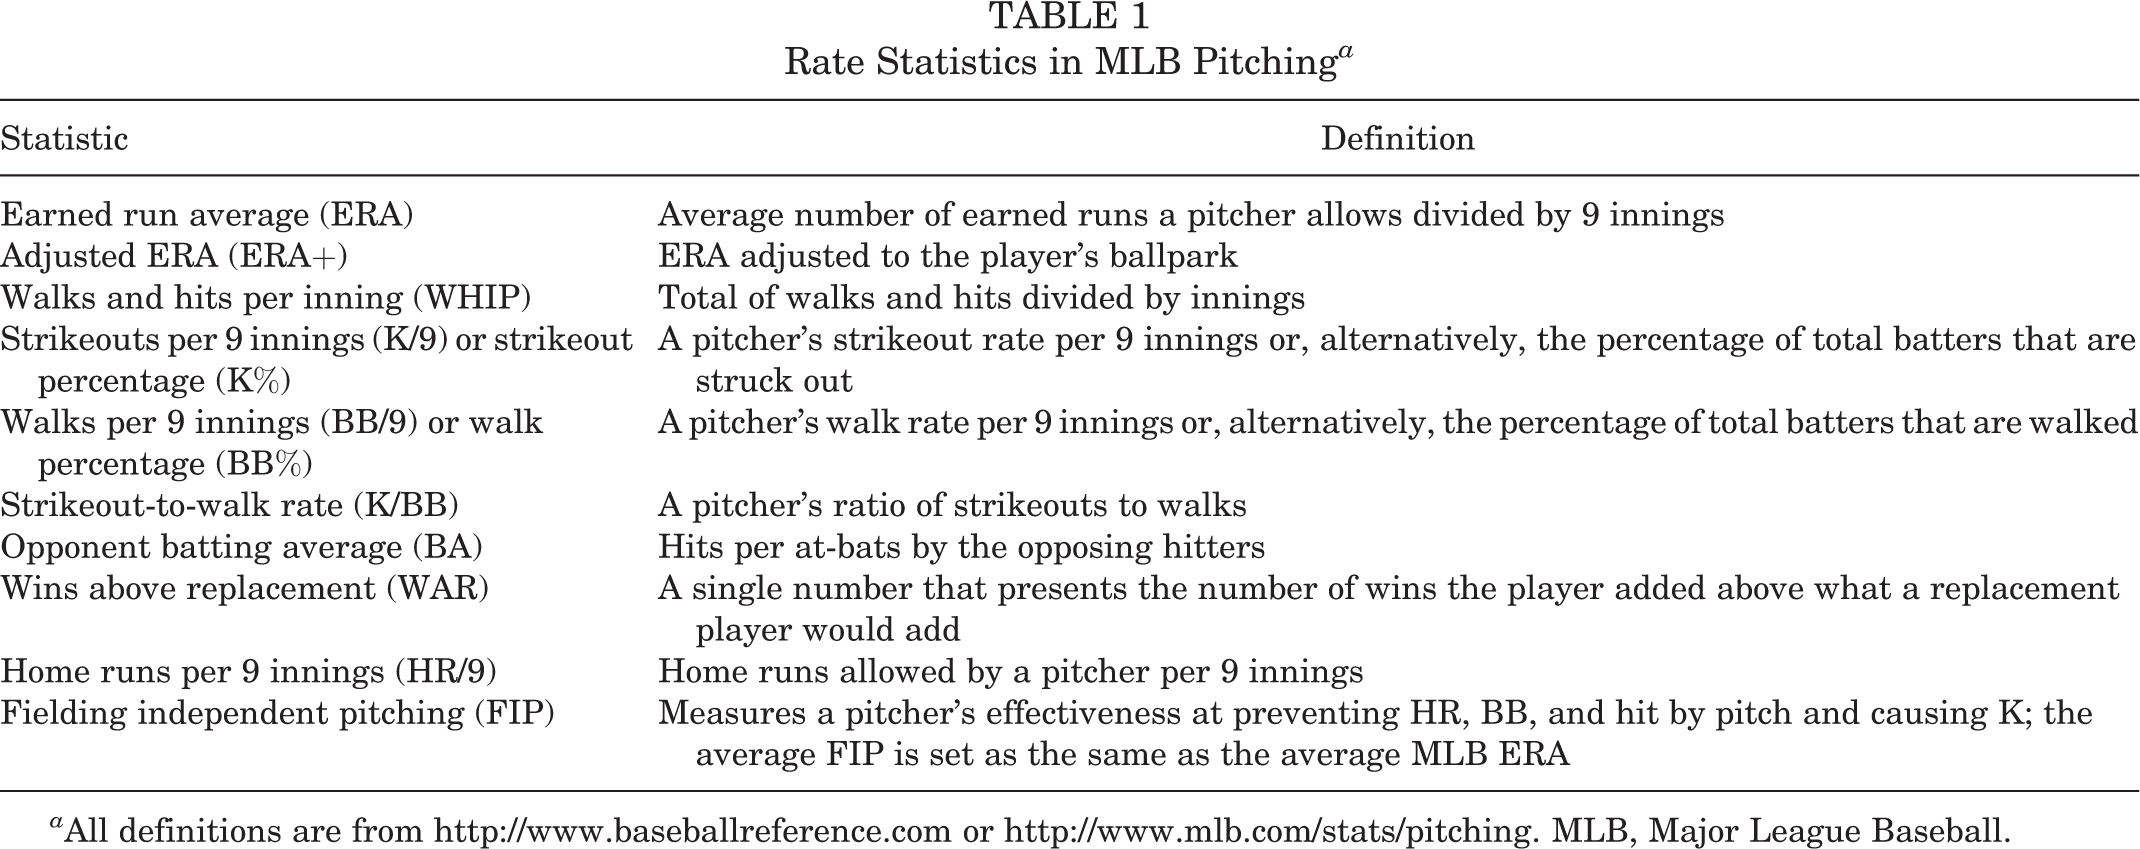
a All definitions are from http://www.baseballreference.com or http://www.mlb.com/stats/pitching. MLB, Major League Baseball.
Higuchi et al 27 demonstrated that increasing the spin rate on a fastball at the same velocity changed the expected trajectory of the ball and led to worsening performance in a group of skilled batters. In particular, for a fastball, increased spin rate leads to a fastball that drops less than a pitch at the same velocity with less spin; therefore, this is often described as a rising fastball or a fastball having more “life.” 27,43,47 Reports have shown that the average 4-seam fastball, which benefits from increased spin, has jumped considerably in MLB from an average of 2238 rpm in 2015 to 2317 rpm in 2021 per Statcast data. 49 Other pitches with similar benefits from increased spin, which leads to increased movement of the pitches, such as sliders, curveballs, and cutters, have also seen similar rises in mean spin rate in the same time period (sliders, 2106-2459 rpm; curveballs, 2303-2555 rpm; and cutters, 2206-2416 rpm). 49 Pitches intended to stay low in the zone and induce weak contact, such as 2-seam fastballs, changeups, and splitters, have not seen similar increases in spin rate. 49
We believe that these data show that teams and/or pitchers are pursuing increased spin rate on many of their pitches for performance benefits. This is further shown by many training organizations, including Cressley Sports Performance (http://cresseyperformance.com/baseball) and Driveline (http://www.drivelinebaseball.com), which place an emphasis on increasing pitch velocity and spin rate, likely as a response to batters focusing on launch angle and less on contact. It should be also noted that applying foreign substances to the baseball, including Spider Tack, a grip agent intended to increase spin rate, was outlawed in July 2021. 49 This may have an impact on spin rates before and after this time, as pitchers are now subject to suspension for their use. 49 To this point, we are aware of only 1 study that has evaluated spin rate in the context of an injury, 42 with no studies evaluating the effect of injury on spin rate after RTP.
In addition to spin rate, many other advanced measures are now available with the installation of Statcast and are further described in Table 2. These statistics are all publicly available online (http://baseballsavant.mlb.com). Such measures may also provide additional precision in evaluating pitching performance; however, in the current literature, they have not been studied in the context of injury. The vast majority of performance analysis after pitching injury to this point involves rate statistics and velocity recordings, and we believe the newly described advanced statistics warrant further investigation by evaluating the effect of performance before and after injury.
Advanced Pitching Statistics Collected by the MLB Statcast System a

a All definitions are from http://baseballsavant.mlb.com. ERA, earned run average; MLB, Major League Baseball.
Advanced Data in MLB Postinjury Performance Analysis
Multiple injuries have been studied in the context of pitching performance after injury. In this section, we review the findings by injury for studies that included advanced data in their analyses and describe the results in tables that include either rate statistics, advanced statistics, or both.
UCL Tears
To date, research on UCL injuries has encompassed the vast percentage of studies on performance after injury (Table 3). These injuries are most commonly treated with UCLR, commonly described as Tommy John Surgery, named after the first MLB pitcher who underwent this surgery by Dr. Frank Jobe. The majority of these studies have utilized public records for tracking UCL injuries in MLB pitchers, § while 3 evaluated all MLB pitchers who underwent surgery at a single institution. 12,39,40 Only 1 study to date has used the HITS database for performance analysis after UCLR. 25 Studies evaluating rate statistics in the setting of UCL injury after RTP are listed in Table 3.
Studies Evaluating Pitching Performance After Return to MLB Level for UCL Injuries a

a BB/9, walks per 9 innings; ERA, earned run average; FB, fastball; HR/9, home runs per 9 innings; K/9, strikeouts per 9 innings; K/BB, strikeout-to-walk rate; MLB, Major League Baseball; Nonop, nonoperative; NS, nonsignificant; Pitch %, pitch selection; UCL, ulnar collateral ligament; UCLR, ulnar collateral ligament reconstruction; WHIP, walks and hits per inning pitched.
b Rate statistics refer to statistics from Table 1. Advanced statistics refer to statistics from Table 2.
c Statistically significant findings.
d Nonoperative management of partial UCL tears.
In addition, studies have investigated the effect of a primary UCLR on velocity after RTP in MLB pitchers. Studies have reported contrasting results in comparison with pre-UCLR fastball velocity, with reports of both decreases in fastball velocity 10,30,36,38 and no difference in the 2 seasons after UCLR. 10,32,39,44,51,54 However, in comparison with uninjured controls, studies have not reported significant differences between pre-UCLR and post-UCLR fastball velocity at 1 and 2 years. 30,32,38,39,44,54 In comparison with controls, Marshall et al 39 found that pitchers with primary UCLR had significantly higher fastball velocity than a matched control group. In terms of fastballs, only Portney et al 54 and Platt et al 51 subdivided fastballs into 2-seam and 4-seam fastballs, which we believe is very important given the different action and intended use of each pitch (4-seam fastballs intended to have more velocity tended to cause more swings and misses vs 2-seam fastballs with the intention to initiate contact on the ground). Last, studies have also looked at the effect of UCLR on slider velocity and found no significant differences in velocity after UCLR. 30,51,54 Varying reports of significant differences in curveball and changeup velocity have been reported after UCLR 30,51,54 ; however, we are unsure of the clinical relevance of velocity changes for these pitches.
Furthermore, studies have also evaluated the effects of UCLR on pitch selection, in particular the use of fastballs before and after UCLR. These studies have demonstrated contrasting results with nonsignificant 54 and significant 36,38,39,50 differences in fastball usage after RTP. In a review of one institution, Marshall et al 40 reported no significant differences in fastball usage or fastball velocity between palmaris and gracilis UCLR grafts.
Studies have also begun to investigate the movement of pitches in the context of UCLR. Portney et al 54 reported decreased horizontal movement on 4-seam fastballs and sliders after RTP from UCLR and increased vertical movement on curveballs in comparison with the preinjury levels. In contrast, Platt et al 51 did not find a significant difference in vertical or horizontal movement for the 4-seam fastball, curveball, or slider in comparison with the preinjury levels. Similarly, McKnight et al 44 did not find any significant difference in curveball movement after UCLR. Last, the same study reported a significant decrease in fastball accuracy after UCLR, as measured by the difference between the target location of the catcher’s glove and resultant location of the pitch. 44
Revision UCL Tears
Similar to primary UCL tears, UCL graft tears are increasing in frequency in line with increased primary UCLRs. 3 All current studies on performance after revision UCLR have used public identification of eligible pitchers. 31,37,41 Studies evaluating rate statistics are listed in Table 3. Liu et al 37 also reported on fastball usage and fastball velocity and did not find any significant differences in a cohort of 12 pitchers, although it should be noted that the study period involved many pitchers before an installation of the standard velocity capturing system and did not differentiate on type of fastball.
All Other Injuries
Studies have evaluated multiple other injuries, including thoracic outlet syndrome, 26,62 SLAP or labral tears, 5,56,60 olecranon fractures, 15 rotator cuff tears, 18 latissimus or teres major tears, 17 ulnar neuropathy at the elbow, 19 forearm flexor tendon injuries, 28 FAI, 8,22,59 pars defects, 24 and cervical or lumbar disk herniations 57 (Table 4). The majority of these studies have focused on rate statistics, as shown in Table 4. Those including advanced data are discussed below.
Studies Evaluating Pitching Performance After Return to MLB Level for All Injuries Except UCL a
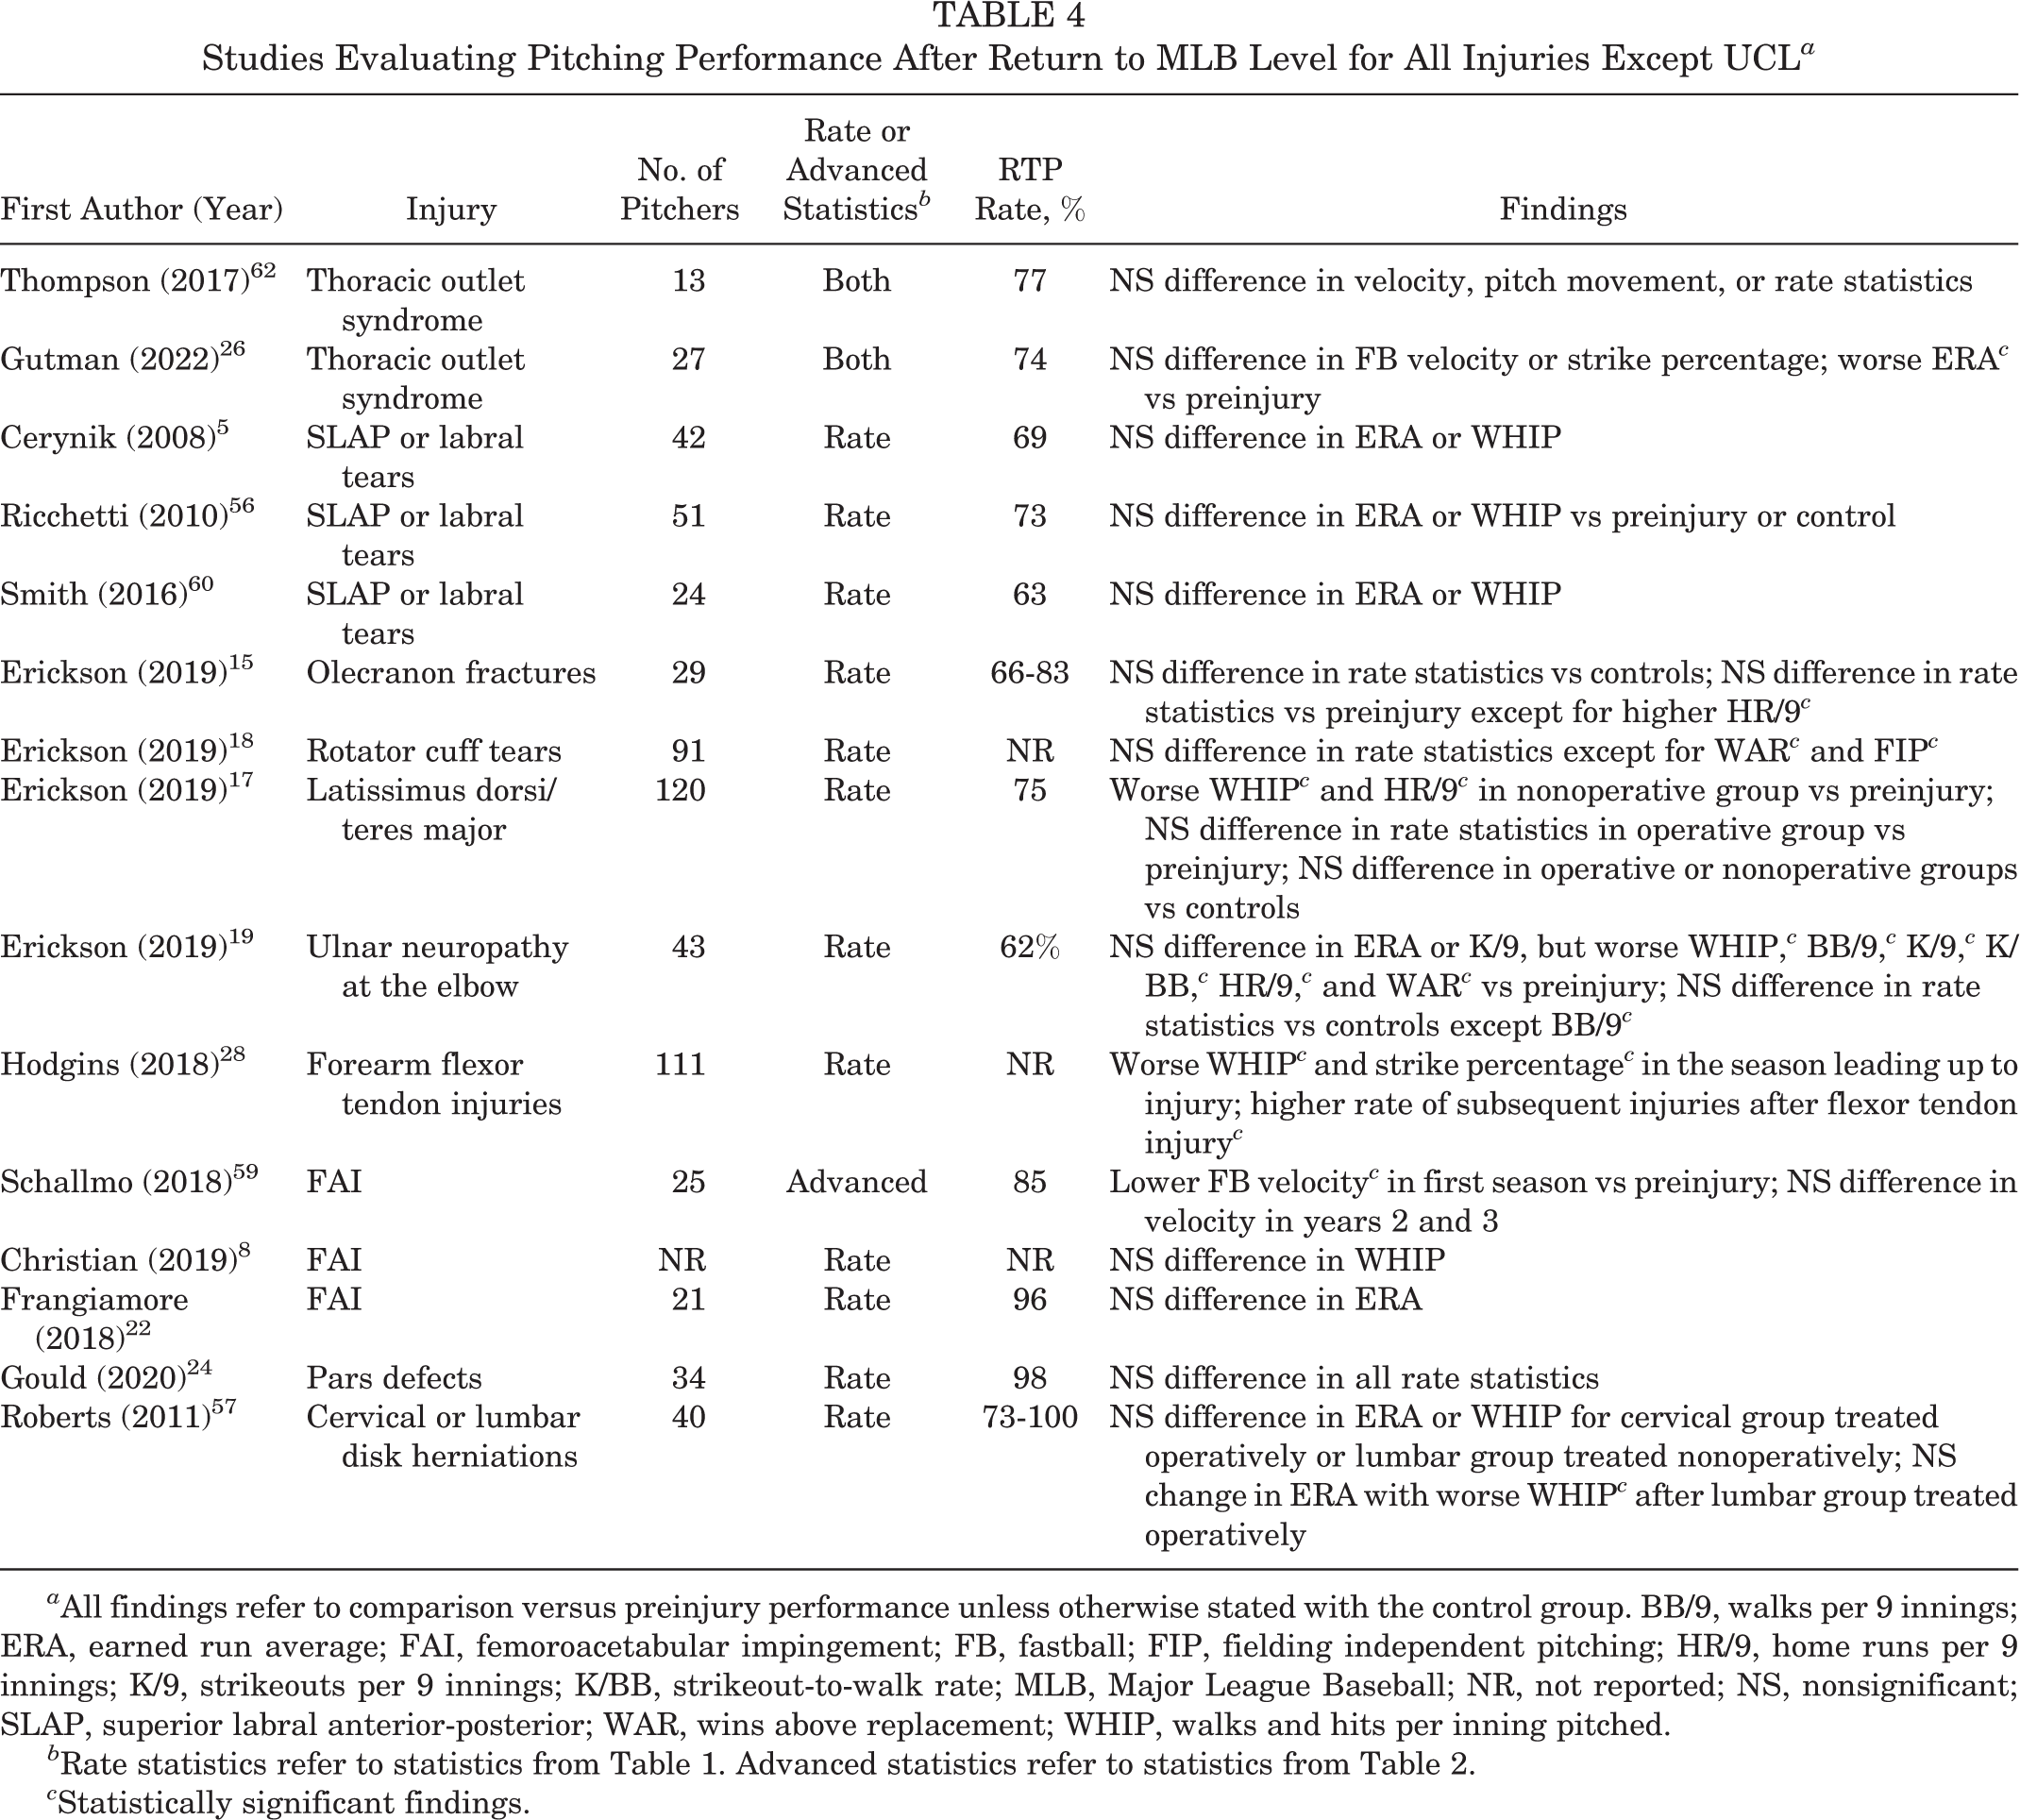
a All findings refer to comparison versus preinjury performance unless otherwise stated with the control group. BB/9, walks per 9 innings; ERA, earned run average; FAI, femoroacetabular impingement; FB, fastball; FIP, fielding independent pitching; HR/9, home runs per 9 innings; K/9, strikeouts per 9 innings; K/BB, strikeout-to-walk rate; MLB, Major League Baseball; NR, not reported; NS, nonsignificant; SLAP, superior labral anterior-posterior; WAR, wins above replacement; WHIP, walks and hits per inning pitched.
b Rate statistics refer to statistics from Table 1. Advanced statistics refer to statistics from Table 2.
c Statistically significant findings.
Thompson et al 62 reported on 13 MLB pitchers with neurogenic thoracic outlet syndrome found through examination of public records. They found no significant differences in overall fastball maximal or average velocity or the horizontal or vertical movement of the grouped breaking pitches. 62 Similarly, Gutman et al 26 reported no significant differences in fastball velocity. Schallmo et al 59 reported that MLB pitchers undergoing hip arthroscopy had a significantly lower 4-seam fastball velocity in their first postoperative season versus their index season, but there were no significant differences in the second and third seasons after return.
Evaluation of Risk Factors for Injuries
Studies have also evaluated risk factors for injury. These studies have focused on those proceeding to need primary or revision UCLR or in the setting of forearm flexor tendon injuries. While the studies below have evaluated risk factors for injuries, to this point, we are unaware of any studies that have evaluated the prevention of injuries by prospectively analyzing risk factors.
There have also been studies investigating risk factors for primary UCLR 6,11,32,53,55,66 (Table 5). Whiteside et al 66 performed a binary logistic regression analysis and found multiple predictors of UCLR, including fewer days between games, smaller repertoire of pitches, a less pronounced horizontal release location, smaller stature, greater mean pitch speed, and greater mean pitch counts per game. Chalmers et al 6 reported that on multivariate regression, peak pitch velocity was the strongest predictor of subsequent UCLR; in addition, higher body mass index and younger age were also predictors of injury. DeFroda et al 11 also found similar results with higher fastball velocity in the group undergoing UCLR versus controls. Prodromo et al 55 reported that for every 1-mph increase, the odds of UCL injury increased by 15%, while Keller et al 32 reported a 2% increase in UCLR risk with every 1% increase in fastball usage. Portney et al 53 reported that, in comparison with a control group of pitchers who did not undergo UCLR, those proceeding to UCLR threw significantly more curveballs (62.9% vs 59.2%) and had a significantly more lateral pitch release point in the final 2 seasons before UCLR as well as a lower vertical release point in the season before UCLR. 53 Of note, for the lateral release point, there was also a significant difference with a more lateral location of the release point in the season immediately before injury in comparison with the third year before UCLR, which may indicate altered pitch mechanics causing increased valgus stress at the elbow before UCL injury. 53 Last, a study by Mayo et al 42 attempted to identify any potential changes in velocity, spin rate, or pitch selection in the final 15 games before injury in 223 MLB pitchers who underwent UCLR. They reported that pitchers who went on to have UCLR demonstrated increased use of curveballs; had a statistically significant decrease in 4-seam fastball, 2-seam fastball, and slider velocity; and had a significant decrease in 4-seam fastball spin rate in the 15 games before injury. 42 Those authors surmised that subclinical injury at the UCL may have led to altered pitching biomechanics that ultimately led to these changes in velocity and spin rate. 42 In agreement with a recent scoping review by Mercier et al, 46 we believe that this is the only current study evaluating spin rate in the context of injury or performance.
Studies Evaluating Preinjury Risk Factors for UCL Injury in MLB Pitchers Who Underwent UCL Reconstruction a

a 2FB, 2-seam fastball; 4FB, 4-seam fastball; %, pitch percentage; BMI, body mass index; FB, fastball; FIP, fielding independent pitching; MLB, Major League Baseball; UCL, ulnar collateral ligament.
Hodgins et al 28 reported on 763 forearm flexor injuries in MLB and minor league players as identified by the HITS database and found that 52% of MLB players and 31% of minor league players had a shoulder or elbow injury in the previous 3 years before the flexor tendon injury. After a flexor tendon injury, they reported a significantly higher rate of shoulder, elbow, and forearm injuries in both MLB and minor league players versus a group of controls. Last, players undergoing UCLR were found to have a significantly higher rate of previous forearm flexor injury. 28
Studies have also attempted to predict UCLR graft injury. 13,20,33,34 Erickson et al 20 evaluated a group of 154 MLB pitchers who underwent primary UCLR with RTP to the MLB level and did not find any significant differences in innings pitched or pitches thrown, either in the immediate season after UCLR or in the subsequent career, between those requiring revision UCLRs and those not requiring intervention. Conversely, Keller et al 33 reported significantly lower innings pitched (with no significant differences in total pitches) after RTP in a group of pitchers who did not require revision UCLR in comparison with those requiring revision UCLR over the 3 seasons after RTP. Other studies have also reported no difference in revision rate based on time taken to RTP after UCLR 13 as well as a higher revision UCLR rate in younger pitchers and those with less MLB experience. 34
Future Advances
We believe that the ability to analyze pitching performance has significantly improved in recent years. The MLB HITS private database allows for a comprehensive evaluation of performance with a level of precision and accuracy that is often not seen in professional athletics. 29,52 The ability to compare different treatments, surgical techniques, or injury characteristics that would be not available in the public domain allows for a much more meticulous look into performance, and we recommend the use of this database, when possible, for evaluation of pre- and postinjury performance.
In addition, the implementation of publicly available in-game performance tracking systems, beginning with the PITCHf(x) system and now the Statcast system, has allowed for individualized evaluation of pitching performance on a more sophisticated level. Traditional rate statistics, such as ERA, WHIP, K/9, or BB/9, allow for a general sense of performance but are inherently limited by small sample sizes or variability because of factors outside of the pitcher’s control. Adjusted rate statistics, such as ERA+, have not been commonly used to date in the literature for performance analysis, but they can also be helpful in eliminating some of the confounding factors in professional baseball. The addition of newly available advanced data, for example, velocity, spin rate, pitch selection, and pitch movement (see Table 2), allows for a deeper and more focused investigation into the origin of any performance changes. These advanced metrics also are much more individualized to a pitcher and would likely be more effective in identifying subtle but important changes that may be due to altered pitching mechanics or other factors. We believe that these metrics should be further investigated in the context of injury and performance.
Finally, we recommend further studies to analyze risk factors or early identification of injury using advanced data. There are currently only a few studies looking at risk factors for injury, primarily in the context of primary or revision UCLR; however, the majority of these risk factors are not realistically modifiable. For example, while higher velocity has been found to be associated with increased risk of UCLR, pitchers will continue to strive for increased velocity for performance reasons.
Early identification of injuries using advanced statistics, such as in-game or game-by-game velocity or spin rate changes, may help to identify and potentially avoid impending injuries. Given the large financial impact in MLB associated with injuries such as UCL or rotator cuff tears, there may be a way to use these advanced measures to identify signs of overuse, altered mechanics, or arm fatigue that may predispose to injury. We believe that there is enormous potential for research in this area of performance.
Footnotes
Final revision submitted February 21, 2022; accepted May 12, 2022.
One or more of the authors has declared the following potential conflict of interest or source of funding: C.M.L. has received education payments from Evolution Surgical. M.E.C. has received education payments from Evolution Surgical. M.R.S. has received consulting fees from Anika Therapeutics, Medacta, and Smith & Nephew; royalties and nonconsulting fees from Smith & Nephew; and honoraria from Medacta. M.T.F. has received grant support from Encore Medical, education payments from Evolution Surgical, consulting fees from Smith & Nephew and Stryker, speaking fees from Integra LifeSciences and Smith & Nephew, and hospitality payments from Wright Medical. C.A.W. has received hospitality payments from Arthrex and Smith & Nephew. R.F.L. has received consulting fees from Arthrex and Smith & Nephew, speaking fees from Smith & Nephew, and royalties from Arthrex and Smith & Nephew. AOSSM checks author disclosures against the Open Payments Database (OPD). AOSSM has not conducted an independent investigation on the OPD and disclaims any liability or responsibility relating thereto.