
Abstract
Background:
Anterior femoroacetabular impingement (FAI) is associated with labral tears and acetabular cartilage damage in athletic and young patients. Delayed gadolinium-enhanced magnetic resonance imaging of cartilage (dGEMRIC) is an imaging method for detecting early damage to cartilage.
Purpose:
We evaluated the following questions: (1) What is the sensitivity and specificity of morphological magnetic resonance imaging (MRI) and dGEMRIC for detecting cartilage damage? Do the mean acetabular and femoral dGEMRIC indices differ between (2) superior acetabular clock positions with and without impingement and (3) between cam- and pincer-type FAI?
Study Design:
Cohort study (diagnosis); Level of evidence, 2.
Methods:
This was a retrospective comparative study of 21 hips (20 patients with symptomatic anterior FAI) without osteoarthritis on anteroposterior radiographs. Morphological MRI and dGEMRIC (3.0-T, 3-dimensional [3D] T1 maps, dual–flip angle technique) of the same hip joint were compared. Intraoperative acetabular cartilage damage was assessed in patients who underwent surgical treatment. Computed tomography (CT)–based 3D bone models of the same hip joint were used as the gold standard for the detection of impingement, and dGEMRIC indices and zones of morphologic damage were compared with the CT-based impingement zones.
Results:
Of the 21 hips, 10 had cam-type FAI and 8 had pincer-type FAI according to radiographs. The mean age was 30 ± 9 years (range, 17-48 years), 71% were female, and surgical treatment was performed in 52%. We found a significantly higher sensitivity (69%) for dGEMRIC compared with morphological MRI (42%) in the detection of cartilage damage (P < .001). The specificity of dGEMRIC was 83% and accuracy was 78%. The mean peripheral acetabular and femoral dGEMRIC indices for clock positions with impingement (485 ± 141 and 440 ± 121 ms) were significantly lower compared with clock positions without impingement (596 ± 183 and 534 ± 129 ms) (P < .001). Hips with cam-type FAI had significantly lower acetabular dGEMRIC indices compared with hips with pincer-type FAI on the anterosuperior clock positions (1 to 3 o’clock) (P = .018).
Conclusion:
MRI with dGEMRIC was more sensitive than morphological MRI, and lower dGEMRIC values were found for clock positions with impingement as detected on 3D-CT. This could aid in patient-specific diagnosis of FAI, preoperative patient selection, and surgical decision making to identify patients with cartilage damage who are at risk for inferior outcomes after hip arthroscopy.
Keywords
Femoroacetabular impingement (FAI) syndrome 11 is an osseous conflict of the femur and the acetabulum, which can lead to early development of osteoarthritis of the hip. FAI is associated with acetabular labral tears and acetabular cartilage damage 2,52,54 in the anterosuperior region in young and sportive patients (aged 20-40 years). The description of this concept has led to an increasing number of joint-preserving procedures of the hip. 17 Surgical therapy, and especially hip arthroscopy, has increased tremendously in the United States. 32,55 Treatment can be performed arthroscopically or open to reduce hip pain and improve range of motion (ROM) and function. Surgical decision making for FAI should involve multimodal imaging assessment of the osseous morphology and the associated lesions 51 of the cartilage and labrum. The analysis of the underlying morphology and the assessment of cartilage damage has direct consequences for patient selection and long-term outcomes. 12 Cartilage damage is a risk factor for inferior 10-year outcomes after open treatment for FAI. 12
Previous studies have shown that conventional magnetic resonance imaging (MRI) techniques are limited and can detect macroscopic chondral damage. 4,41,51,59 The ability to identify and quantify the extent of cartilage damage with more sensitive tools will aid in selecting those patients who would benefit most from surgery. 51 To identify early cartilage damage, several advanced MRI-based techniques have been described for quantitative cartilage mapping. As an example, delayed gadolinium-enhanced MRI of cartilage (dGEMRIC) has recently been used in the hip. 51 This technique allows an objective quantification of early biochemical cartilage damage, even in the absence of full-thickness cartilage defects; a higher dGEMRIC index represents more glycosaminoglycan (GAG) content and indicates healthier cartilage. 51
Although treatment of FAI is increasingly performed, identification of the patients that benefit most from hip arthroscopy remains challenging. Potentially, dGEMRIC could help to identify cartilage injuries preoperatively. Previously, dGEMRIC was used as a prognostic tool to predict early failure after periacetabular osteotomy (PAO) for the treatment of hip dysplasia. 7,18 So far, only few studies used dGEMRIC for cartilage analysis to predict clinical outcome after FAI surgery. 6,14,51 Additionally, it is unclear if cartilage damage occurs at the exact zone of hip impingement. No study to date has investigated the relationship between early acetabular cartilage damage based on quantitative dGEMRIC analysis and impingement zone location based on three-dimensional computed tomography (3D-CT) of the same hip joint. 60
According to a recent systematic review, CT arthrography and CT-based 3D and 4-dimensional methods 10 represent the gold standard 46 for the diagnosis of osseous hip deformities. 8,20,30,36,63 CT-based 3D dynamic impingement detection is a validated technique employed to determine the exact location of osseous impingement between the femoral head and acetabulum with high accuracy. 60,63 It is based on ROM analysis and collision detection software using CT-based 3D models. 63 The introduction of the equidistant method enables the calculation of a dynamic hip joint center. 43
We evaluated the following study questions: (1) What is the sensitivity and specificity of morphologic MRI and MRI with dGEMRIC for the detection of cartilage damage? Do the mean acetabular and femoral dGEMRIC indices differ between (2) superior acetabular clock positions with and without impingement and (3) between cam and pincer FAI?
Methods
We performed a retrospective, institutional review board–approved, comparative radiological study of 21 hips in 20 patients with symptomatic anterior FAI without osteoarthritis based on anteroposterior (AP) radiographs. Routine radiographic evaluation generally consisted of an AP pelvic radiograph taken with a standardized technique 65 and a cross-table lateral radiograph of the hip. All radiographic measurements were performed by 2 independent, blinded observers (T.D.L. and F.S.). CT scans of the pelvis and distal femoral condyles and magnetic resonance arthrography with dGEMRIC of the same hip joint were compared. The mean patient age was 30 ± 9 years (range, 17-48 years), and 15 patients (71%) were female. Overall, 11 patients (52%) underwent surgical treatment for the correction of anterior FAI. Intraoperative acetabular cartilage damage was assessed in patients who underwent surgical treatment.
Patient Selection and Description
The inclusion criterion for this study was the availability of both CT and MRI with dGEMRIC of the same hip joint. The 21 hips in the current study were part of 116 hips in 105 patients included in a prospective, comparative, nonrandomized, longitudinal study 51 that compared the dGEMRIC index of patients with FAI undergoing surgery with those treated nonoperatively. The following inclusion criteria were used: the presence of hip pain; radiographic signs of skeletal maturity; AP radiographs; and the availability of both CT and MRI with dGEMRIC of the same hip joint. This resulted in 32 hips in 31 patients that matched the inclusion criteria. We excluded 11 hips for the following reasons: 4 hips without FAI; 3 hips because of previous hip surgery; 3 hips with post-Perthes deformity or slipped capital femoral epiphysis 29 ; and 1 hip with Tönnis grade 3 osteoarthritis 51 on conventional radiographs.
The remaining 21 hips underwent a preoperative CT scan and MRI scan with dGEMRIC of the same hip joint for diagnosis of anterior FAI and evaluation for hip preservation surgery between April 2013 and November 2016. All patients had hip pain at the time when the images were acquired. The time between preoperative CT and MRI was a maximum of 1 month.
Of the 21 hips, 10 hips had cam-type FAI, 8 hips had pincer-type FAI, and 3 hips had mixed-type FAI. The diagnosis of cam- and pincer-type FAI was based on previously described reference values. 62 The patients with cam-type FAI did not differ from those with pincer-type FAI in terms of demographic characteristics (Table 1).
Demographic and Radiological Data of the Study Groups a
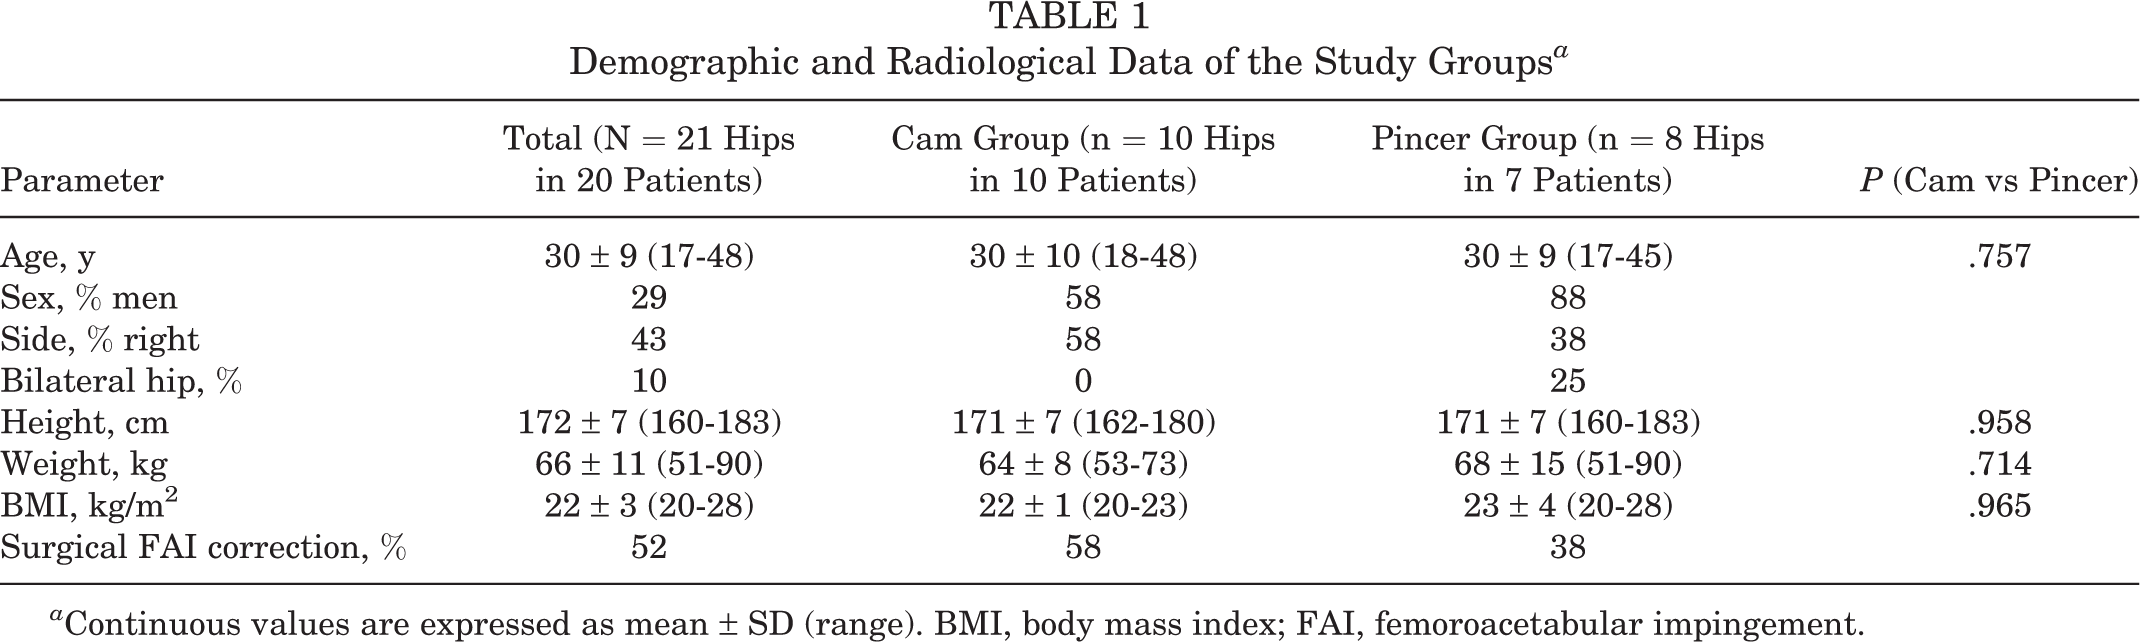
a Continuous values are expressed as mean ± SD (range). BMI, body mass index; FAI, femoroacetabular impingement.
As part of the routine workup, all patients were evaluated in the outpatient clinic by one of our attending hip surgeons (M.T. or K.A.S.) with expertise in hip preservation surgery. The clinical evaluation included acquisition of the patient’s history, a goniometric measurement of hip ROM, the evaluation of the anterior and posterior impingement tests, 65 and general joint laxity. 38 The posterior impingement test was performed in hip extension and was used to test for anterior hip instability. 65
Radiographic Measurements
Measurement of femoral version was performed according to the method described by Murphy et al 37 on preoperative CT scans of the pelvis and the knee. Acetabular version was calculated on the level of the femoral head center 68 on axial CT images, and the McKibbin index 33 was calculated by addition of femoral version and acetabular version. Cam-type morphology was defined as an alpha angle 39 >55°, 27 measured on the radial MRI slices in the presence of a normal acetabulum 62 (lateral center-edge angle [LCEA], 23°-33°). Pincer-type morphology was defined as an LCEA >34° 62 and an alpha angle <55°, and mixed-type morphology was defined as an LCEA >34° and an alpha angle >55°. All patients underwent preoperative pelvic CT scans including the knee joint for landmarks of the distal femoral condyles 42,43 according to a previously described protocol. 57
Significant differences between the patients with cam- versus pincer-type FAI were seen in terms of LCEA, alpha angle, acetabular index, extrusion index, retroversion index and acetabular version (Table 2).
Radiographic Parameters by FAI Type a

a Continuous values are expressed as mean ± SD (range). Bolded P values indicate statistically significant difference between groups (P < .05). FAI, femoroacetabular impingement; LCEA, lateral center-edge angle.
CT-Based 3D Models
CT-based 3D models of the hip joint were generated with semiautomatic segmentation software using the Amira Visualization Toolkit (Visage Imaging Inc), as previously described. 24,25 These 3D surface bone models of the pelvis and the femur were transferred to a previously described and validated collision detection software program (HipMotion) 24,25 (Figure 1) to compute ROM and the individual impingement zones. This impingement simulation served as the gold standard for the detection of impingement zones on the clockface system (Figure 2 and Table 3). 43,63

(A) T1 dGEMRIC map of a 32-year-old woman with symptomatic cam femoroacetabular impingement is shown with lower T1 indices from 1 to 3 o’clock (orange). Red and orange colors indicate low T1 index (cartilage damage), and blue indicates high T1 index (intact cartilage). (B) Bony impingement simulation using CT-based 3D models of the same patient, with the red line indicating impingement zones from 1 to 3 o’clock. The 3 o’clock position represents anterior and 9 o’clock indicates posterior. (C) Intraoperative image of the acetabulum during surgical hip dislocation of the same patient. The white arrows show cartilage damage. (Figure 1C from Schmaranzer et al. 51 Reprinted with permission from Wolters Kluwer Health.)

Mean dGEMRIC index (ms) and osseous impingement zone (%) based on CT-based collision detection software for each (A) acetabular and (B) femoral clock position (9 to 3 o’clock) for all hips. *Statistically significant difference between clock positions.
Range of Motion Calculations According to the Collision Detection Software Using CT-Based 3D Models a

a Continuous values are expressed as mean ± SD (range). Bolded P values indicate statistically significant difference between groups (P < .05). ER, external rotation; IR, internal rotation.
The acetabular reference coordinate system was defined using the anterior pelvic plane. This plane was reconstructed using the following 4 pelvic landmarks: both anterosuperior iliac spines and the pubic tubercles. 57,63,64 The femoral reference coordinate system was defined using the following 4 femoral landmarks: the center of the femoral head, the knee center, and both femoral condyles. 37
Collision Detection Software
The HipMotion collision detection software uses automatic rim detection, 42 a best-fitting sphere algorithm to identify the femoral head center, 31 and the specifically designed “equidistant method” for motion analysis. 43
Using this method, we calculated the ROM (Table 3) for the following motions for all hips: flexion, extension, internal rotation, and external rotation (at 0° and 90° of flexion). For this software, intra- and interobserver reliability for the mentioned ROM parameters were good for all motions 35 using intraclass correlation coefficients. 63 Furthermore, we evaluated a motion pattern, which corresponded to the anterior impingement test 65 (flexion adduction–internal rotation test 44,45 ).
Definition of Impingement Zones
The definition of the impingement zones was based on the clockface system, 57,61 with 6 o’clock representing the acetabular notch. Three o’clock was defined anteriorly for both right and left hips. This system was identical to the system used for evaluation of the dGEMRIC index (Figure 1). Intra-articular impingement required the involvement of the acetabular rim and the lunate surface on the acetabular side and the femoral head and neck on the femoral side. For simulation of the anterior impingement test, 65 internal rotation was calculated in 1° steps between 90° and 120° of flexion.
Intraoperative Findings
Eleven patients (52%) underwent surgical treatment for correction of FAI. Both open surgical hip dislocation and hip arthroscopy (10 hips; 48%) techniques were performed for correction of cam- or pincer-type FAI (Table 1). Intraoperative acetabular cartilage damage was assessed using intraoperative images of the patients who underwent surgical treatment for correction of FAI. Five hips had cartilage flaps anterosuperiorly, which were evaluated and documented with a surgical probe (Figure 1C).
Magnetic Resonance Protocol
Indirect magnetic resonance arthrography (0.2 mmol/kg; Gd-DTPA2–) for dGEMRIC (3D T1 maps; dual–flip angle technique) was performed for all patients according to the standardized protocol reported previously. 51 All MRI examinations were performed on a single 3.0-T scanner (Trio; Siemens) with a flexible surface coil. The use of dGEMRIC involves intravenous injection of an MRI hydrophilic contrast agent, 15,16 - GdDTPA2–. All patients were asked to walk around for 15 minutes after the contrast injection, and then they had to wait for an additional 5 to 30 minutes to enable adequate penetration of the contrast into the cartilage. In addition we obtained a 2-dimensional (2D) radial proton density–weighted sequence (repetition time [TR]/echo time [TE], 1500/18 ms; slice thickness, 4 mm; field of view, 160 × 160 mm; matrix size, 448 × 317; acquisition time of 4:30 minutes for 14 slices) with orientation along the axis of the femoral neck. 19 Approximately 45 to 70 minutes after intravenous contrast injection, the multiplanar protocol (acquisition time of 20 minutes) for acquisition of the T1 map for dGEMRIC measurements began. A dual–flip angle 3D gradient-echo technique was used. The following MRI specifications were used: slice thickness, 0.78 mm; flip angles of 4° and 24°; TR/TE, 15/3.3 ms; field of view, 160 × 160 mm; matrix size, 192 × 192; isotropic voxel size, 0.78 mm3; acquisition time of 9 minutes for 128 slices. 51
Postprocessing of MR Images with dGEMRIC
For reformation of 12 radial slices 19 from the 3D data set, a commercially available software, Osirix (Version 6.0 49 ), was used. Radial slices were used for the manual measurement of dGEMRIC indices 51 by 1 author (F.S.) who was blinded to the CT and intraoperative findings. Radial T1 images were reformatted for region of interest placements, which were placed at the peripheral acetabular cartilage at each clock position of the superior circumference 51 (9 to 3 o’clock). This approach reportedly enables an analysis of dGEMRIC indices 51 with good reliability and reproducibility. For direct comparison between morphological and dGEMRIC sequences, the dGEMRIC sequences were reoriented identically to the morphologic 2D radial proton density–weighted images. Femoral and acetabular cartilage layers were evaluated separately for calculation of the dGEMRIC index. Acetabular dGEMRIC indices were measured on the 7 clock positions of the superior circumference (9 to 3 o’clock). 51 Femoral dGEMRIC indices were measured on the concordant 7 clock positions. The anatomic landmark for the acetabular 6 o’clock position was the acetabular teardrop. For definition of the femoral 12 o’clock position, 19 the most prominent appearance of the greater trochanter was utilized.
The 2 margins for the acetabular cartilage were used—the acetabular fossa medially (central) and the acetabular rim laterally (peripheral)—whereas for the femoral cartilage, the margins were the fovea capitis femoris medially and the head-neck junction laterally. The T1 relaxation (dGEMRIC index) in the aforementioned region of interest was calculated by the software Osirix. Cartilage damage was calculated as the difference between the individual peripheral acetabular dGEMRIC index and the dGEMRIC index of the individual femoral central 12 o’clock position (healthy reference cartilage). 22,23 The differences for the 7 acetabular clock positions on the superior circumference (9 to 3 o’clock) were calculated. If this difference was higher than the standard deviation of the 3 femoral central clock positions (10 to 12 o’clock) of the same patient, this was defined as cartilage damage.
Statistical Analysis
To answer the first study question, the sensitivity, specificity, and accuracy of dGEMRIC and morphologic MRI to detect cartilage damage were compared using the McNemar test. As a reference standard, collision detection using CT-based 3D models was used to define cartilage damage, because we expected cartilage damage at the location of impingement. We tested the data for normal distribution with the Kolmogorov-Smirnov test. After confirming normal distribution, mean acetabular dGEMRIC index was compared on the 7 superior acetabular clock positions (9 to 3 o’clock) using analysis of variance with Bonferroni correction, followed by dependent t tests. Clock positions with impingement were defined using CT-based 3D collision detection software. The 7 clock positions for 21 patients resulted in a total of 147 clock positions. To answer the second study question, we compared the acetabular dGEMRIC index of the 52 acetabular clock positions with impingement to the 95 clock positions without impingement, for a total of 147 clock positions. We also compared the femoral dGEMRIC index of the 48 femoral clock positions with impingement with the 99 clock positions without impingement. To compare the 5 hips with cartilage flaps, the Kruskal-Wallis test and the Wilcoxon test were used because the data were not normally distributed.
The acetabular and femoral distribution of the dGEMRIC indices were interpolated and illustrated using surface color plots using MATLAB (The MathWorks) by 1 blinded observer (E.F.L.) not involved in patient care and not involved in measurements of the dGEMRIC indices. Blue was used to indicate high dGEMRIC index (representing high GAG content), while red was used for low dGEMRIC index (indicating low GAG content) (Figure 1).
Results
Study Question 1
We found a significantly (P < .001) higher sensitivity (69%) for MRI with dGEMRIC compared with morphological MRI (42%) for the detection of cartilage damage (Table 4). In addition, we found a specificity of 83% for dGEMRIC and an accuracy of 78% (115/147 clock positions) of concordant clock positions between cartilage damage and osseous impingement zones (Table 4A). However, we found a similar accuracy and positive predictive value (PPV) between MRI with dGEMRIC and morphological MRI (Table 4). Acetabular impingement was predominantly located at 2 o’clock using CT-based 3D models (Figure 2A).
2×2 Tables Comparing the Diagnostic Performance of (A) dGEMRIC and (B) Morphological MRI to Detect Acetabular Cartilage Damage a
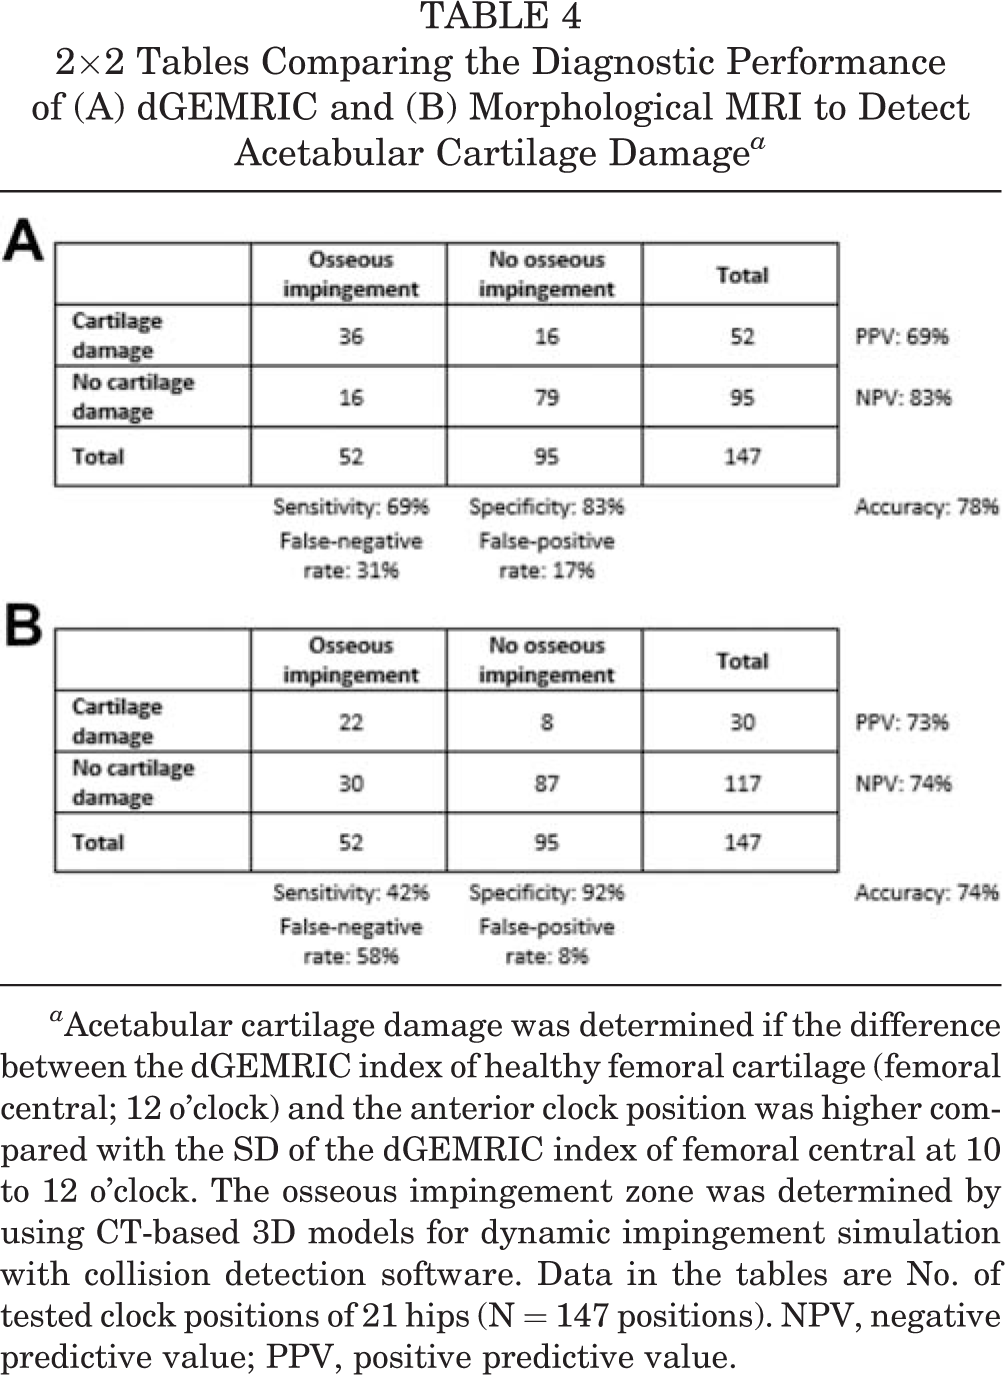

a Acetabular cartilage damage was determined if the difference between the dGEMRIC index of healthy femoral cartilage (femoral central; 12 o’clock) and the anterior clock position was higher compared with the SD of the dGEMRIC index of femoral central at 10 to 12 o’clock. The osseous impingement zone was determined by using CT-based 3D models for dynamic impingement simulation with collision detection software. Data in the tables are No. of tested clock positions of 21 hips (N = 147 positions). NPV, negative predictive value; PPV, positive predictive value.
Study Question 2
The mean peripheral superior acetabular dGEMRIC index for acetabular clock positions with impingement was significantly (P < .001) lower (485 ± 141 ms) (Appendix Table A1) compared with clock positions without impingement (596 ± 183 ms) (Figure 3A).

Mean dGEMRIC indices for (A) acetabular and (B) femoral clock positions with and without osseous impingement. Subgroup analysis of hips with cam and pincer was performed. *Statistically significant difference between clock positions.
We found a significantly (P < .001) lower acetabular dGEMRIC index for acetabular clock positions with impingement compared with acetabular clock positions without impingement for hips with cam-type FAI (423 ± 100 vs 557 ± 149 ms) and for hips with pincer-type FAI (544 ± 171 vs 672 ± 216 ms) (Appendix Table A1).
The mean peripheral superior femoral dGEMRIC index for clock positions with impingement were significantly (P < .001) lower (440 ± 121 ms) (Appendix Table A2) compared with hips without impingement (534 ± 129 ms) (Figure 3B).
The mean acetabular dGEMRIC index was significantly lower at 2 o’clock (472 ± 140 ms; P < .001) (Appendix Table A1) and 3 o’clock (474 ± 133 ms; P < .001) compared with 11 o’clock (650 ± 180 ms) (Figure 2A). Mean femoral dGEMRIC was significantly (P < .001) lower at 3 o’clock compared with 10, 11, and 12 o’clock (Appendix Table A2, Figure 2B). The lowest mean acetabular dGEMRIC index (472 ± 140 ms) (Appendix Table A1) was located at the zone of maximal anterior acetabular impingement (2 o’clock) (Figure 2A). The lowest mean femoral dGEMRIC index (403 ± 116 ms) (Appendix Table A2) was located at the zone of maximal anterior femoral impingement (3 o’clock) (Figure 2B). The 5 hips with intraoperative cartilage flaps anterosuperiorly had a mean acetabular dGEMRIC index of 407 ± 118 ms at 1 o’clock, of 396 ± 123 ms at 2 o’clock, and of 376 ± 120 ms at 3 o’clock. The mean acetabular dGEMRIC indices of the 5 hips at 1 to 3 o’clock were significantly lower (P = .001) compared with 11 o’clock (650 ± 180 ms) of all 21 hips. The mean acetabular dGEMRIC index of the 5 hips was significantly lower (P = .043) at 3 o’clock (376 ± 120 ms) compared with 11 o’clock (562 ± 181 ms) of the 5 hips. The 5 hips with intraoperative cartilage flaps anterosuperiorly had a lower mean acetabular dGEMRIC index compared with the remaining 6 hips without intraoperative cartilage flaps (407 vs 473 ms at 1 o’clock, 396 vs 484 ms at 2 o’clock, and 376 vs 501 ms at 3 o’clock).
Study Question 3
When stratifying by type of impingement, hips with cam-type FAI had significantly lower (P = .018) (Appendix Table A1) acetabular dGEMRIC indices compared with hips with pincer-type FAI on anterosuperior clock positions (1 to 3 o’clock) (Figure 4). Both cam and pincer types had significantly lower (P < .001) acetabular dGEMRIC indices on clock positions with impingement (423 ± 100 and 544 ± 171 ms) compared with clock positions without impingement (557 ± 149 and 672 ± 216 ms) (Appendix Table A1).
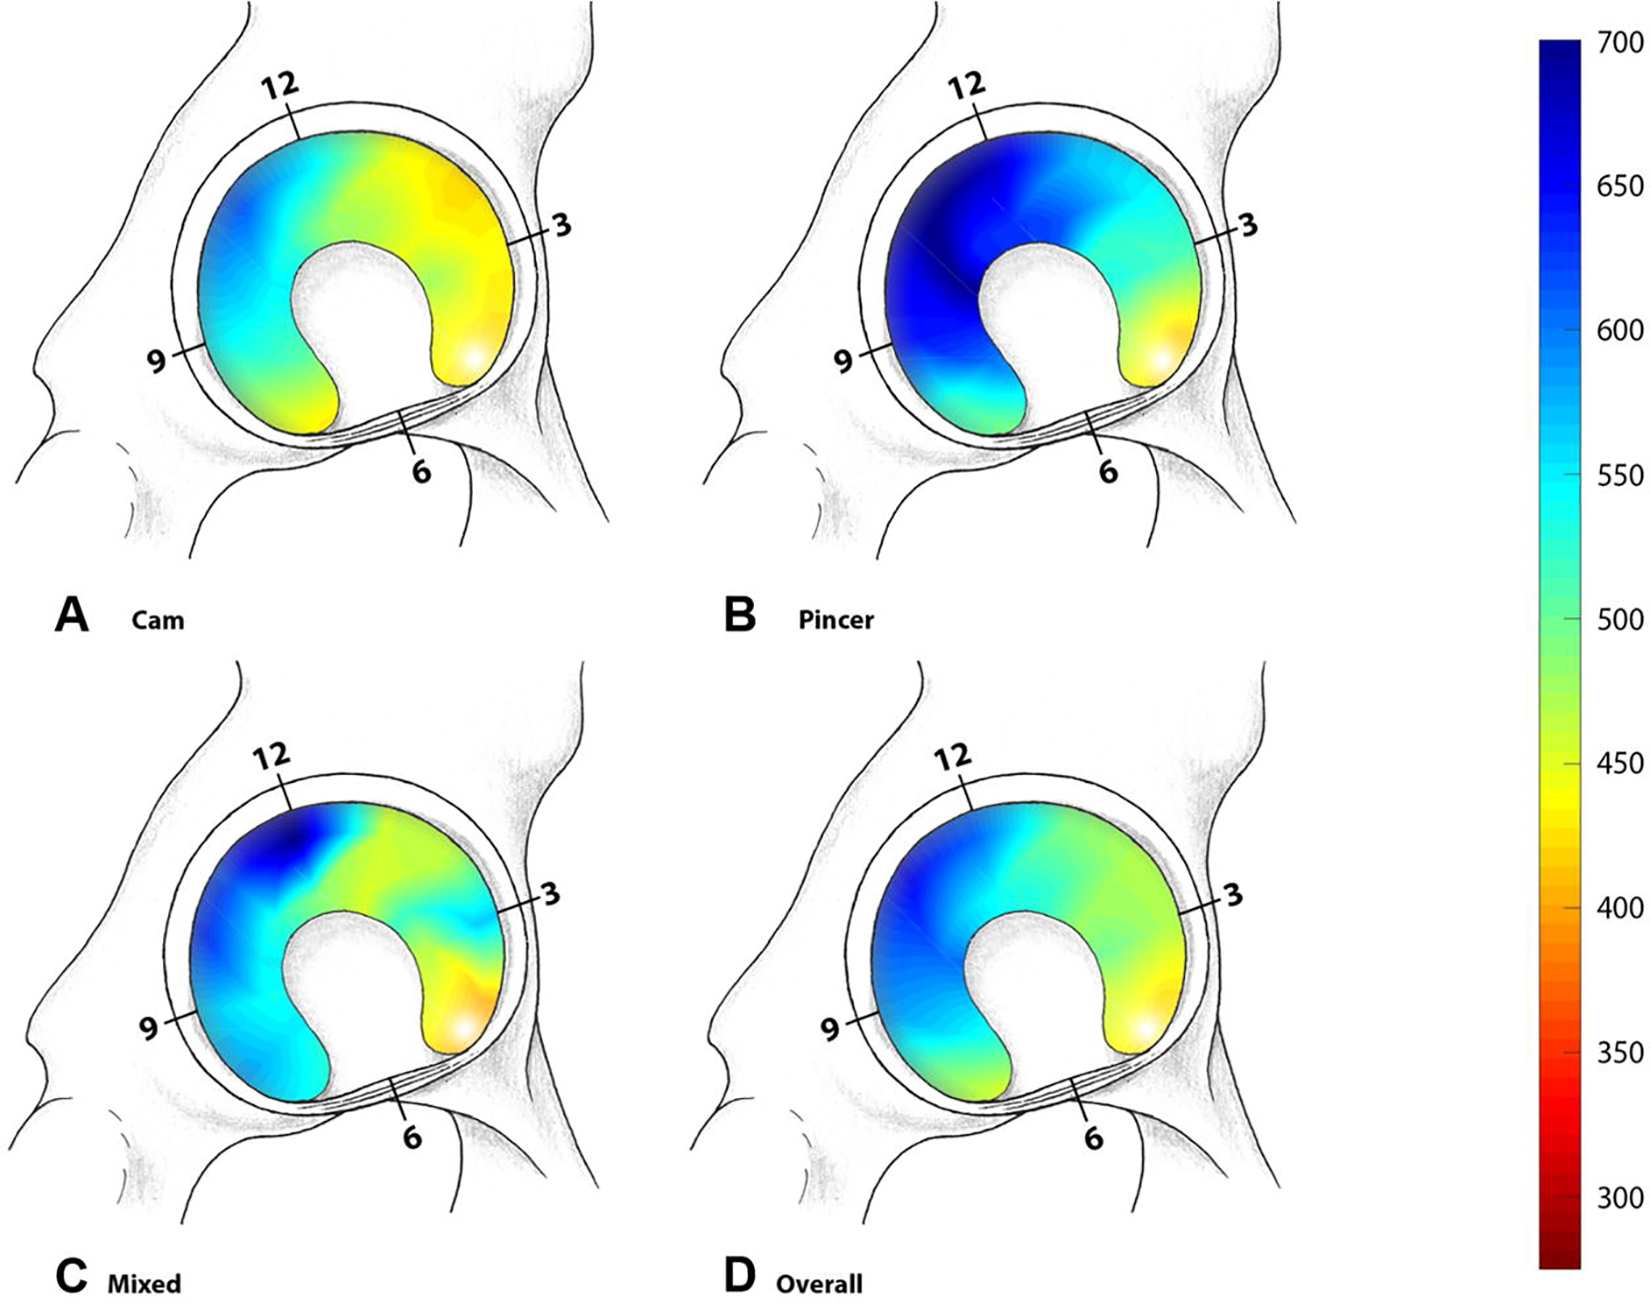
The results of the mean dGEMRIC indices for hips with (A) cam-type FAI, (B) pincer-type FAI, (C) mixed-type, and (D) all hips. Blue indicates healthy cartilage, while red indicates cartilage damage. FAI, femoroacetabular impingement.
We found a significantly lower (P < .001) femoral dGEMRIC index for femoral clock positions with impingement compared with femoral clock positions without impingement for hips with cam-type FAI (434 ± 106 vs 510 ± 123 ms) and for hips with pincer-type FAI (453 ± 154 vs 569 ± 139 ms) (Appendix Table A2).
Discussion
It is currently unclear if acetabular cartilage damage detected on MRI occurs at the impingement zone detected on CT-based 3D dynamic assessment of FAI. We therefore conducted a retrospective, comparative study including 21 hips with morphological MRI, dGEMRIC, and preoperative CT scans of the same hip joints with the aim of correlating early acetabular and femoral cartilage damage with location of impingement. The location of impingement was defined with CT-based 3D models used for dynamic impingement simulation. To analyze this, we asked if the location of cartilage damage was concordant with the zone of impingement and if the mean acetabular and femoral dGEMRIC index differed between superior acetabular clock positions with and without impingement. We found that the dGEMRIC index was able to quantify chondral degeneration (cartilage flaps) in hips with FAI (Figure 5).

Intraoperative view of a 33-year-old male patient who underwent surgical hip dislocation. A cartilage flap anterosuperiorly was detected using the surgical probe. The peripheral acetabular dGEMRIC index was 435 ms for 1 o’clock, 450 ms for 2 o’clock, and 440 ms for 3 o’clock.
Most importantly, we found significantly lower (P < .001) mean acetabular and femoral dGEMRIC indices for acetabular clock positions with impingement compared with clock positions without impingement. In addition, we found that the dGEMRIC index was able to quantify cartilage flaps preoperatively. We found a significantly (P < .001) higher sensitivity of 69% for dGEMRIC compared with morphological MRI and an accuracy of 78%. However, we found a similar accuracy and PPV between MRI with dGEMRIC and morphological MRI. Furthermore, we found a significantly (P < .001) lower acetabular dGEMRIC index for anterosuperior clock positions in hips with cam-type FAI compared with hips with pincer-type FAI.
This is the first study to investigate cartilage damage detected using MRI with dGEMRIC index and its correlation with impingement zones detected using CT-based 3D dynamic assessment of the same hips in patients with symptomatic FAI. Maximal acetabular cartilage damage occurred anteriorly (dGEMRIC index of 472 ± 140 ms at 2 o’clock), at the same clock position of maximal osseous impingement (at 2 o’clock). Based on these results, we interpret that maximal cartilage damage occurs at the zone of maximal osseous impingement. Unfortunately, we found no other study in the orthopaedic literature that compared these 2 variables in the same hip joint. Only 1 study compared intraoperative cartilage damage and osseous impingement zones using collision detection software, but the assessment of intraoperative cartilage lesions was performed using postoperative drawings. 60 That method has limited reproducibility and was performed before routine availability of intraoperative videos during hip arthroscopy or MRI with dGEMRIC. To use dGEMRIC for the prediction of the clinical outcome in patients undergoing PAO for hip dysplasia has been established, 7,18 but limited data exist for patients with FAI. 6,14,51 We acquired 3D dGEMRIC maps and reoriented them like radial slices for circumferential analysis of the entire cartilage. This analysis can cover all potential areas of pre-arthritic cartilage damage. Others studies 6,14 were limited and used either sagittal or coronal images only. With that approach, no circumferential analysis is guaranteed, and zones with cartilage damage could theoretically be overlooked or underdiagnosed.
Previous investigations have assessed cartilage damage using the dGEMRIC index in patients with hip dysplasia, 13,16 and increasingly in patients with FAI, 40 but no comparison with osseous impingement zones had been performed. In addition, our results for the location of maximal cartilage damage are in line with previous investigations assessing the cartilage condition in patients with FAI. 2,22,60
This study has implications for the diagnosis of FAI in young and active patients. Based on the findings, we can conclude that cartilage damage detected on MRI is located at the same clock position as the osseous impingement zone of the same hip joint. This confirms the previously reported validity of the dGEMRIC technique for symptomatic patients with FAI. 63 For clinical practice, the dGEMRIC technique for patients with confirmed FAI using collision detection software exhibited a high accuracy of 78%. This technique could help to identify risk factors (cartilage flaps), to improve surgical planning for treatment of cartilage injuries, and to predict outcomes of patients undergoing hip arthroscopy. Known risk factors for revision hip preservation surgery include residual postoperative intra-articular FAI and extra-articular FAI. 47 Both can be evaluated with CT-based impingement simulation. In addition, abnormal femoral version 26,28 is associated with extra-articular FAI 24 and inferior outcomes after hip arthroscopy, 9 and it is unclear if femoral version abnormalities are a contraindication for hip arthroscopy in isolation. 21 A 3D-CT based study and recent systematic review reported that residual deformity is the most common reason for revision hip arthroscopy. 48,50 Identification of risk factors could help to predict outcomes of hip arthroscopy. 1,12,34,47,58
Acetabular cartilage damage 12 and femoral chondral defects 58 have been identified as risk factors for inferior outcomes after hip arthroscopy and open FAI surgery. Both could be evaluated with MRI with dGEMRIC; for example, a threshold of acetabular dGEMRIC index below 450 or 400 ms could be used as a threshold for cartilage flaps. Therefore, this technique could be useful for patient selection and planning of hip arthroscopy for patients with FAI. Although treatment of FAI is increasingly performed for correction of osseous deformities, its effects on cartilage biology are not clear. The dGEMRIC index can provide detailed quantitative information on the cartilage status preoperatively, and diagnostic hip arthroscopy could be avoided.
Limitations
This study has limitations. First, the collision detection software analyzes the osseous restrictions of hip motion, without analyses of soft tissue (such as the acetabular labrum). However, this is a well-known limitation for different collision detection software programs 3,5 reporting ROM results. This method for calculation of ROM and location of impingement has been utilized for patients with different hip deformities, including dysplastic hips 57 and hips with post-Perthes deformities. 61 Using this method for various hip morphologies demonstrates the validity of the software for impingement detection. Analysis of 3D morphology of the hip has implications for the treatment of patients with pincer-type impingement. 56
A second limitation was that the patients were recruited from a university hospital. There could be a potential selection bias and limited generalizability because of the complex issues of the study patients. However, we did not include hips with post-Perthes deformities or slipped capital femoral epiphysis or with previous operations. Therefore, we think that the study group is representative of noncomplex anterior FAI. Third, we did not report on the surgical treatment or outcome of these patients. However, this was not the aim of this study. Fourth, the manual assessment 51 of cartilage damage using the dGEMRIC technique could have been more standardized using automatic methods. 25,53 However, we do not believe that this fact introduces bias into our results, because the manual assessment has reportedly good reproducibility for 2 observers. 51 Fifth, the definition of cartilage damage using the dGEMRIC technique depends on the used reference for healthy cartilage zone. In the current study, we used the central femoral clock positions in the superior region as a healthy cartilage zone in accordance with a recent study. 22 This is why we do not believe that our definition of cartilage damage should compromise our results. In addition, only 10 patients underwent surgical therapy that allowed a comparison with intraoperative findings. Future studies could compare intraoperative findings and findings on MRI with dGEMRIC in a larger population, and they could investigate the validity of different definitions of cartilage damage. The dGEMRIC technique is quite complex because several factors can have influence, among them the body mass index, degree of physical activity, and variations in time between injection of contrast agent and imaging. 66,67
Conclusion
Maximum acetabular cartilage damage in terms of peripheral acetabular dGEMRIC index was observed at the zone of maximal anterior impingement. The study findings indicate that dGEMRIC has a high sensitivity and is a reliable diagnostic tool for the diagnosis of cartilage damage associated with anterior FAI.
MRI with dGEMRIC provides quantitative information on cartilage quality, and lower dGEMRIC values were found for clock positions with impingement detected on 3D-CT. This could be helpful for a patient-specific diagnosis, to identify cartilage injuries, and to avoid diagnostic hip arthroscopy for patients with FAI. This could help for preoperative patient selection, surgical decision making, and identification of risk factors when planning hip arthroscopy.
Footnotes
Final revision submitted September 1, 2020; accepted September 30, 2020.
One or more of the authors has declared the following potential conflict of interest or source of funding: T.D.L., F.S., and M.T. received funding from the Swiss National Science Foundation. AOSSM checks author disclosures against the Open Payments Database (OPD). AOSSM has not conducted an independent investigation on the OPD and disclaims any liability or responsibility relating thereto.
Ethical approval for this study was obtained from the regional ethics commission for Bern Canton (project ID 2018-00078).
Appendix
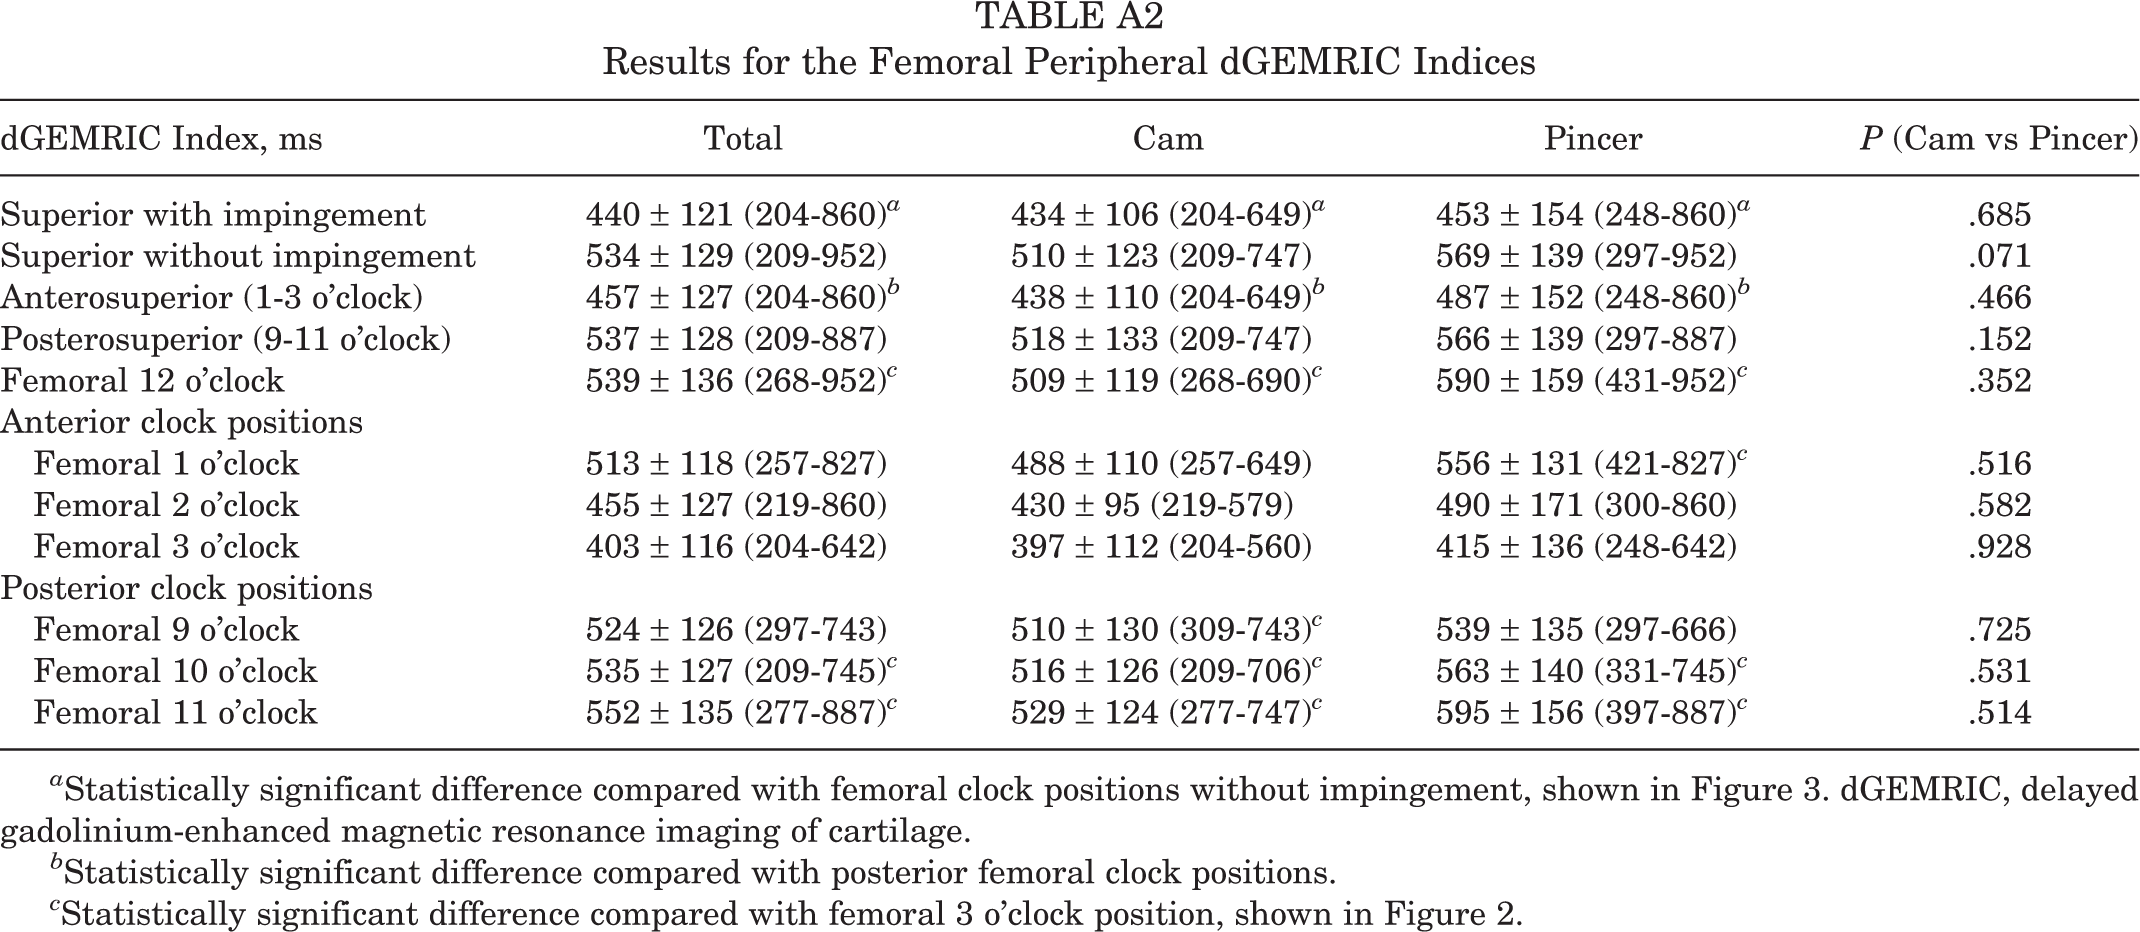
Results for the Femoral Peripheral dGEMRIC Indices
| dGEMRIC Index, ms | Total | Cam | Pincer | P (Cam vs Pincer) |
|---|---|---|---|---|
| Superior with impingement | 440 ± 121 (204-860) a | 434 ± 106 (204-649) a | 453 ± 154 (248-860) a | .685 |
| Superior without impingement | 534 ± 129 (209-952) | 510 ± 123 (209-747) | 569 ± 139 (297-952) | .071 |
| Anterosuperior (1-3 o’clock) | 457 ± 127 (204-860) b | 438 ± 110 (204-649) b | 487 ± 152 (248-860) b | .466 |
| Posterosuperior (9-11 o’clock) | 537 ± 128 (209-887) | 518 ± 133 (209-747) | 566 ± 139 (297-887) | .152 |
| Femoral 12 o’clock | 539 ± 136 (268-952) c | 509 ± 119 (268-690) c | 590 ± 159 (431-952) c | .352 |
| Anterior clock positions | ||||
| Femoral 1 o’clock | 513 ± 118 (257-827) | 488 ± 110 (257-649) | 556 ± 131 (421-827) c | .516 |
| Femoral 2 o’clock | 455 ± 127 (219-860) | 430 ± 95 (219-579) | 490 ± 171 (300-860) | .582 |
| Femoral 3 o’clock | 403 ± 116 (204-642) | 397 ± 112 (204-560) | 415 ± 136 (248-642) | .928 |
| Posterior clock positions | ||||
| Femoral 9 o’clock | 524 ± 126 (297-743) | 510 ± 130 (309-743) c | 539 ± 135 (297-666) | .725 |
| Femoral 10 o’clock | 535 ± 127 (209-745) c | 516 ± 126 (209-706) c | 563 ± 140 (331-745) c | .531 |
| Femoral 11 o’clock | 552 ± 135 (277-887) c | 529 ± 124 (277-747) c | 595 ± 156 (397-887) c | .514 |
a Statistically significant difference compared with femoral clock positions without impingement, shown in Figure 3. dGEMRIC, delayed gadolinium-enhanced magnetic resonance imaging of cartilage.
b Statistically significant difference compared with posterior femoral clock positions.
c Statistically significant difference compared with femoral 3 o’clock position, shown in Figure 2.