
Abstract
Background:
Obesity, which potentially increases loading at the knee, is a common and modifiable risk factor for the development of knee osteoarthritis. The menisci play an important role in distributing joint loads to the underlying cartilage. However, the influence of obesity on the role of the menisci in cartilage load distribution in vivo is currently unknown.
Purpose
To measure tibial cartilage thickness and compressive strain in response to walking in areas covered and uncovered by the menisci in participants with normal body mass index (BMI) and participants with high BMI.
Study Design:
Controlled laboratory study.
Methods:
Magnetic resonance (MR) images of the right knees of participants with normal BMI (<25 kg/m2; n = 8) and participants with high BMI (>30 kg/m2; n = 7) were obtained before and after treadmill walking. The outer margins of the tibia, the medial and lateral cartilage surfaces, and the meniscal footprints were segmented on each MR image to create 3-dimensional models of the joint. Cartilage thickness was measured before and after walking in areas covered and uncovered by the menisci. Cartilage compressive strain was then determined from changes in thickness resulting from the walking task.
Results:
Before exercise, medial and lateral uncovered cartilage of the tibial plateau was significantly thicker than covered cartilage in both BMI groups. In the uncovered region of the lateral tibial plateau, participants with high BMI had thinner preexercise cartilage than those with a normal BMI. Cartilage compressive strain was significantly greater in medial and lateral cartilage in participants with high BMI compared with those with normal BMI in both the regions covered and those uncovered by the menisci.
Conclusion:
Participants with high BMI experienced greater cartilage strain in response to walking than participants with normal BMI in both covered and uncovered regions of cartilage, which may indicate that the load-distributing function of the meniscus is not sufficient to moderate the effects of obesity.
Clinical Relevance:
These findings demonstrate the critical effect of obesity on cartilage function and thickness in regions covered and uncovered by the menisci.
Knee osteoarthritis (OA) is a debilitating disease and a leading cause of musculoskeletal pain. 22,26 One of the most common and modifiable risk factors for the development of knee OA is obesity, which increases the relative risk of developing OA 4-fold. 33 Numerous studies contend that this relationship is due to increased joint loading as a result of elevated body mass. 6,19,37 However, other studies have suggested that the relationship between obesity and OA is more complex, specifically citing a combination of both biomechanical and biochemical factors. 17 In support of this theory, obesity has been shown to increase the risk of OA in non–load bearing joints, such as the hand, suggesting that systemic factors likely play a role in disease development and progression. 18,35
It is well-established that normal physiologic loading regulates both the structure and the function of cartilage and is beneficial for overall cartilage health. 15,21,40 However, cartilage is sensitive to abnormal loading, which can disrupt its normal function. 2,4,38 Specifically, nonphysiologic loading can disrupt the balance of tissue remodeling toward catabolism 4 and may lead to matrix breakdown and subsequent softening, 11,20,47 fibrillation, 32 and loss of articular cartilage. 29,38
Because of their critical role in load distribution within the joint, the menisci are important for the maintenance of joint health. 45 This is supported by the strong associations between meniscal tears and subsequent degeneration of cartilage. 14,39 Roughly 15 years after meniscectomy, nearly 50% of patients have radiographic features of OA, with the risk of developing OA being related to the amount of meniscal tissue removed. 39 We previously investigated cartilage thickness and strains in regions covered and regions uncovered by the menisci while walking in healthy participants. 27 However, little is known about the load-distribution function of the menisci in the presence of obesity.
Therefore, the overall goal of the present study was to measure tibial cartilage thickness and compressive strain in areas covered and uncovered by the menisci in participants with a normal body mass index (BMI; <25 kg/m2) as well as participants with a high BMI (>30 kg/m2). 42 We hypothesized that cartilage strains as a result of treadmill walking would be greater in participants with a high BMI both in areas of cartilage covered by the menisci and in areas of the cartilage uncovered by the menisci. We also hypothesized that the cartilage of participants with high BMI would be thinner than the cartilage of participants with normal BMI in areas of cartilage both covered and uncovered by the menisci.
Methods
Participant Recruitment
Eight participants with normal BMI (18-25 kg/m2) and 7 participants with a BMI consistent with the US Department of Health and Human Services definition of obesity (>30 kg/m2) 42 participated in this study from January 2015 to September 2016. This study was approved by our university’s institutional review board. 12 Participants were excluded based on prior injury or surgery, degenerative pathology of the knee joint, or symptoms of knee OA. Knee joint alignment was determined to be within the neutral alignment range of 2° to 3° 9 based on joint angles measured via the long axes of the femur and tibia on coronal view magnetic resonance (MR) images. There were no statistically significant differences between groups with regard to age or distribution of sex. 12 The sample size for this study was based on a previous study from our lab, which investigated the effect of treadmill walking on knee cartilage thickness in healthy participants. In this prior study, statistically significant changes in cartilage thickness were measured with a sample size of 8 participants. 24 Therefore, we aimed to test a similar number of participants per BMI group in this study. 12
Study Procedure
Study participants were tested early in the morning to minimize the effects of diurnal cartilage loading. Furthermore, those enrolled were asked to refrain from strenuous activities the day before and the morning of testing. 12 Before the first MR imaging scan, participants rested supine in a room adjacent to the MR scanner for 45 minutes to allow for cartilage equilibration toward its minimally loaded state. 8 After the rest period, participants were transferred to the adjacent room via wheelchair for the preexercise MR imaging scan. Each participant’s right knee was imaged in the sagittal plane using a 3.0-T MR scanner (Trio Tim; Siemens Medical Solutions USA) with a double-echo steady-state (DESS) sequence (flip angle, 25°; echo time, 6 ms; repetition time, 17 ms; resolution, 0.3 mm × 0.3 mm × 0.1 mm). 12,27 After this preexercise MR scan, participants walked unsupported on a level treadmill (F80; Sole Fitness) for 20 minutes at a speed that was normalized to the length of their leg using the Froude number (Fr) 3 :

where leg length (l) is defined as the distance measured from the greater trochanter to the walking surface and g is the gravitational constant (9.8 m/s2). Participants walked at a Fr of 0.25, which is equivalent to a comfortable walking speed. 3 A specific walking speed (v) was then calculated for each participant. To track the number of steps taken during the walking task, participants wore a pedometer on their waist. Within 4 minutes of completing the walking activity, participants underwent a postexercise MR imaging DESS scan (mean time from the conclusion of exercise to the postexercise DESS scan, 3.2 minutes).
Data Analysis
After MR imaging, the tibia, articular cartilage, and menisci were manually segmented on each MR image using solid modeling software (Rhinoceros 4.0; Robert McNeel & Associates) (Figure 1A). 7,12,41 All segmented images were then stacked to create a wire frame model (Figure 1B) from which 3-dimensional models of the tibia, cartilage, and menisci were generated (Figure 1C). To ensure that cartilage thickness was measured at the same locations on the pre- and postexercise models, the postexercise joint model was registered to the preexercise joint model for each participant using an iterative closest-point technique. 12

(A) The tibia, cartilage, and meniscal surfaces were manually segmented on each magnetic resonance image. (B) All segmented slices were stacked to attain a wire frame model. (C) Next, 3-dimensional models were rendered of the tibia, cartilage, and menisci allowing for visualization of the regions of tibial cartilage either covered or uncovered by the menisci.
After registration, cartilage thickness was measured at each cartilage surface vertex in both the pre- and postactivity models by determining the distance between the bone model surface and the nearest vertex on the cartilage model surface. Cartilage thickness was then sampled across the tibial cartilage surfaces within evenly distributed sampling regions that were 2 mm in radius, while considering the locations of the medial and lateral menisci (Figure 2). 27 Specifically, 10 regions were sampled on each of the tibial plateaus, with 5 regions in the area of cartilage covered by the menisci and 5 adjacent regions located in areas uncovered by the menisci, for a total of 20 sampling regions (Figure 2). We sampled paired points (uncovered and covered) adjacent to each other to compare the effects of meniscal coverage on cartilage thickness and strain.
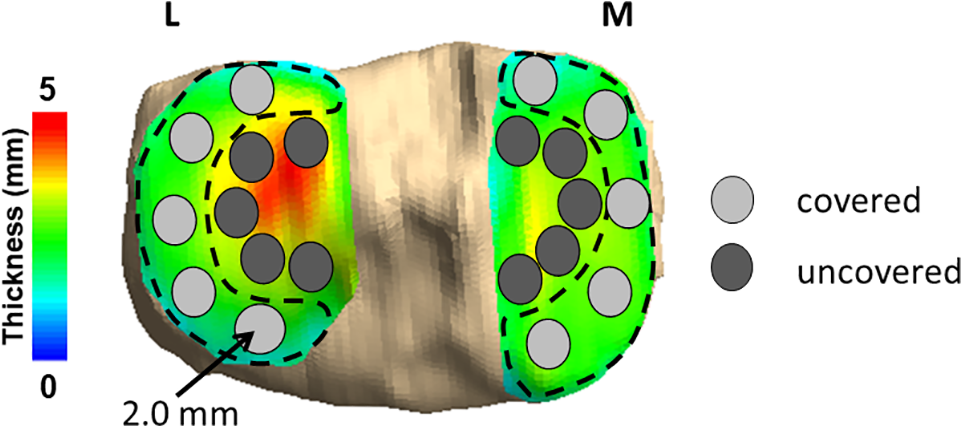
Cartilage thickness was sampled across the tibial cartilage surfaces within evenly distributed sampling regions of 2.0-mm radius, while considering the locations of the medial and lateral menisci. Thickness was sampled within 10 regions on each tibial plateau, with 5 regions located in areas covered by the meniscus and 5 adjacent regions placed in areas uncovered by the meniscus. Red is indicative of thicker cartilage, while blue and green are indicative of thinner cartilage. L, lateral; M, medial.
All thickness values at the cartilage vertices within each sampling region were averaged to calculate a mean cartilage thickness for that region. 27 This methodology has been shown to reflect tibiofemoral cartilage thickness to within a resolution of 1%. 10,43 Furthermore, the local compressive strain was calculated as the normalized change in cartilage thickness within each sampling region before and after exercise. We also determined the percentage of meniscal coverage in all joints to determine whether the amount of coverage provided by the meniscus differs with BMI. We calculated this by dividing the total area of articular surface of the tibial cartilage covered by the meniscus by the total area of articular surface of the tibial cartilage in each compartment before exercise (Figure 3).
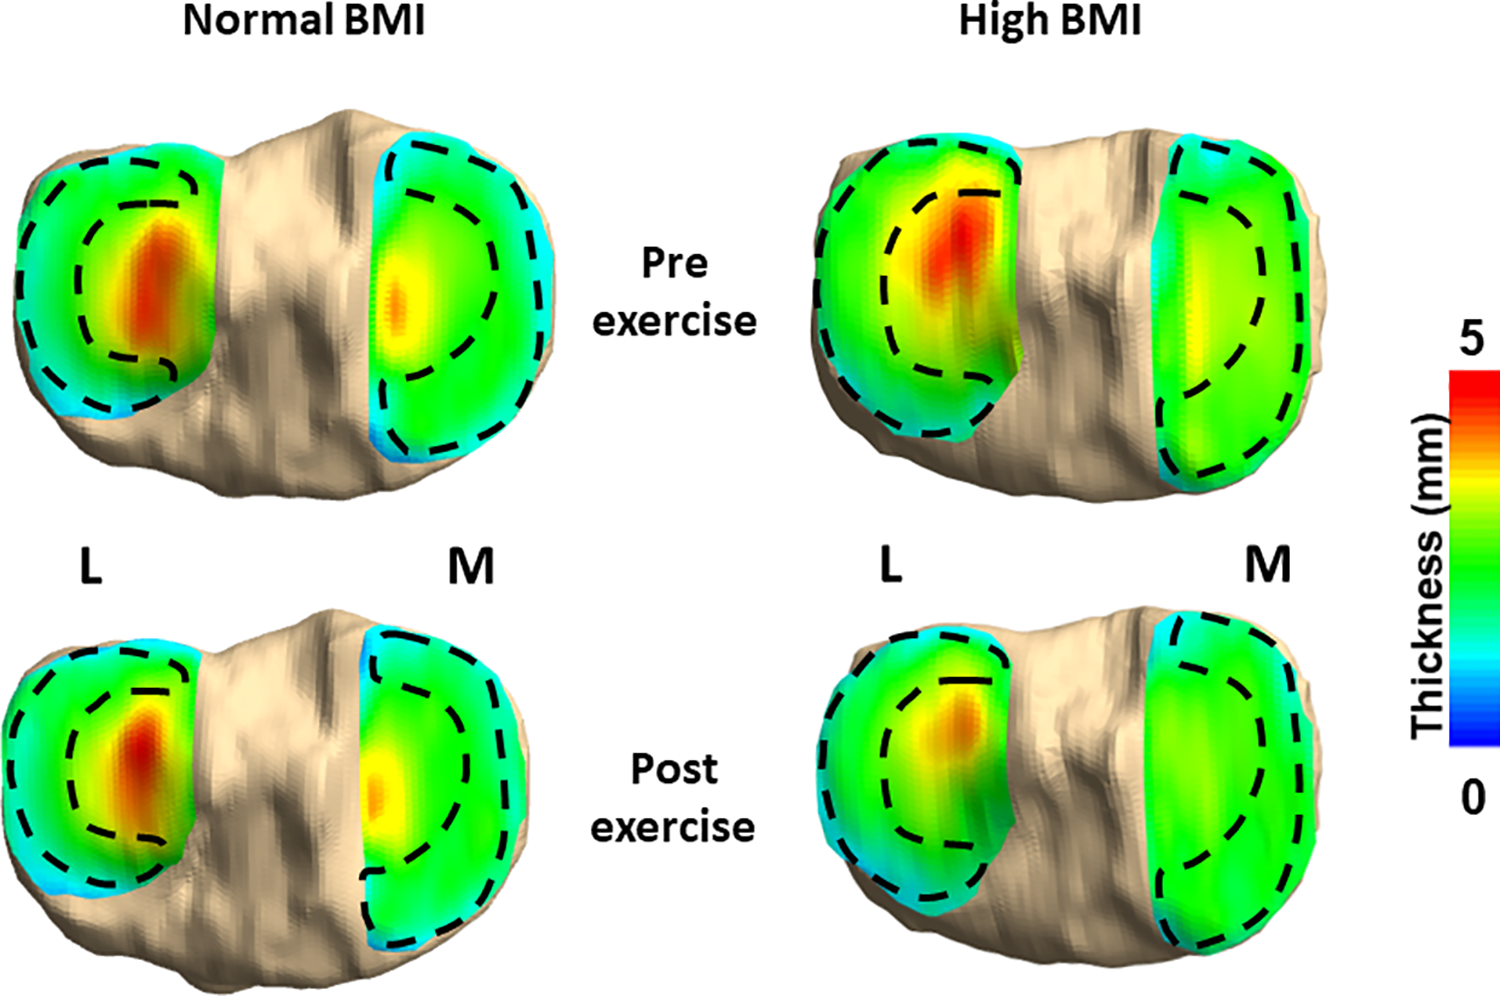
Representative pre- and post-exercise cartilage thickness maps of 1 participant with a normal body mass index (BMI) and 1 participant with a high BMI demonstrating the meniscal footprints and areas of cartilage covered and uncovered by the menisci. L, lateral; M, medial.
Statistical Analysis
Descriptive statistics in the form of means and standard deviations were calculated for all analyzed variables (including walking speed, steps taken, percentage of meniscal coverage, preexercise cartilage thickness, and cartilage compressive strain). Visual inspection of histograms of these variables suggested a normal distribution in each. Student t tests were used to compare steps taken as well as the percentage of meniscal coverage in both the lateral and the medial tibial compartments between BMI groups.
Differences in preexercise cartilage thickness and cartilage strain in the medial and lateral tibial cartilage were analyzed using 2-way repeated-measures analyses of variance, with 1 between-participant factor (BMI: high vs normal) and 1 within-participant factor (meniscal coverage: covered vs uncovered). Significant F ratios were assessed with the Tukey honestly significant difference test as appropriate. Differences were considered statistically significant at P < .05.
Results
Participants walked at a mean speed of 3.4 ± 0.1 (mean ± SD) mph. We did not detect statistically significant differences between the mean number of steps taken during the treadmill walking task between normal and high BMI groups (2303 vs 2393, respectively; P = .11), nor in in the percentage of meniscal coverage between the normal and high BMI groups (medial, P = .13; lateral, P = .64).
Preexercise Cartilage Thickness
In the medial compartment (Figure 4A), there was a significant main effect of meniscal coverage on preexercise cartilage thickness (P < .001), with uncovered cartilage being thicker than covered cartilage across both BMI groups. No statistically significant effects of BMI on cartilage thickness (P = .19), nor any statistically significant interactions between BMI and coverage (P = .12), were detected. With regard to preexercise cartilage thickness in the lateral compartment (Figure 4B), there was a statistically significant interaction between BMI and meniscal coverage (P = .02). Post hoc testing indicated that preexercise cartilage was significantly thicker in uncovered areas than in covered areas across both BMI groups (P < .001). Additionally, preexercise cartilage in the lateral uncovered area was significantly thinner in participants with high BMI compared with those with a normal BMI (P = .001).
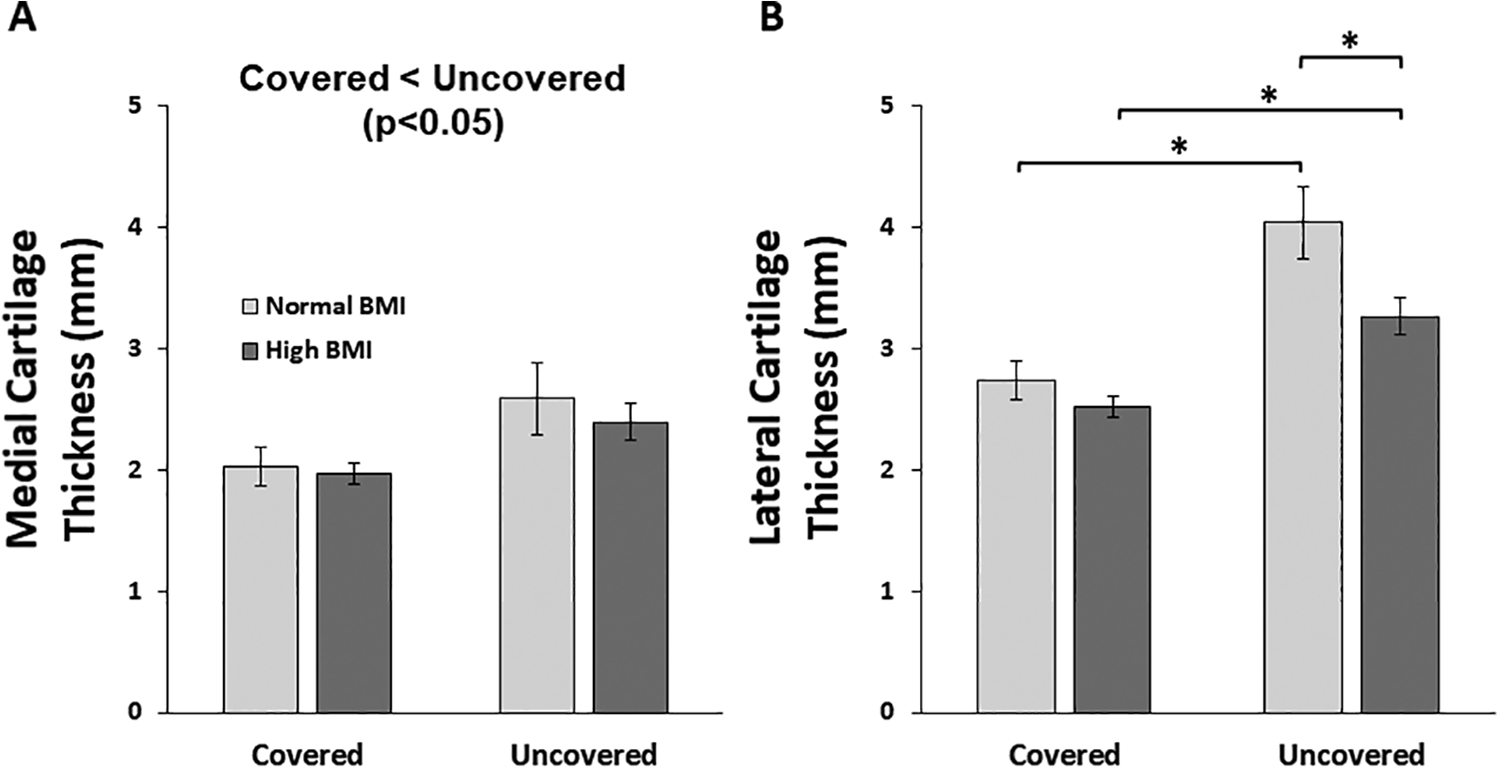
Mean (± SD) preexercise tibial cartilage thickness by meniscal coverage and body mass index (BMI) in the (A) medial and (B) lateral compartments. Preexercise cartilage was significantly thicker in uncovered areas compared with covered areas in both BMI groups in both compartments. Uncovered lateral tibial cartilage was significantly thinner in participants with high BMI compared with those with low BMI. *P < .05 based on the Tukey honestly significant difference procedure.
Cartilage Compressive Strain
In the medial compartment (Figure 5A), there was a significant main effect of BMI on cartilage strain (P = .014), with significantly higher strains in the high BMI group compared with the normal BMI group. Neither statistically significant main effect of coverage (P = .70), nor any significant interactions between BMI and coverage (P = .55), were observed. Similarly, in the lateral compartment, there was also a significant main effect of BMI (P = .006) on cartilage strain, with the high BMI group having higher cartilage strains than the normal BMI group. No statistically significant main effect of coverage (P = .17) or any significant interactions between BMI and coverage (P = .89) were observed.

A significant main effect of body mass index (BMI) was found on compressive cartilage strain in both the (A) medial and (B) lateral compartments, with neither a significant main effect of meniscal coverage nor a significant interaction between BMI and meniscal coverage in either compartment. Compressive cartilage strain was significantly greater in the high BMI group compared with the normal group in both the covered and the uncovered areas of both the medial and the lateral tibial plateaus. Data are presented as mean ± SD.
Discussion
In this study, we used MR imaging to assess the effect of obesity on site-specific tibial cartilage strains in areas covered and uncovered by the menisci. Our results demonstrated that preexercise cartilage was significantly thicker in areas uncovered by the menisci in both the normal BMI and high BMI groups. Furthermore, BMI significantly affected lateral preexercise cartilage thickness, with cartilage being thinner in the uncovered region in participants with a high BMI compared with participants with a normal BMI. We also found significantly greater cartilage compressive strain in the high BMI group compared with the normal BMI group, in regions both covered and uncovered by the menisci. These findings demonstrate the critical effect of obesity on cartilage function and thickness in both regions covered and uncovered by the menisci.
There is controversy in the literature regarding how obesity may influence joint loading. For example, DeVita and Hortobagyi 13 showed that adults who were obese walked slower and demonstrated both a longer stance phase and reduced knee flexion angles when compared with adults who were not obese. These changes were thought to be strategies employed to reduce knee joint loading experienced as a result of greater mass. 13 Other studies have indicated that joint loading is increased with elevated body mass and estimated that joint loads are reduced as much as 4-fold with each pound of body mass lost. 31 In further support of this hypothesis, Widmyer et al 46 showed that over the course of normal daily activities, participants with high BMI had significantly higher tibial cartilage compressive strains compared with participants with normal BMI. Our results further support the idea that increased joint loading associated with obesity may be a possible factor leading to the initiation of OA, as we demonstrated greater cartilage strains in participants with high BMI.
One of the main functions of the menisci in a healthy joint is to distribute loads during normal activities. 5,14,27 Importantly, in the presence of injury or abnormal joint loading, the ability of the menisci to perform these tasks may be altered. 1,7,28 Our results indicate that obesity increases cartilage strains in regions covered and uncovered by the menisci. It is also possible that alterations in the position of the menisci with increased joint loading (via obesity) may diminish the capacity of the menisci to bear loads. 44,48 Furthermore, in addition to higher joint loads, altered movement patterns with obesity 13 may influence the normal position of the menisci and affect its ability to distribute loads. 48 Specifically, Zhang et al 48 showed that a high BMI can result in increased extrusion of the medial meniscus compared with a normal BMI, potentially altering the size and area of the cartilage covered by the meniscus. Landsmeer et al 25 also demonstrated that meniscal extrusion is diminished with weight loss, further supporting the concept that changes in weight can alter meniscal position. In support of this, our results demonstrated greater cartilage strains in participants with high BMI, in regions both covered and uncovered by the menisci. These findings may be due in part to the increased loads experienced by the entire joint and an inability of the menisci to distribute these loads because of alterations in meniscal composition, position, or mechanical function.
While elevated joint loading with obesity may contribute to the increased strains in regions of cartilage both uncovered and covered by the menisci, these changes may also be the result of obesity-associated changes in the composition of the menisci themselves. In addition to alterations in joint loading, increased fat mass has been associated with increased levels of adipose tissue–derived cytokines, which contribute to a pro-inflammatory environment within the joint. 16 One study noted that increased adipokines stimulated rapid and extensive catabolism of meniscal tissue. 34 The authors described increased release of sulfated glycosaminoglycans within explanted meniscal tissue, as a result of resistin (a specific adipokine associated with OA severity) treatment, and these changes could affect tissue stiffness by depleting this key structural component. 34 Similarly, McNulty et al 30 showed increased degradation of both cartilage and meniscal tissue, as evidenced by increased matrix metalloproteinase activity and proteoglycan release, with the presence of visfatin, another adipokine that is increased with obesity and promotes a state of chronic, low-grade inflammation. Additionally, a recent study 23 using data from the Osteoarthritis Initiative found a 4-fold increased risk of meniscal tear among participants who were obese when compared with controls with normal BMI. Laberge et al 23 also noted a greater frequency of meniscal lesions in participants who were overweight and obese compared with participants with normal BMI, and added that higher BMI was associated with an alteration in the anatomic distribution of meniscal abnormalities. Perhaps the increased presence of adipokines with obesity affects meniscal composition and, therefore, meniscal function, compromising its ability to distribute loads and protect the underlying articular cartilage.
Our results showed that preexercise cartilage thickness was not significantly different between the normal and high BMI groups in areas covered by the menisci, which may reflect the protective role of the menisci. However, the uncovered lateral plateau of tibial cartilage was significantly thinner in the high BMI group compared with the normal BMI group. This thinner cartilage may be reflective of early cartilage degeneration in participants who are obese. To this point, previous work from our lab has shown reductions in cartilage proteoglycan concentration in participants who are obese, as demonstrated by increased T1ρ relaxation times. 12 These data suggest that the composition of cartilage differs with obesity, resulting in softer, less stiff cartilage that may be more susceptible to excessive loading. 12 Thus, thinner uncovered cartilage in participants with high BMI compared with those with normal BMI may be the result of softened cartilage that is in a pre-OA state and at greater risk for mechanical changes. 12 Expanding on these obesity-related alterations in cartilage composition and function, here we showed increased cartilage strains in both uncovered and covered regions of cartilage in participants with high BMI compared with those with normal BMI. Thus, our previous work demonstrating obesity-related alterations in cartilage composition, 12 combined with the results of the present study, shows that it is possible that the catabolic activities of adipokines result in a pro-inflammatory environment in the joint, leading to cartilage softening and subsequent alterations in cartilage mechanical function in both areas covered and areas uncovered by the menisci. 16 These obesity-related biological and mechanical changes likely influence the incidence and progression of OA.
In this paper, we utilized a novel “stress test” of cartilage function 36 to assess differences in cartilage strain resulting from walking in individuals with high versus normal BMI. Although participants were asked to refrain from strenuous activity and rested supine for 45 minutes before testing, it is possible that preexercise cartilage thickness measured in this study was underestimated because of insufficient recovery of the cartilage before the preexercise MR scan. However, our previous work demonstrated that a 45-minute rest period before the preexercise MR scan resulted in consistent baseline cartilage thickness values across test sessions. 36 Additionally, because of the time required to begin the postexercise MR scan after the walking activity (mean, 3.2 minutes), it is possible that some cartilage recovery occurred after the walking activity, resulting in underestimations of cartilage strain values. 36 However, no differences were observed in the time from completion of treadmill walking to initiation of imaging between BMI groups. 12
In summary, we found a significant effect of both BMI and meniscal coverage on baseline in vivo tibial cartilage thickness. We also showed that obesity increases cartilage strains during dynamic loading, in areas of the cartilage both covered and uncovered by the menisci. Characterizing the effects of BMI and meniscal coverage on in vivo cartilage thickness and strain is a critical first step in understanding the mechanisms by which obesity alters the mechanical response of cartilage and contributes to the incidence and progression of OA. Additionally, characterizing these effects in young, asymptomatic individuals allows for further understanding of OA pathogenesis and the role of modifiable risk factors, such as obesity. Our results provide important information for a better understanding of the role of the menisci in the presence of obesity-induced OA. Investigations into obesity-related biological and mechanical factors may provide valuable information that could identify targets to prevent or slow OA progression. Finally, as the obesity epidemic continues to worsen, it is increasingly important to better understand the effect of obesity on cartilage health.
Footnotes
Acknowledgment
The authors acknowledge the Duke Center for Advanced Magnetic Resonance Development for technical assistance. They also thank Donald T. Kirkendall for assistance with manuscript revisions.
Final revision submitted May 20, 2020; accepted June 11, 2020.
One or more of the authors has declared the following potential conflict of interest or source of funding: This study was supported by the National Institutes of Health (AR066477, AR065527, and AR073221) and an Orthopaedic Research and Education Foundation grant with funding provided by the Musculoskeletal Transplant Foundation. AOSSM checks author disclosures against the Open Payments Database (OPD). AOSSM has not conducted an independent investigation on the OPD and disclaims any liability or responsibility relating thereto.
Ethical approval for this study was obtained from Duke University Health System (protocol No. Pro00057406).