
Abstract
Background:
Medial patellar facet lesions have been well-described in the setting of patellar instability. However, relatively little is known about risk factors for atraumatic medial patellar facet lesions.
Purpose/Hypothesis:
To identify clinical and radiographic risk factors for medial patellar facet lesions in patients without a history of trauma or patellar instability. It was hypothesized that a posterior tibial tubercle relative to the trochlear groove would be a risk factor for atraumatic medial patellar facet lesions.
Study Design:
Case-control study; Level of evidence, 3.
Methods:
A total of 37 patients with atraumatic medial patellar facet lesions were matched by age, sex, and body mass index with 37 control patients without a history of patellofemoral dysplasia. Demographic and imaging characteristics were compared between groups. Plain radiography was used to evaluate Wiberg type, and magnetic resonance imaging was used to calculate Caton-Deschamps index, tibial tubercle-trochlear groove distance, trochlear facet asymmetry ratio, patellotrochlear index, sulcus depth, patellar bisect ratio, and tibial tubercle height. Statistically significant variables from univariate analysis were used as inputs to the multivariate regression model to assess independent risk factors.
Results:
There were no differences between groups with respect to Wiberg type, Caton-Deschamps index, tibial tubercle-trochlear groove distance, sulcus depth, or patellotrochlear index (P > .05 for all). The medial facet lesion group had a larger medial trochlear facet (trochlear facet asymmetry ratio, 0.72 ± 0.11 vs 0.60 ± 0.09; P < .001), a more medial-lying patella in the trochlear groove (patellar bisect ratio, 0.57 ± 0.06 vs 0.55 ± 0.07; P = .035), and a more posterior tibial tubercle relative to the trochlear groove (tibial tubercle height, -3.13 ± 5.21 vs -0.23 ± 5.93 mm; P = .030) compared with the control group. Multivariate regression analysis identified trochlear facet asymmetry and tibial tubercle height as independent risk factors for medial patellar facet lesions (relative risk = 97.3 [95% CI, 14.9-635.1], P < .001 and relative risk = 0.95 [95% CI, 0.92-0.98], P = .004, respectively).
Conclusion:
A relatively larger medial trochlear facet and a more posterior tibial tubercle relative to the trochlear groove were found to be risk factors for medial patellar facet lesions in patients without a history of trauma or patellar instability.
Patellar articular cartilage lesions are a common cause of knee pain and disability in young patients, with a natural history that predisposes to the development of early patellofemoral osteoarthritis.2,28 Most commonly, these cartilage injuries develop in the setting of acute and/or chronic patellofemoral instability, with previous studies reporting an incidence of 40% to 96% after patellar dislocation events.12,28
In the majority of cases, patellar chondral lesions secondary to patellofemoral instability are linked to a number of predisposing anatomic factors, including patella alta, torsional malalignment (ie, increased axial tibial tubercle-trochlear groove [TT-TG] distance), trochlear dysplasia, and ligamentous laxity.2,13,15,16,25,27 In these patients, optimal treatment typically involves an anteromedializing tibial tubercle osteotomy (AMZ TTO) in combination with patellofemoral cartilage restoration procedures.13,14,17,21 Underlying anatomic abnormalities must be addressed in these patients not only to prevent recurrent instability but also to decrease contact pressure on the patella. This is of utmost importance when concomitant cartilage restoration procedure is performed, as offloading the patella may improve outcomes of the cartilage restoration procedure. 20
Although patellar chondral lesions secondary to instability are more common, a subset of patients present with patellar articular cartilage lesions in the absence of trauma or previous instability events.11,17 Several recent studies have demonstrated that sagittal TT-TG distance (also referred to as tibial tubercle height) is a significant risk factor for the development of isolated atraumatic patellofemoral cartilage lesions.16,17,27 These studies suggest that a more posterior position of the tibial tubercle relative to the trochlear groove may predispose patients to the development of patellofemoral cartilage lesions in the absence of trauma or instability.
However, these studies did not specifically separate cohorts based on patellar facet lesion location, and unlike lesions secondary to patellar instability, there is currently a paucity of data identifying risk factors associated with atraumatic isolated medial patellar facet lesions. It is critical to identify anatomic risk factors for atraumatic patellar chondral lesions, as these risk factors may be amenable to surgical management that could not only improve healing of cartilage restoration procedures but may also improve longevity of the aforementioned procedures.
The purpose of this study was to assess demographic and anatomic risk factors (including trochlear facet asymmetry, tibial tubercle height, TT-TG distance, patellar bisect ratio, and patellar morphology) for the development of symptomatic medial patellar facet cartilage lesions in patients without a history of trauma or patellofemoral instability compared with matched control patients without patellar cartilage lesions. We hypothesized that patients with atraumatic medial patellar facet cartilage lesions would demonstrate morphological differences compared with patients without patellar cartilage lesions.
Methods
Patient Selection
Institutional review board approval was received for the study protocol. We identified 62 patients with medial patellar facet lesions by reviewing the electronic medical records at a single institution for magnetic resonance imaging (MRI) reports of Outerbridge grades 1 through 4 chondral or osteochondral lesions of the medial patellar facet between August 2014 and August 2022, and patients provided informed consent. Patients were excluded from the study if they had previous or concomitant tibial tubercle osteotomy, if they had a poor-quality MRI that did not allow for visualization of the medial patellar facet lesion, or if they had chondral lesions to multiple surfaces about the knee (chondral lesions of the medial facet of the patella plus medial femoral condyle). Of the 62 patients initially identified, 37 met the study inclusion criteria (Figure 1).
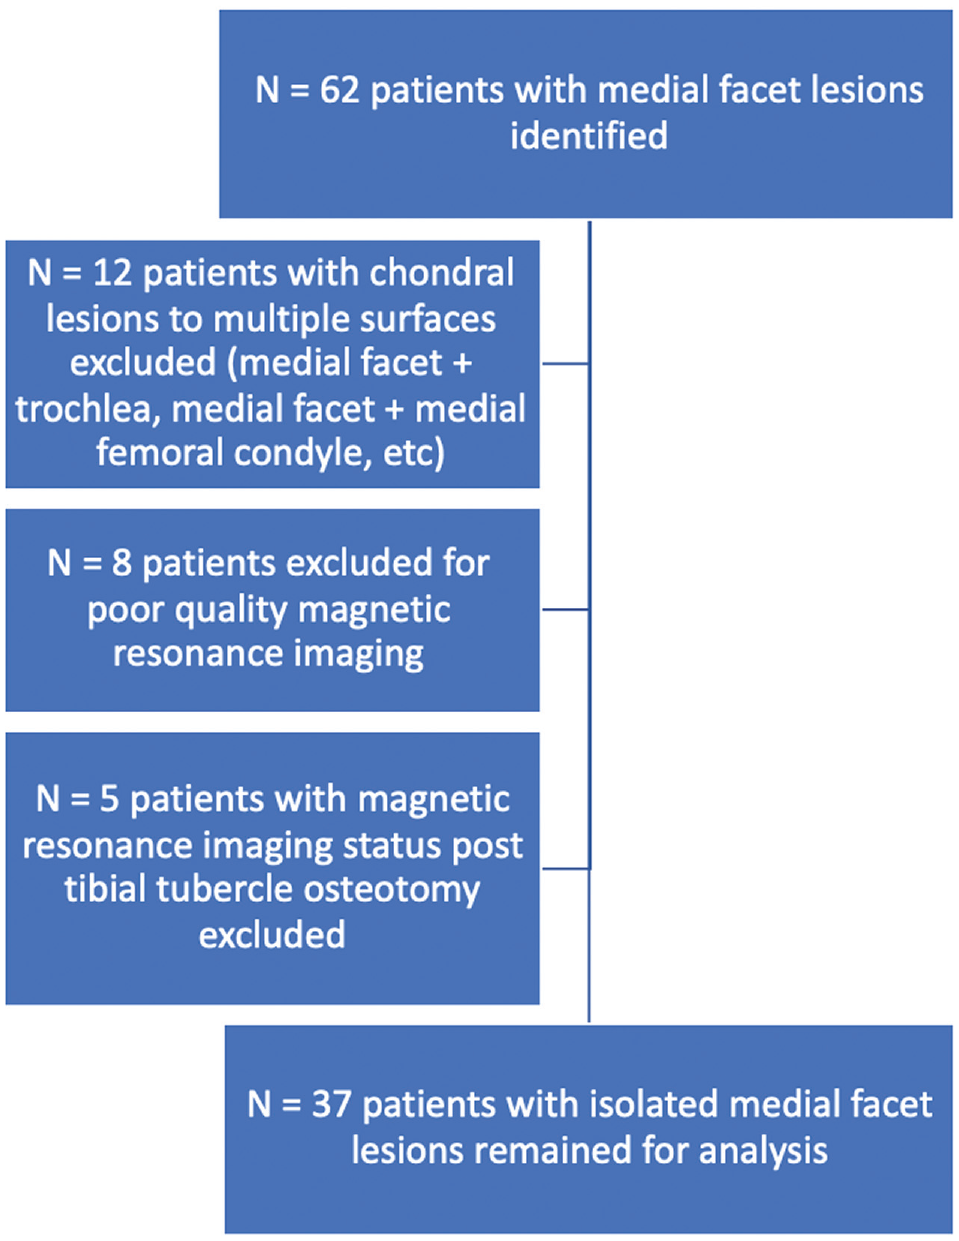
Flowchart demonstrating inclusion and exclusion criteria for patients with medial facet lesions.
The 37 patients with isolated medial facet lesions were matched 1-to-1 according to age, sex, and body mass index (BMI) to patients with isolated medial and/or lateral meniscal tears without evidence of chondral pathology or patellofemoral dysplasia (controls). This cohort was identified by querying the electronic medical record for patients who had undergone partial medial and/or lateral meniscectomy or medial and/or lateral meniscal repair between November 1, 2019, and February 28, 2023, by 1 of 2 sports medicine fellowship-trained orthopaedic surgeons (A.S.G. and S.M.S.).
Demographic information for the study and control groups was obtained via review of the electronic medical records.
Measurement Techniques
Measurements were performed on 1.2-, 1.5-, or 3.0-T MRI. The medial-to-lateral size of the lesion (in millimeters) was measured on axial MRI. The proximal-to-distal size of the lesion (in millimeters) was measured on sagittal MRI. Merchant view plain radiographs were used to determine Wiberg patellar type, with type 1 or type A patellae having a concave medial facet that is approximately the same size as the lateral facet, type 2 or B patellae having a concave medial facet that is smaller in size than the lateral facet, and type 3 or C patellae having a convex or more vertical medial facet (Figure 2).19,26
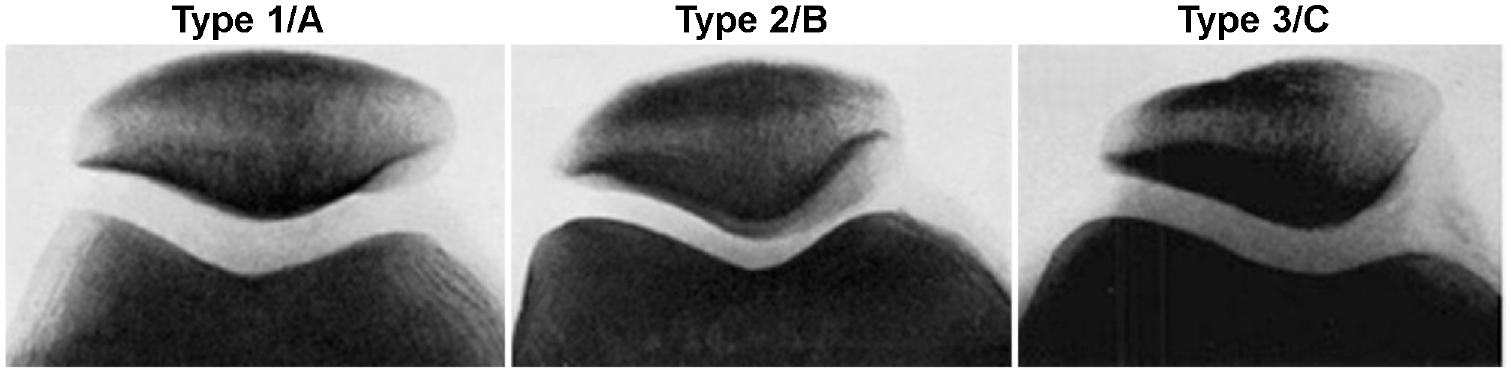
Wiberg patellar classification. Adapted from Wiberg. 29 Images used under CC BY-NC 4.0 licensing terms.
The Caton-Deschamps index (CDI) was calculated as the ratio (A/B) of (A) the distance between the inferior-most portion of articular cartilage and the anterior aspect of the tibial plateau and (B) the superior-to-inferior distance of the articular surface of the patella (Figure 3). 30 A sagittal MRI slice 3.5 to 7 mm (1-2 slices) lateral to the anterior cruciate ligament insertion was used to measure CDI. Trochlear facet asymmetry was calculated as the ratio of the medial trochlear facet length divided by the lateral trochlear facet length at the most proximal axial MRI scan for which articular cartilage exists on both facets anteriorly, as described by Arendt et al (Figure 4A). 3 A larger trochlear facet asymmetry ratio is associated with a relatively larger medial trochlear facet. The bisect offset ratio was calculated as the length of the patella, which lies lateral to the deepest portion of the trochlear groove divided by the medial-to-lateral distance of the patella (Figure 4B). 5 A smaller bisect offset ratio is associated with a patella that is sitting more medially in the trochlear groove.

Caton-Deschamps index (CDI) calculation. CDI = ratio of the distance between the inferior-most portion of articular cartilage and the anterior aspect of the tibial plateau (A) and the superior-to-inferior distance of the articular surface of the patella (B).

(A) Trochlear facet asymmetry calculation: ratio of the medial trochlear facet length (A, dashed line) divided by the lateral trochlear facet length (B, solid line). (B) Bisect offset ratio was calculated as length of the patella, which lies lateral the deepest portion of the trochlear groove (A, dashed line) divided by the medial-to-lateral distance of the patella (B, solid line). White dashed line denotes deepest portion of the trochlear groove.
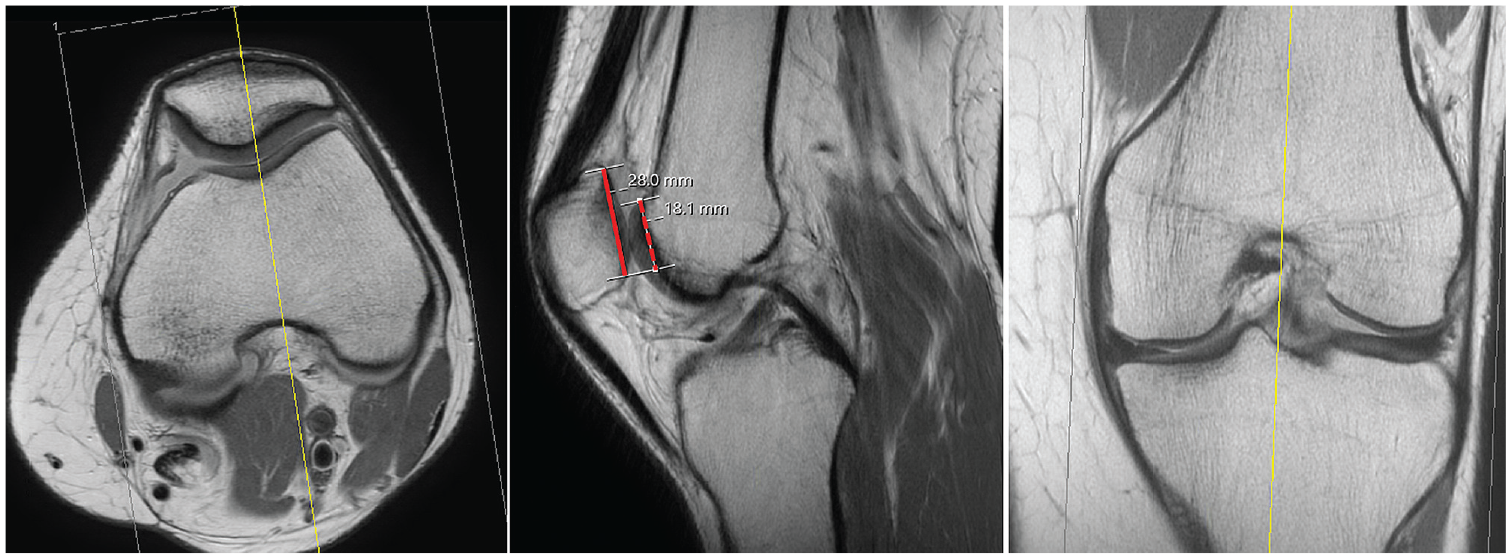
The TT-TG distance was measured (in millimeters) as the medial-to-lateral distance between the midpoint of the patellar tendon just as it begins to come off of the tibial tubercle and the deepest portion of the trochlear groove parallel to the posterior femoral condyles on axial MRI scan (Figure 5A). 1 The tibial tubercle height, also known as the sagittal TT-TG distance, was calculated (in millimeters) as the anterior-to-posterior distance between the midpoint of the patellar tendon as it comes off of the tibial tubercle and the deepest portion of the trochlear groove. 17 Negative values for tibial tubercle height correspond to a tibial tubercle that lies posterior to the trochlear groove (Figure 5B).
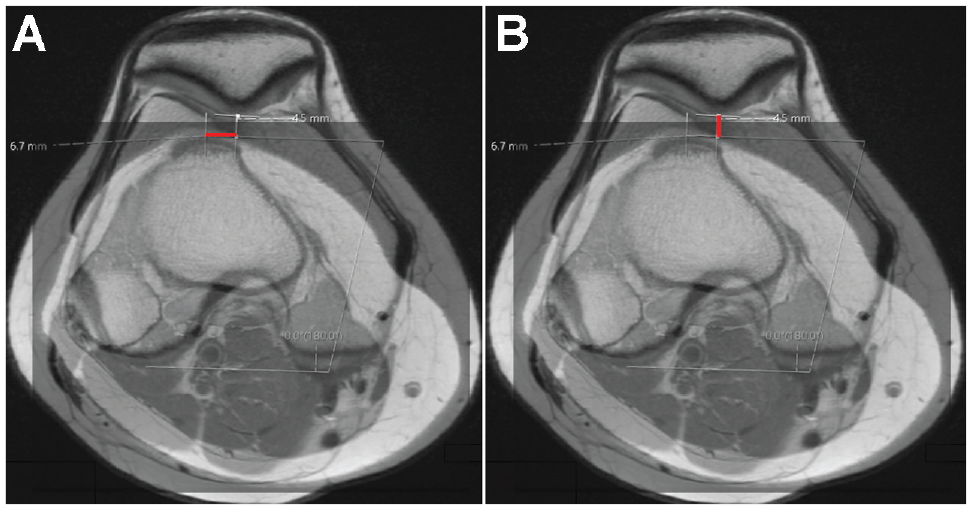
(A) Measuring tibial tubercle-trochlear grove (TT-TG) (millimeters) on axial magnetic resonance imaging (MRI) scan. (B) Measuring the tibial tubercle height (in millimeters) on axial MRI scan. Negative values correspond to a tibial tubercle that lies posterior to the trochlear groove.
The trochlear sulcus depth was calculated as the perpendicular distance between a line connecting the anterior-most aspects of the medial femoral condyle and lateral femoral condyle and the trochlear groove at a position 3 cm proximal to the joint line (Figure 6). 10 Trochlear dysplasia is considered to be a sulcus depth of <3 mm. 22
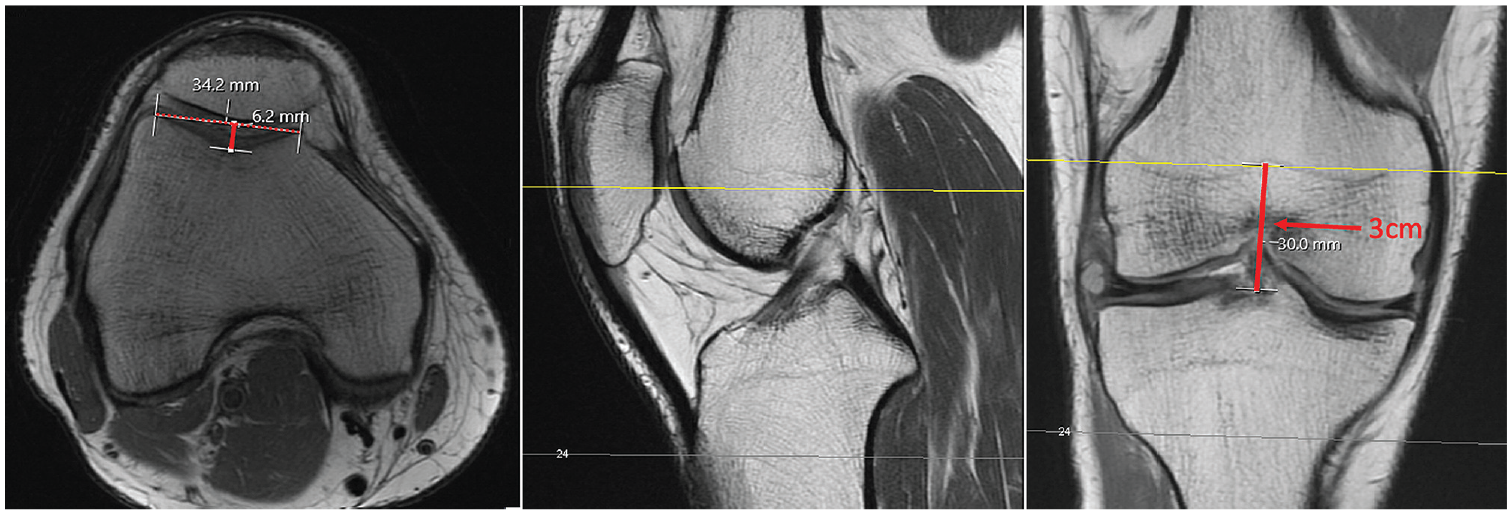
Trochlear sulcus depth was calculated on the magnetic resonance imaging scan as the perpendicular distance (solid red line on axial view on the left) between the anterior-most aspects of the medial femoral condyle and lateral femoral condyle (dashed red line on axial view on the right) and the trochlear groove at a position 3 cm proximal to the joint line. The center image shows a sagittal view with the yellow line indicating the location of the measurement of trochlear sulcus depth.
To calculate the patellotrochlear index, the length of the patella articular cartilage surface is measured on the sagittal MRI sequence that demonstrates the thickest portion of articular cartilage and the greatest length of patella bone is determined. The overlapping articular trochlear cartilage is also measured on the same MRI scan slice. The patellotrochlear index is then calculated as the overlapping trochlear cartilage divided by the patellar cartilage length (Figure 7). 7
Patellotrochlear index was calculated on the sagittal magnetic resonance imaging sequence that demonstrated the thickest portion of the articular cartilage and the greatest length of the patella as the overlapping trochlear articular cartilage (dashed red line in the center image) divided by the length of the patella articular cartilage (solid red line in the center image). The image on the left shows an axial view and the image on the right shows a coronal view, with yellow lines indicating where the patellotrochlear index measurements were taken with respect to those planes.
The proximal-to-distal location of the lesion was performed by identifying the midpoint of the lesion on both axial and sagittal MRI and calculating the distance from the inferior-most aspect of the patellar articular cartilage to the midpoint of the lesion divided by the length of the articular surface (superior-to-inferior) of the patella on the sagittal MRI scan slice that demonstrated the greatest superior-to-inferior length of patellar articular cartilage (Figure 8).

Proximal-to-distal lesion location was calculated on the sagittal magnetic resonance imaging scan slice that demonstrated the greatest superior-to-inferior length of patellar articular cartilage as the distance from the inferior-most aspect of the patellar articular cartilage to the midpoint of the lesion (dashed red line in the center image) divided by the length of the articular surface (superior-to-inferior) of the patella (solid red line in the center image). The left image on the left shows the patellar cartilage defect in an axial view and the image on the right shows a coronal view.
All MRI measurements were performed by a blinded orthopaedic surgery resident (J.S.R.), and a subset of measurements were also performed by a blinded orthopaedic surgery fellow (G.M.P.) to calculate interobserver reliability. Discrepancies were resolved with mean values for continuous variables and consensus for categorical variables.
Statistical Analysis
Data analysis was performed with STATA (Version 17.0; StataCorp). Continuous variables were reported as means and standard deviations, and categorical variables were reported as frequencies and percentages. Variables including asymmetry ratio, tibial tubercle height, TT-TG distance, and CDI were distributed normally per the results of the Shapiro-Wilk test, and unpaired t tests were used to compare mean values between the patients with isolated medial facet lesions and the controls. Age at surgery, bisect offset ratio, and BMI were not distributed normally per the Shapiro-Wilk test, and Wilcoxon rank-sum tests were used for comparison. Chi-square tests were used to compare categorical data between the study groups. One-way analysis of variance testing was used to compare Wiberg type by group. Statistical significance was determined at the P < .05 level. Multivariate regression analysis was performed, including variables that achieved P < .05 in the univariate analysis.
The interobserver reliability of the MRI measurements was calculated as 2-way mixed-effects intraclass correlation coefficient (ICC) values for continuous variables and Cohen kappa (κ) values for categorical variables.
Results
The mean age and BMI of the entire cohort (N = 74) were 32.1 ± 8.4 years and 25.6 ± 5.4 kg/m2, respectively. There were 43 (58%) right knees affected and 46 (62%) female patients (Table 1). There were no significant differences between groups with respect to age, sex, BMI, or laterality (Table 1).
Demographic Characteristics Overall and According to Study Group a
Data are reported as mean ± SD or No. of patients (%). BMI, body mass index.
The interrater reliability of the MRI scan measurements was excellent for tibial tubercle height (ICC = 0.98), proximal-distal lesion size (ICC = 0.92), trochlear asymmetry ratio (ICC = 0.81), and TT-TG distance (ICC = 0.80). 18 ICC values were moderate for bisect ratio (0.68) and CDI (0.62) and fair for medial-lateral lesion size (0.31). The Cohen kappa for discrete variables, including Wiberg patellar type on radiographs, showed moderate agreement between observers (κ = 0.42).
The mean medial facet lesion size was 8.42 ± 3.68 mm in the medial-to-lateral dimension and 8.63 ± 3.04 mm in the proximal-to-distal dimension. The mean proximal-to-distal lesion location along the articular surface was 40% of the distance from the inferior-most aspect of the patellar articular cartilage to the superior-most aspect of the articular cartilage. There was no correlation between proximal-to-distal lesion location and patellotrochlear index (r = −0.18) or CDI (r = −0.0092). Six lesions (16%) were Outerbridge grade 1, 2 (8%) were grade 2, 12 (33%) were grade 3, and 16 (43%) were grade 4.
The majority of patellae were Wiberg type B (26 patients; 72%). There was no difference between the study groups with respect to Wiberg type (P = .29) (Table 2).
Radiographic Characteristics Overall and According to Study Group a
Data are reported as No. of patients (%).
The mean CDI for the cohort was 1.21 ± 0.20, and the mean bisect offset ratios and trochlear asymmetry ratios were 0.56 ± 0.07 and 0.66 ± 0.12, respectively. The mean TT-TG distance was 11.89 ± 4.73 mm, and the mean tibial tubercle height was -1.66 ± 5.73 mm. The mean sulcus depth was 5.66 ± 1.8 mm, and the mean patellotrochlear index was 0.37 ± 0.13. Although there were no differences between groups regarding CDI, TT-TG distance, patellotrochlear index, or sulcus depth (P > .05 for all), the medial facet lesion group had a relatively larger medial trochlear facet (larger trochlear facet asymmetry ratio, 0.72 ± 0.11 vs 0.60 ± 0.09; P < .001), a more medialized patella in the trochlear groove (smaller patellar bisect ratio, 0.55 ± 0.07 vs 0.57 ± 0.06; P = .035), and a more posterior tibial tubercle relative to the trochlear groove (more negative tibial tubercle height, -3.13 ± 5.21 vs -0.23 ± 5.93 mm; P = .030), compared with the control group (Table 3).
MRI Characteristics Overall and According to Study Group a

Data are reported as mean ± SD. Boldface P values indicate statistically significant differences between groups (P < .05). CDI, Caton-Deschamps index; MRI, magnetic resonance imaging.
After multivariate regression analysis, trochlear facet asymmetry and tibial tubercle height were both independent risk factors for medial patellar facet lesions (relative risk [RR] = 97.3 [95% CI, 14.9-635.1], P < .001 and RR = 0.95 [95% CI, 0.92-0.98], P = .004, respectively), and patellar bisect ratio was no longer a risk factor for medial patellar facet lesions (RR = 0.82 [95% CI, 0.01-37.5], P = .92) (Table 4).
Results of Multivariate Regression Analysis a

Boldface P values indicate statistical significance (P < .05).
Discussion
The study findings indicated that an increased trochlear facet asymmetry ratio and a more posterior tibial tubercle relative to the trochlear groove were independent risk factors for atraumatic medial patellar facet lesions. Both of the aforementioned findings likely contribute to exposing the medial patellar facet to overload, which is likely exacerbated through continuous cycling of the patellofemoral joint with ambulation.
We found that a more posterior tibial tubercle relative to trochlear groove was a risk factor for atraumatic medial patellar facet lesions, which is in line with previous investigations that demonstrated an increased risk for patellofemoral chondral lesions in patients with a more posterior tibial tubercle relative to the trochlear groove.16,17 Given the high rates of patellofemoral osteoarthritis following the posteromedializing Hauser procedure, 4 a more posterior tibial tubercle relative to the trochlear groove may be associated with patellar overload, which could explain the preponderance for atraumatic medial patellar facet lesions in patients with a relatively posteriorized tibial tubercle.
Although medial trochlear facet hypoplasia is associated with trochlear dysplasia, 8 and thus patellar instability, 9 the converse (medial trochlear facet hypertrophy) has not been described previously in the literature as a risk factor for medial patellar facet chondral lesions. Previous studies have found that medial patellar facet chondral lesions are associated with poorer outcomes after AMZ TTO,23,24 which could be related to increased medial contact pressures after AMZ TTO in these patients.6,24 Therefore, patellae may experience increased medial facet contact pressures in the setting of a relatively larger medial trochlear facet as is seen in patients with increased trochlear facet asymmetry ratios, which may predispose to the development of atraumatic chondral lesions.
There was a difference in the RR values for the trochlear facet asymmetry ratio and tubercle height, as the trochlear facet asymmetry ratio had a much larger RR than tibial tubercle height in the present study. There are several possible explanations for this finding. It is possible that medial trochlear facet asymmetry, rather than tibial tubercle height, is the driving factor in medial patellar facet overload. Alternatively, our study may be underpowered, and tubercle height may have a greater RR than what was determined in the present study.
Limitations
There are several limitations to this study. This was a time-zero analysis of risk factors for medial patellar facet lesions and does not provide any information regarding patient outcomes after surgical management of these lesions. We also had a relatively small sample size, and therefore, our study may be underpowered. In addition, although the patients in the medial patellar facet group did not report a history of trauma or instability, it is possible that they have experienced subclinical microinstability events that may contribute to the development of these lesions. There is also the theoretical risk of variable knee position impacting tibial tubercle height measurements, as the tibial tubercle moves posteriorly with increasing degrees of extension/hyperextension, which could create a falsely increased posterior tibial tubercle height measurement. In addition, Wiberg type and medial-lateral lesion size had lower ICC values than the remaining variables, although, notably, these variables were not used as inputs to the multivariate regression model. While radiographic coronal varus/valgus alignment could have been impactful, we did not have standing hip-to-ankle radiographs for every patient, so we could not evaluate coronal alignment. Finally, although asymptomatic healthy subjects would have been an ideal control group for the present study, given that this study was retrospective in nature, we did not have access to MRI scans for such a population. Therefore, patients with isolated meniscal pathology were chosen as a surrogate for a control group, as these patients were unlikely to have concomitant patellofemoral pathology. To be certain that the meniscal tear group did not have any concomitant patellofemoral chondral lesions or dysplasia, the MRI scans for each patient were reviewed, and patients with isolated meniscal lesions and evidence of patellofemoral pathology were excluded from the study. Similar studies evaluating patellar chondral lesions have also used patients with isolated meniscal tears as a control group. 17
Conclusion
Atraumatic medial patellar facet lesions were found to be associated with a relatively larger medial trochlear facet and a more posterior tibial tubercle relative to the trochlear groove. Future studies can examine the impact of surgical management, namely anteromedializing versus distalizing tibial tubercle osteotomies, on the natural history of these lesions. Perhaps caution should be exercised when considering an AMZ TTO in these patients given that they already experience medial patellar facet overload, and a concomitant purely anteriorizing TTO should be considered to offload the patella when addressing an atraumatic medial patellar facet chondral lesion, especially in a patient who has both a large medial trochlear facet in the setting of a posteriorized tibial tubercle. Future studies can evaluate the impact of different types of osteotomies, such as a purely anteriorizing versus anteriorizing plus distalizing TTO, on patient outcomes.
Footnotes
Final revision submitted September 25, 2023; accepted October 24, 2023.
One or more of the following authors has declared the following potential conflicts of interest or source of funding: A.H.G. has received consulting fees from Bioventus, Vericel, Smith+Nephew, Flexion Therapeutics, and Joint Restoration Foundation; nonconsulting fees from Linvatec, Pacira Pharmaceuticals, and Vericel; honoraria from Vericel, Fidia Pharma USA, Joint Restoration Foundation, and Engage Uni; and royalty or license from Organogenesis. S.M.S. has received consulting fees from Miach Orthopaedics, Smith+Nephew, and Vericel; nonconsulting fees from Smith+Nephew and Vericel; and honoraria from Vericel and Joint Restoration Foundation. AOSSM checks author disclosures against the Open Payments Database (OPD). AOSSM has not conducted an independent investigation on the OPD and disclaims any liability or responsibility relating thereto.
Ethical approval of this study was obtained from the Hospital for Special Surgery (ref No. 2019-1414).