
Abstract
Background:
Patellofemoral pain is common, and treatment is guided by the presence and grade of chondromalacia.
Purpose:
To evaluate and compare the sensitivity and specificity in detecting and grading chondral abnormalities of the patella between proton density fat suppression (PDFS) and T2 mapping magnetic resonance imaging (MRI).
Study Design:
Cohort study; Level of evidence, 2.
Methods:
A total of 25 patients who underwent MRI of the knee with both a PDFS sequence and T2 mapping and subsequently underwent arthroscopic knee surgery were included. The cartilage surface of the patella was graded on both MRI sequences by 2 independent, blinded radiologists. Cartilage was then graded during arthroscopic surgery by a sports medicine fellowship–trained orthopaedic surgeon. Reliability, sensitivity, specificity, and accuracy were determined for both MRI methods. The findings during arthroscopic surgery were considered the gold standard.
Results:
Intraobserver and interobserver agreement for both PDFS (98.5% and 89.4%, respectively) and T2 mapping (99.4% and 91.3%, respectively) MRI were excellent. For T2 mapping, the sensitivity (61%) and specificity (64%) were comparable, whereas for PDFS there was a lower sensitivity (37%) but higher specificity (81%) in identifying cartilage abnormalities. This resulted in a similar accuracy for PDFS (59%) and T2 mapping (62%).
Conclusion:
Both PDFS and T2 mapping MRI were reliable but only moderately accurate in predicting patellar chondromalacia found during knee arthroscopic surgery.
Keywords
Patellofemoral pain is a complaint frequently evaluated by orthopaedic sports medicine physicians. 22 The appropriate treatment method is based on the cause of the pain. Surgical treatment is usually reserved for those cases in which significant chondral abnormalities are present. 25 However, the symptoms and physical examination findings can be nonspecific and can mimic other abnormalities such as meniscal tears. Magnetic resonance imaging (MRI) can be useful in making the correct diagnosis and guiding treatment. 13,21
Previously, there was consensus that the fat-suppressed gradient-echo sequence was the best method to diagnose patellofemoral chondral injuries. 21 However, it has been shown to have many limitations, such as the long acquisition time and insufficient quality to evaluate cartilage, because of the reconstruction of images from a single plane. 20 Indeed, most standard MRI sequences used have been shown to underestimate both the size and grade of chondral lesions. 5,10
Advances in imaging have allowed researchers to focus on the biochemical composition of articular cartilage. This has led to new MRI techniques to enhance the evaluation of cartilage, such as T1rho, sodium MRI, delayed gadolinium-enhanced MRI of cartilage (dGEMRIC), and T2 mapping. 1,6,11,12,18,19,26 T2 mapping measures the collagen component of the cartilage extracellular matrix by assessing the changing interactions between water and collagen molecules and can detect zonal variations in articular cartilage. 24 T2 maps are influenced by the orientation of collagen molecules and dipole-dipole interaction anisotropy. 23 T2 signals have an inverse relationship with anisotropy, and therefore, the high anisotropy deep layer has a low signal. In contrast, the transitional layer has more disorganization in the collagen matrix and low anisotropy. 9 Disturbance in the collagen structure caused by a cartilage injury or degeneration leads to more free water and an increased T2 signal. 11 The specific advantages of T2 mapping are that it can be performed at conventional field strength, obviates the need for intricate pulse sequences, and has a short scanning time. 11,28 –31
The aim of the present study was to evaluate and compare the sensitivity and specificity in detecting and grading chondral abnormalities of the patella between proton density fat suppression (PDFS) and T2 mapping MRI. It was hypothesized that T2 mapping would result in an increased sensitivity and specificity as compared to PDFS.
Methods
Before the start of this study, institutional review board approval was obtained (proposal No. 20140141). This was a prospective study conducted between 2011 and 2016.
Patients
All patients who underwent MRI of the knee with a PDFS sequence and T2 mapping and subsequently were scheduled for arthroscopic knee surgery were eligible for inclusion in the study. Patients were excluded if they underwent MRI but did not meet the criteria for surgical intervention, if they elected not to proceed with surgery, or if they had a new injury between MRI and the surgical procedure. A total of 25 patients met the inclusion criteria. The mean age was 41 years (range, 14-67 years), and 14 patients (56%) were male. The mean time between MRI and surgery was 6 months (range, 1-42 months). A chart review was performed to ensure that no new injuries had occurred in this time frame.
MRI Protocol
All included patients underwent MRI using the same 1.5-T scanner (Signa LX; GE Medical Systems) with a conventional send-receive extremity coil. PDFS sequences and T2 mapping were performed during the same examination. This was done at no additional cost to the patient and took about 5 to 5.5 minutes of extra scanning time for the patient. The axial cuts were used for both the PDFS and T2 mapping sequences, as the patellar cartilage surface is best visualized on these because of the obliquity of patellar facets. The slice thickness was 4.0 mm, with a 1-mm interspace gap. Table 1 lists the MRI protocols used.
Magnetic Resonance Imaging Protocol Parameters

All MRI scans were evaluated by 2 independent observers, one musculoskeletal radiologist and one musculoskeletal radiology fellow, both blinded to the clinical assessment of the orthopaedic surgeon and that of each other. The PDFS scans were graded based on the modified International Cartilage Repair Society (ICRS) classification: grade 0 indicated normal cartilage, grade 1 indicated superficial fissuring and softening, grade 2 indicated <50% depth to the subchondral plate, grade 3 indicated >50% depth to the subchondral plate, and grade 4 indicated penetration into the subchondral plate. The T2 mapping scoring system assessed 3 areas of the patella: medial, apex, and lateral. Grading was based on the amount of cartilage involvement as indicated by the color map. Normal was characterized by mostly red and a little yellow, mild chondromalacia was mostly yellow and some red, moderate was mostly yellow and some green, and severe was mostly green and some blue (Figures 1 -3).

Example of axial magnetic resonance imaging of a normal patella of a right knee with (A) T2 mapping and (B) a proton density fat suppression sequence. Normal cartilage is characterized by mostly red and a little yellow.
Example of axial magnetic resonance imaging of a patella with chondromalacia of a left knee with (A) T2 mapping and (B) a proton density fat suppression (PDFS) sequence. Mild chondromalacia was mostly yellow and some red, moderate was mostly yellow and some green, and severe was mostly green and some blue. In this example, there is agreement between the appearance of the cartilage surface on the T2 map and PDFS sequence.

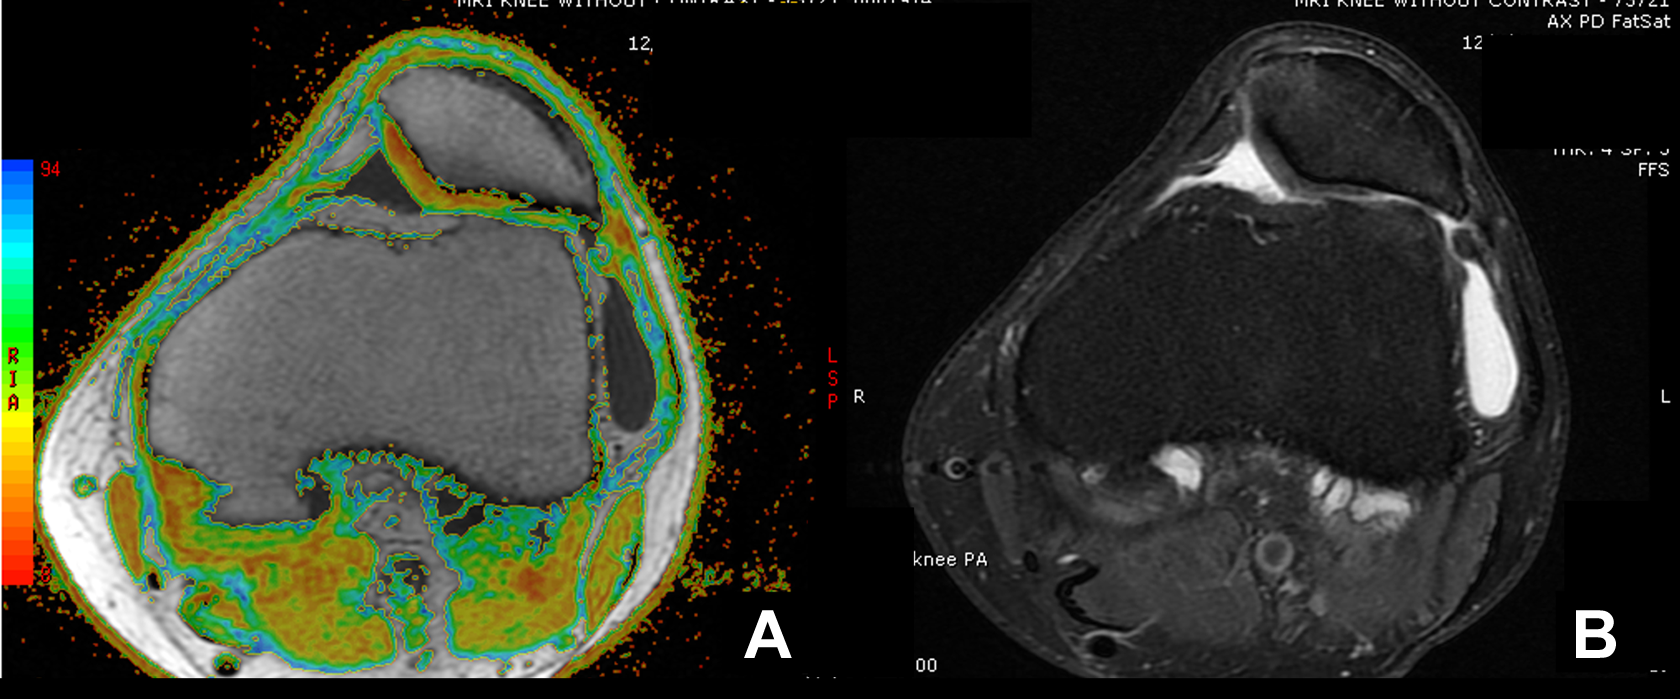
Example of axial magnetic resonance imaging of a patella with chondromalacia of a right knee with (A) T2 mapping and (B) a proton density fat suppression (PDFS) sequence. Mild chondromalacia was mostly yellow and some red, moderate was mostly yellow and some green, and severe was mostly green and some blue. In this example, there is an abnormality on both the T2 map and PDFS sequence. However, the T2 map’s color-coded image demonstrates a more homogeneous area of significant chondral degeneration, whereas the PDFS image demonstrates a heterogeneous segment of chondral hyperintensity with fibrillation. Although both sequences show the area of involvement, this is more readily apparent with T2 mapping. On the PDFS image, abnormal cartilage is somewhat similar in density and thickness to the more normal peripheral cartilage but is clearly involved with degeneration when looking at the T2 map’s color coding.
Arthroscopic Procedure
All arthroscopic procedures were performed by a single sports medicine fellowship–trained orthopaedic surgeon. The surgeon was able to view the standard MRI scans to prepare for surgery but was blinded to the T2 map and the readings from the 2 independent radiologists involved in the study. Standard anterolateral and anteromedial portals were used, and the cartilage surface of the patella was viewed and probed through both portals in all patients. The same 3 areas as evaluated on MRI (medial, apex, and lateral) were scored using the Outerbridge classification. 4
Statistical Analysis
Intraobserver and interobserver agreement were determined for the MRI evaluations and expressed as percentages of the component of variance analysis. Sensitivity, specificity, positive predictive value, negative predictive value, and accuracy of PDFS and T2 mapping were calculated. This was done by dichotomizing all ICRS-graded MRI findings as either positive (grades 2-4) or negative (grades 0-1) as well as dichotomizing all arthroscopic Outerbridge-classified results as either positive (grades 2-4) or negative (grades 0-1) for cartilage abnormalities . The arthroscopic evaluation by the surgeon was used as the gold standard.
Results
Intraobserver reliability was 98.5% for PDFS and 99.4% for T2 mapping. Interobserver reliability was 89.4% for PDFS and 91.3% for T2 mapping. The sensitivity, specificity, positive predictive value, negative predictive value, and accuracy of PDFS and T2 mapping for detecting cartilage abnormalities can be found in Table 2.
Sensitivity, Specificity, Positive Predictive Value, Negative Predictive Value, and Accuracy of PDFS and T2 Mapping MRI a

a MRI, magnetic resonance imaging; PDFS, proton density fat suppression.
Discussion
The primary aim of the present study was to evaluate and compare the sensitivity and specificity in detecting and grading chondral abnormalities of the patella between PDFS and T2 mapping MRI. The most important finding was that for T2 mapping, sensitivity and specificity were similar in magnitude, whereas for PDFS there was a lower sensitivity but higher specificity. Combined, this led to a comparable moderate degree of accuracy for both methods. The intraobserver and interobserver agreement for both PDFS and T2 mapping MRI were excellent.
These findings are consistent with the existing literature. Various in vitro studies have been performed to assess the relationship between T2 mapping and cartilage lesions. 2 Although T2 mapping has been shown to be correlated to the integrity of the collagen matrix, this relationship may be confounded by other variables. 2 A study on rat patellar cartilage by Watrin-Pinzano et al 27 examined the influence of proteoglycan content. They induced proteoglycan loss by inducing hyaluronidase degradation, which did not affect collagen and showed a significantly higher T2 signal. 2,3,15
With regard to in vivo studies, Mosher et al 17 showed that anisotropy may not be the only determinant of T2 heterogeneity, especially in joint surfaces with a high curvature of articular cartilage. Similarly, other authors have shown that variations in the anatomic location of cartilage influence T2 mapping. 8 Lastly, T2 values can be confounded by patient age. 7,16 Indeed, in the present study, there was a large variation in the age of the included patients, from 14 to 67 years.
The solution to increasing the accuracy of MRI may be to use PDFS sequences and T2 mapping to complement each other. Kijowski et al 12 demonstrated that adding T2 mapping sequences to routine MRI protocols improved sensitivity in the detection of cartilage lesions within the knee joint from 74.6% to 88.9%, with only a small reduction in specificity. However, in their study, a 3.0-T scanner was used, in contrast to the 1.5-T scanner in the present study. Since the acquisition of data in the present study, a 3.0-T scanner has also been used at our institution. Although the signal-to-noise ratio of the 3.0-T scans is slightly better than that of the 1.5-T scans, the contrast in the images is not perceptibly better. Indeed, previous studies have only shown mild improvement in the detection of cartilage lesions at 3.0 T versus imaging at 1.5 T using standard MRI acquisition parameters. 14 It is therefore not likely that the findings of the present study would have been qualitatively different if patients had been imaged at 3.0 T, but it is possible that the quantitative correlations would have been improved.
This study does have limitations. It consisted of a small cohort of patients. The surgeon, although blinded to the readings of the radiologists in the study, was able to view the routine MRI scans as to not compromise patient care. Lastly, arthroscopic surgery was used as the gold standard; however, it may be limited to evaluating structural problems and may miss isolated biochemical damage.
The topic of this study is clinically relevant. Surgical options for cartilage restoration are expanding. Treatment options largely depend on the character, size, and depth of a lesion. 10 For example, patients with a well-defined cartilage defect may be excellent candidates for a cartilage restoration procedure, whereas those with ill-defined large zones in an injury are not. These patients may be best suited for nonoperative treatment with viscosupplementation or surgical management with chondroplasty. There is an increasing demand for an accurate, reproducible, noninvasive method to assess the type of cartilage lesion. It has been shown that conventional MRI may underestimate the size of a lesion, with the defect after debridement being 377% larger than predicted. 10 Adding T2 mapping to standard PDFS sequences may help identify both the area of full-thickness damage as well as the surrounding zone of severely fissured, softened, or delaminated cartilage that will also need to be considered in deciding treatment.
In conclusion, PDFS and T2 mapping MRI were both reliable, but in isolation, they were only moderately accurate in predicting patellar chondromalacia found during knee arthroscopic surgery.
Footnotes
Acknowledgment
The authors acknowledge Timothy M. Bert, MD, Adam D. Bier, MD, and Pratima Karia, MD, for their help with data collection.
The authors declared that they have no conflicts of interest in the authorship and publication of this contribution.
Ethical approval for this study was obtained from the Western Institutional Review Board (proposal No. 20140141).