
Abstract
The incidence of osteochondral lesions, as well as osteoarthritis of the ankle joint following osteochondritis dissecans and trauma, has been reappraised in recent years. Consequently, an increasing number of surgical interventions using different cartilage repair techniques is performed in the ankle joint, which has resulted in a growing demand for repetitive and objective assessment of cartilage tissue and its repair. While morphological imaging does enable monitoring of macroscopic changes with increasing precision, it fails to provide information about the ultrastructural composition of cartilage. The significance of molecular changes in cartilage matrix composition, however, is increasingly recognized, as it is assumed that macroscopic cartilage degeneration is preceded by a loss in glycosaminoglycans and a disorganization of the collagen network. Recent advances in biochemical magnetic resonance imaging (MRI) have yielded sequences sensitive to these changes, thus providing invaluable insight into both early cartilage degeneration and maturation of repair tissue, on a molecular level. The aim of this review was to provide a comprehensive overview of these techniques, including water and collagen-sensitive T2/T2* mapping, as well as glycosaminoglycan-sensitive sequences such as delayed gadolinium-enhanced MRI of cartilage dGEMRIC, and sodium imaging, and describe their applications for the ankle joint.
Background
Osteoarthritis (OA) is a frequent source of disability and pain, affecting about 12% of the US population aged 25 to 74 years at one or more joints. 1 While the knee and hip joint are predominantly affected by primary osteoarthritis, only 7% to 9%2,3 of ankle OA cases can be attributed to this pathogenesis. This discrepancy is explained by different joint anatomy and biomechanics, as well as differences in chondrocyte properties inherent to the articular cartilage of the respective joints. 4 As a result, articular cartilage of the ankle joint is deemed to have a higher intrinsic regenerative potential than knee cartilage.5,6 At the same time, the ankle joint seems susceptible to osteochondritis dissecans and trauma, with successive development of posttraumatic osteoarthritis. Despite the higher intrinsic regenerative potential of ankle cartilage compared to that of knee cartilage, these lesions frequently require surgical treatment. 7
There is a number of different cartilage repair techniques for treating osteochondral or chondral lesions of the ankle joint, which are aiming for defect filling and stabilization of adjacent cartilage regions. Depending on the patient’s age and defect size, microfracturing (MFX), 8 mosaicplasty, 9 (matrix-associated) 10 autologous chondrocyte transplantation ((M)ACT), 11 and newer techniques using bone marrow–derived cell transplantation 12 may be performed.
The ability to assess and monitor the quality of cartilage (repair tissue) in vivo is pivotal for 2 reasons. Timely diagnosis of changes in cartilage composition indicative of early-onset OA would be a prerequisite for the initiation of OA therapy. Second, with the variety of treatment options available, meticulous examination of their outcomes is paramount particularly because it has been shown that the molecular composition of repair tissue (RT) affects long-term clinical outcome, with hyaline-like RT yielding better results than fibrocartilage-like RT. 13 However, in most cases, the gold standard of histological assessment is not feasible due to its invasiveness and associated morbidity. Recent advances in magnetic resonance imaging (MRI) have resulted in the development of sequences that now meet the need for noninvasive cartilage assessment, also in the ankle joint.
Morphological Magnetic Resonance Imaging
In general, morphological MRI is a highly valuable modality for the assessment of cartilage lesions and degeneration. MRI of ankle cartilage, however, is particularly challenging due to the highly congruent articular surfaces, 14 the curvature, and (compared to the knee) the relatively thin cartilage layers. 15 This combination of curvature and thin cartilage layers, for which Millington et al. 14 found values of 1.1 ± 0.18 mm for talar and 1.16 ± 0.14 mm for tibial cartilage, contribute to partial volume effects. Moving to higher field strengths appears to be very promising in addressing this issue, as the higher signal-to-noise-ratio can be traded for increased spatial resolution. As mentioned before, the development of innovative cartilage repair techniques generated a strong demand for an objective and reproducible assessment of the composition and quality of cartilage RT. The introduction of the magnetic resonance observation of cartilage repair tissue (MOCART) score 16 marked a milestone by enabling semiquantitative assessment of cartilage RT. Its wide acceptance and use in the orthopedic community demonstrate its value. Initially designed for the knee joint, the MOCART score recently has been applied to the ankle joint.17,18 However, the MOCART score cannot fully account for the different nature of lesions in the ankle joint. Compared with the knee joint, osteochondral lesions comprise a higher percentage of all defects in the ankle. The etiology of these lesions is often osteochondritis dissecans, which inherently compromises the integrity of the subchondral lamina. Hence, different cartilage repair techniques cannot result in a different outcome with regard to this variable, and the assessment of its integrity—as mandated in the MOCART score—is of limited relevance. Another criterion of the MOCART score is the presence or absence of adhesions. Although adhesions play an important role in the knee joint, several studies revealed them to be insignificant in the ankle joint.18,19 However, subchondral cysts or bone marrow edema might play a more prominent role as a more frequent source of pain in the ankle joint. Therefore, it is currently under discussion whether an adaption of the MOCART score for the ankle joint might be of additional value.
Another morphological score, which has been recently established for the assessment of osteochondral allograft transplantation, is the Osteochondral Allograft MRI Scoring System (OCAMRISS). 20 This scoring system features strong interobserver agreement and correlated well with clinical outcome. 21 While initially developed for the knee joint, it might also have the potential to monitor osteochondral transplants in the ankle joint.
Although morphological MRI does allow for the evaluation of macroscopic structural changes of cartilage and in conjunction with the MOCART score that of cartilage RT, its biochemical composition remains elusive.
Biochemical Magnetic Resonance Imaging
The underlying idea of biochemical MRI is to enable the quantification of molecular biomarkers in vivo and to use them as hallmarks for disease diagnosis and progression. The assessment of 2 key constituents of cartilage—collagen and glycosaminoglycans (GAGs)—is of particular interest in this regard, as they are integral to proper cartilage homeostasis and function. Notably, the early stages of cartilage degeneration are assumed to accompany a decrease in GAG content and disorganization, as well as loss of collagen fibers.6,22 Special emphasis must be placed on the assessment of GAG content, as it has also been shown to significantly correlate with biomechanical cartilage properties, predominantly compressive stiffness. 23 In the evaluation of RT after cartilage repair, the quantification of these 2 matrix components is also of key importance, as the main difference between desired “hyaline-like” cartilage and unwanted “fibrocartilage-like” RT manifests as differences in collagen orientation and GAG content. 24
For the assessment of water content and of the collagen network—content as well as fiber orientation—T2-mapping and T2*-mapping have been successfully introduced for the ankle joint. Delayed gadolinium-enhanced MRI of cartilage (dGEMRIC) and sodium imaging 25 have been employed for the evaluation of the GAG content in the ankle joint. Two additional techniques (T1rho and gagCEST [short for glycosaminoglycan chemical exchange saturation transfer]) have been proposed for the evaluation of GAG content; however, neither of those has been applied to the ankle joint as yet. There are several articles that have reported promising initial data on gagCEST, but its performance in thin cartilage structures, such as those of the ankle joint, still awaits investigation.
T2-Mapping
T2-weighted images are commonly known from routine morphological imaging. They are optimized to provide maximal contrast between the structures of interest. This optimization is performed by carefully setting the echo time in such a way as to maximize the difference in signal intensities between 2 structures of interest. To yield optimal contrast; however, a prior estimate of T2 values of the structures of interest is useful.
T2-mapping relies on the measurement of T2-weighted images as well, but takes a different approach, to provide more specific information. From a T2-map, a time constant of the signal decay (T2 relaxation time) of a given structure may be quantified. To achieve this, a series of individual T2-weighted images with increasing echo times can be acquired, for example, in a standard multi-echo spin-echo (MESE) sequence. T2 values in cartilage are influenced by the amount and degree of the interaction between water molecules and biomacromolecules, particularly collagen fibers. The adequate selection of the number of echoes, as well as echo times, is crucial. Normally, the shortest possible echo time is sought for the first echo, while the longest echo time should not exceed a certain cutoff, after which predominantly noise would be collected, which would artificially prolong T2 values. Subsequently, a fitting procedure is applied, which calculates the time constant of exponential signal decay for each voxel independently. Altogether, these voxels comprise the resulting T2-map. The first echo however, is excluded from this procedure, as it is not stimulated by previous echoes.
The aforementioned interaction between free water and collagen fibrils also gives rise to a complication in the T2-mapping approach, the magic angle effect. T2 relaxation times increase when collagen fibrils in cartilage are at an angle of about 55° relative to the direction of the B0 field.26,27 This effect must be considered during the evaluation of T2-maps.
Healthy hyaline cartilage is characterized by a zonal anatomy, resulting from a distinct organization of collagen fibrils. T2-mapping reflects this zonal compositional variation, as well as a moderate zonal difference in water content, 22 by an increase of T2 values from the deep layers to the more superficial layers. 28 In fibrocartilage, however, this pattern is lost. Moreover, White at al. 24 were able to demonstrate, through histological validation in equine subjects, that zonal evaluation of quantitative T2-mapping can be used to differentiate between hyaline-like and fibrocartilage-like RT after cartilage repair. In addition, based on their findings, they conjectured that MFX yielded inferior RT quality compared to MACT. Consequently, T2-mapping has been successfully employed for the evaluation of RT quality, after different repair techniques in human subjects in vivo by Welsch et al. 29 Similar to the study by White et al., 24 RT after MFX lacked a zonal increase in T2 values. RT after MACT, however, showed significant zonal variation, indicating a distinct organization of the collagen network as a surrogate for hyaline-like cartilage. After the first T2-mapping studies, which focused on larger joints, T2-mapping was soon extended to the ankle joint.
As already discussed for morphological imaging, the anatomical properties of the talocrural cartilage are particularly challenging. Nonetheless, Welsch et al. 30 demonstrated promising results in a feasibility study on healthy volunteers at 3 T. Using a dedicated ankle coil and an MESE T2 approach, excellent image quality and reproducibility were achieved within a clinically tolerable measurement time of 9:49 minutes. Subsequently, many studies employed T2-mapping for the noninvasive evaluation of alternative cartilage repair techniques. Giannini et al. 31 were the first to investigate autologous chondrocyte implantation (ACI) in the ankle joint in a case series of six patients after a 10-year follow-up. The patients experienced excellent clinical outcomes, as reflected by an increase in the American Orthopedic Foot and Ankle (AOFAS) score from 37.9 ± 17.9 points preoperatively to 92.7 ± 9.9 points at the 10-year follow-up. Furthermore, T2-mapping demonstrated similar values for RT (46 ms; range, 34-50 ms) and for healthy reference cartilage (40 ms; range, 30-50 ms). This corresponds well to their findings of second-look arthroscopies and biopsies, which were performed 15 months after surgery, during hardware removal, and demonstrated hyaline-like cartilage repair tissue.
Successive larger studies32,33 on (M)ACT in the ankle joint corroborated these initial findings ( Fig. 1 ). 32 Domayer et al., 34 Tao et al., 35 as well as Becher et al., 36 investigated RT after MFX and, surprisingly, unanimously reported no significant difference in global T2 between RT and adjacent healthy reference cartilage—in contradiction to, what has previously been observed in the knee joint.
T2-mapping of a patient after matrix associated chondrocyte transplantation (MACT) of the talus at 3 T: morphological proton density-weighted image (
However, all these studies were performed at 3 T and had to go without the assessment of zonal variation of T2 values, due to insufficient spatial resolution. As a remedy, Domayer et al. 37 moved to an ultra-high field (7 T) system. By trading the gain in signal-to-noise-ratio for increased spatial resolution, zonal cartilage assessment in the ankle joint became possible for the first time ( Fig. 2 ). 37 Ten asymptomatic volunteer cases with an AOFAS score of 100, along with ten cases after MACT and MFX, were included in the study. The mean follow-up after MACT was 65.4 months, compared to 113.8 months after MFX. The morphological outcome, as well as the AOFAS score, showed no significant differences at follow-up. As expected, a significant zonal increase in T2 values was observed in the healthy volunteers from the deep to the superficial cartilage layers (21.1 ± 3.1 vs. 39.3 ± 5.9 ms, P < 0.001). Both techniques yielded RT with a significant zonal variation of T2 values (MFX, P = 0.009; MACT, P = 0.003). In addition, there was no difference between RT after MFX and MACT with regard to superficial (P = 0.796) or deep (P = 0.507) T2 values. When comparing the respective RTs with healthy reference cartilage, however, both techniques exhibited significantly increased T2 values in the deep layer (MFX, P = 0.004; MACT, P = 0.001), which resulted in significant differences in global T2 values (MFX, P = 0.025; MACT, P = 0.015). These results reinforce the findings of previous studies on MFX in the ankle joint by directly comparing it with MACT for the first time, and indicate that both techniques yield RTs of similar structure in the ankle joint.
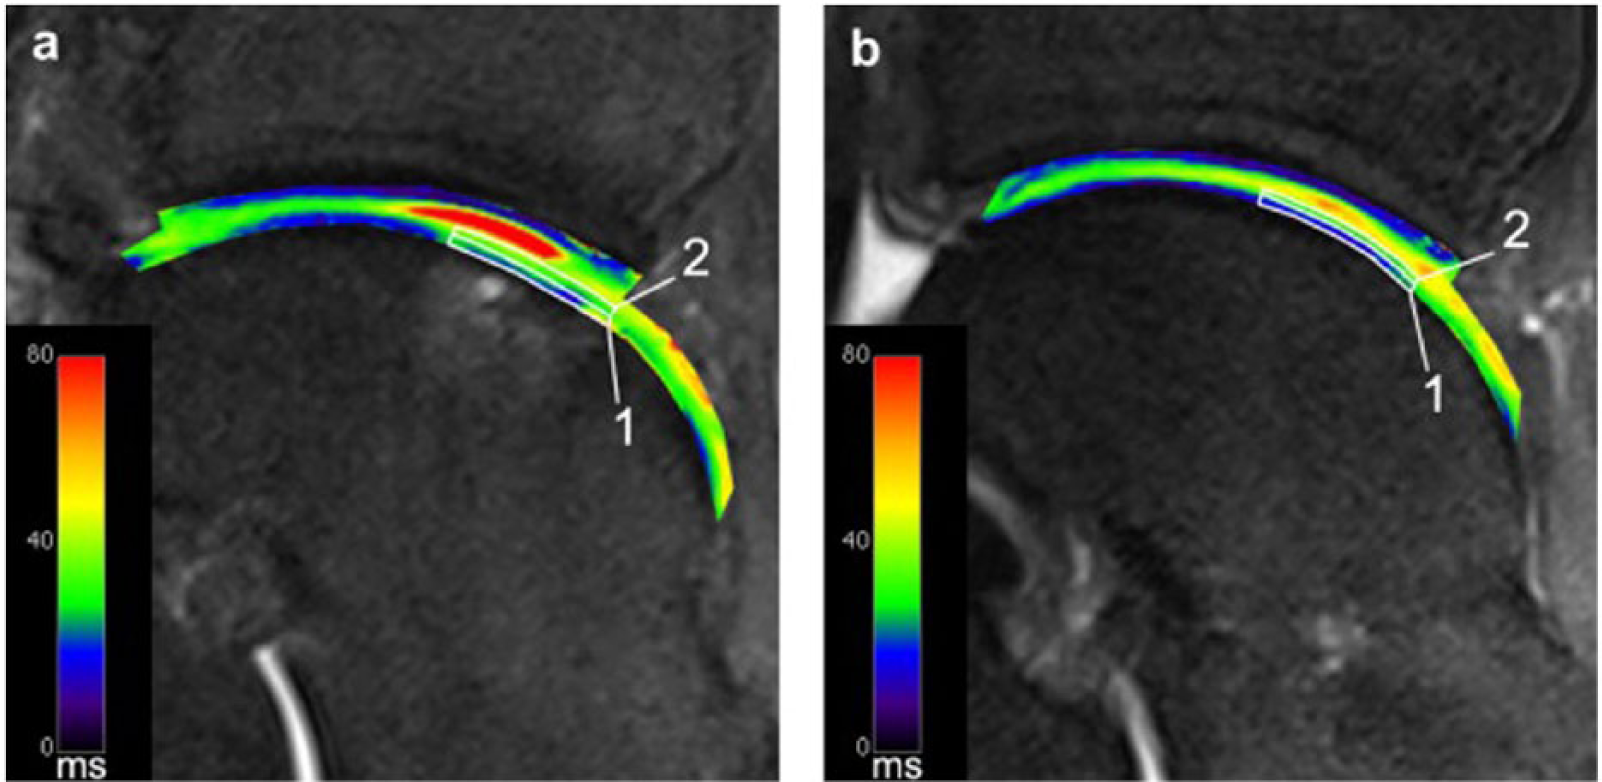
T2-mapping of a patient after matrix-associated chondrocyte transplantation (MACT) of the talus at 7 T. Sufficient spatial resolution to allow for zonal cartilage evaluation is demonstrated. Image (
Moving to 7 T provided sufficient spatial resolution to allow for zonal cartilage evaluation. However, with increasing field strengths, the specific absorption rate (SAR) limits image acquisition times for standard MESE sequences. As an unfavorable countermeasure, the number of acquired slices must be reduced in order to achieve a clinically tolerable scan time.
Alternatively, a recently developed T2-mapping sequence, 3-dimensional (3D) triple-echo steady-state (3D-TESS) 38 may be used. 3D-TESS uses a different approach than standard MESE sequences. Three images with the same echo time, but different relaxation times, are acquired, causing different T1- and T2-weighting. 38 These images are then used to calculate the T2 map by iterations. In that way, 3D-TESS may also be used to calculate a T1-map. However, it is fundamental to the principle of 3D-TESS that the relaxation times used are significantly shorter than the T2 of the investigated tissue. In the knee, 3D-TESS demonstrated a similar performance with respect to a standard MESE sequence, while providing significant advantages, such as shortening of acquisition time and insensitivity to B0 and B1 changes. 39 Future studies are needed to evaluate the potential of this new technique in the ankle joint.
T2*-Mapping
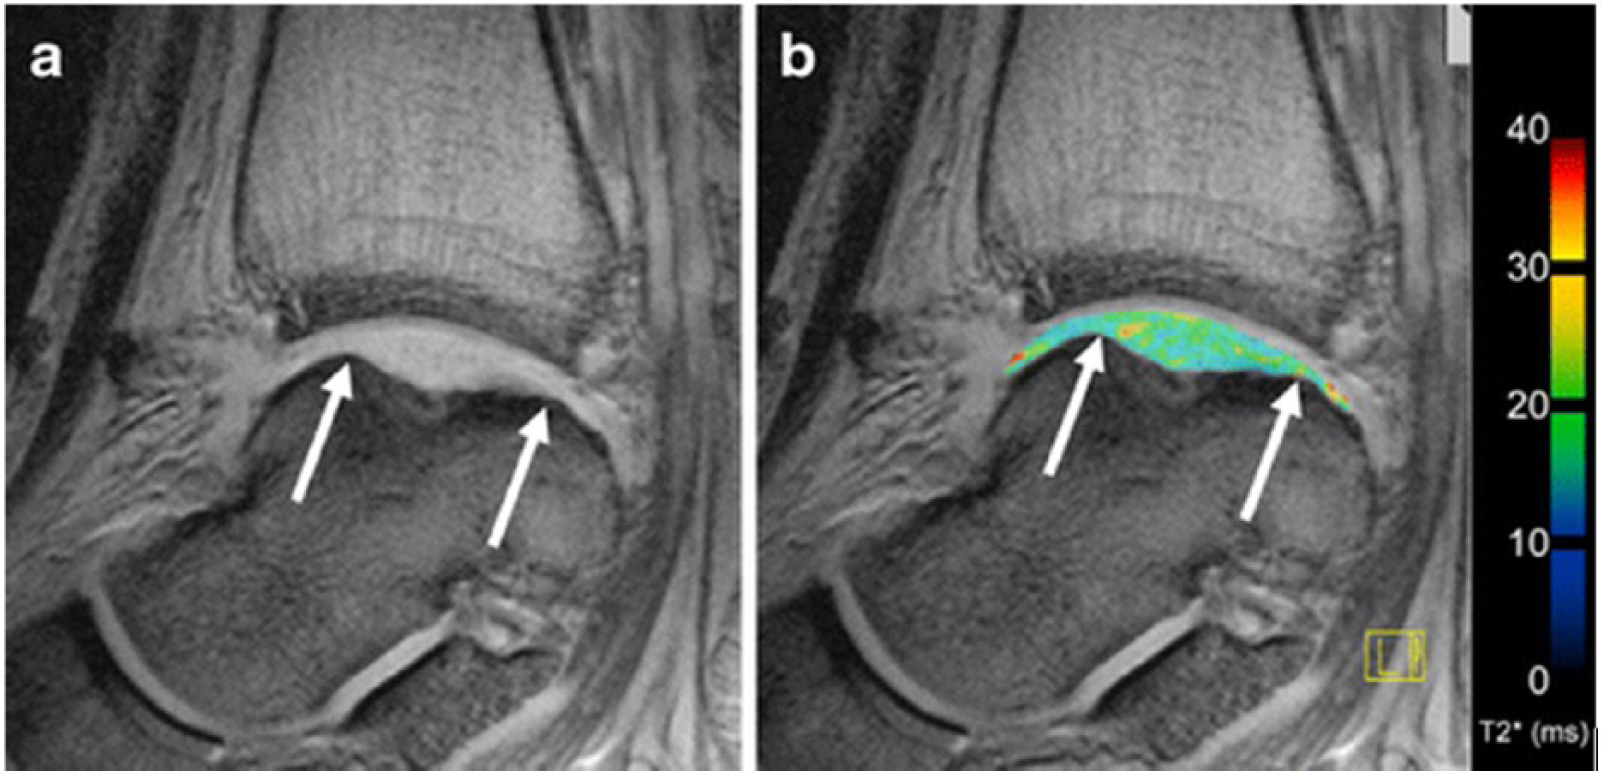
Another alternative to address the problem of SAR limits at ultra-high fields is the use of a different imaging approach, namely T2*-mapping. Upon its introduction, T2* relaxation time measurements have been proposed as an alternative biomarker for the biochemical assessment of articular cartilage, in addition to T2 relaxation time measurements. As opposed to quantitative T2-mapping, T2*-mapping is obtained with a multigradient-recalled echo (GRE) sequence. This highlights its key advantages over T2-mapping based on an MESE sequence: shorter acquisition times, lower SAR as well as the ability to obtain 3D measurements. The different sequence design also explains the main differences between the 2 approaches. T2* comprises information about the field inhomogeneity on a molecular level and also on a macroscopic (pixel size) level. The relative contribution of both effects is hard to assess and may vary. Generally speaking, the shorter the T2 values of a given structure, the smaller the contribution at the macroscopic level. Hence, T2-mapping and T2*-mapping will yield similar relaxation times for tissues with short T2 relaxation times, such as cartilage, as demonstrated by Welsch et al. 40 in the evaluation of RT at 7 T. A study that used T2-mapping ( Fig. 3 ) 19 and T2*-mapping ( Fig. 4 ) 19 for the evaluation of MACT in the ankle joint came to a similar conclusion. 19 It is worth noting that both studies reported consistently lower relaxation times for T2*-mapping, which is an expected feature of the applied GRE sequence in T2*-mapping.
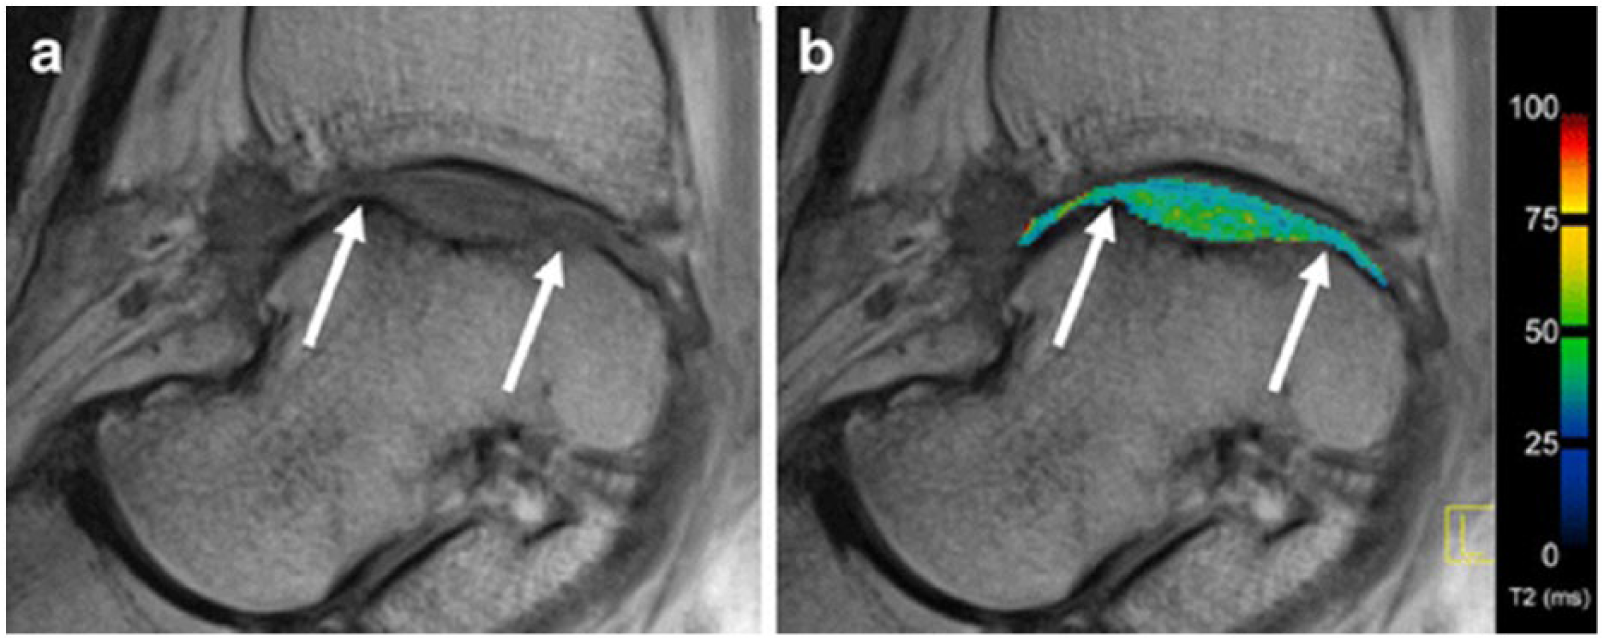
T2-mapping depicting the ankle joint of a patient after matrix-associated autologous chondrocyte transplantation (MACT) in sagittal orientation: on the left displayed in grayscale using the shortest echo time (
Krause et al. 41 investigated the ability of T2*-mapping as a marker of early osteoarthrosis in pes cavovarus, a foot deformity, which alters biomechanics and consequently increases the risk of cartilage degeneration in the ankle joint. Whereas T2* values in the talocrural joint of symptomatic cavovarus patients differed significantly from asymptomatic cavovarus patients, as well as from healthy volunteers, no difference between asymptomatic cavovarus patients and healthy volunteers could be observed.
Subsequently, T2*-mapping was applied to investigate the effect of ultra-long-distance running on ankle cartilage by repeated examination, in a mobile 1.5 T MRI, of participants of the TransEurope FootRace (TEFR). 42 While morphological imaging indicated stable cartilage conditions over the entire race, an analysis of T2* values demonstrated an initial increase (25.6% on average) during the first 2000 km. Surprisingly, this was followed by a decrease in T2* relaxation times of 6% to 10% for runners who continued after 2500 km, indicating the ability of ankle cartilage to partially adapt to an ongoing ultramarathon burden.
These studies already demonstrated the wide applicability of T2*-mapping, including its distinct advantages over T2-mapping. As mentioned before, in T2-mapping, zonal variation analysis was established as a valuable evaluation method that enabled differentiation between healthy cartilage and cartilage with incipient matrix disorganization. At 7 T, zonal variation analysis could even be successfully used in the ankle joint. In GRE-based T2*-mapping, however, the interface between cartilage and cortical bone may yield very low T2* values due to macroscopic susceptibility effects. 40 This can cause the illusion of zonal variation even in defect regions, which would lack zonal differences on T2-maps. Therefore, zonal variation analysis should not be performed in T2* images. Instead, evaluation should be limited to the assessment of the global cartilage layer. In addition, the indication for T2*-mapping in the postoperative assessment of patients should be approached cautiously, as susceptibility artifacts from metalwork may significantly impair the quality of the T2* measurements.
dGEMRIC
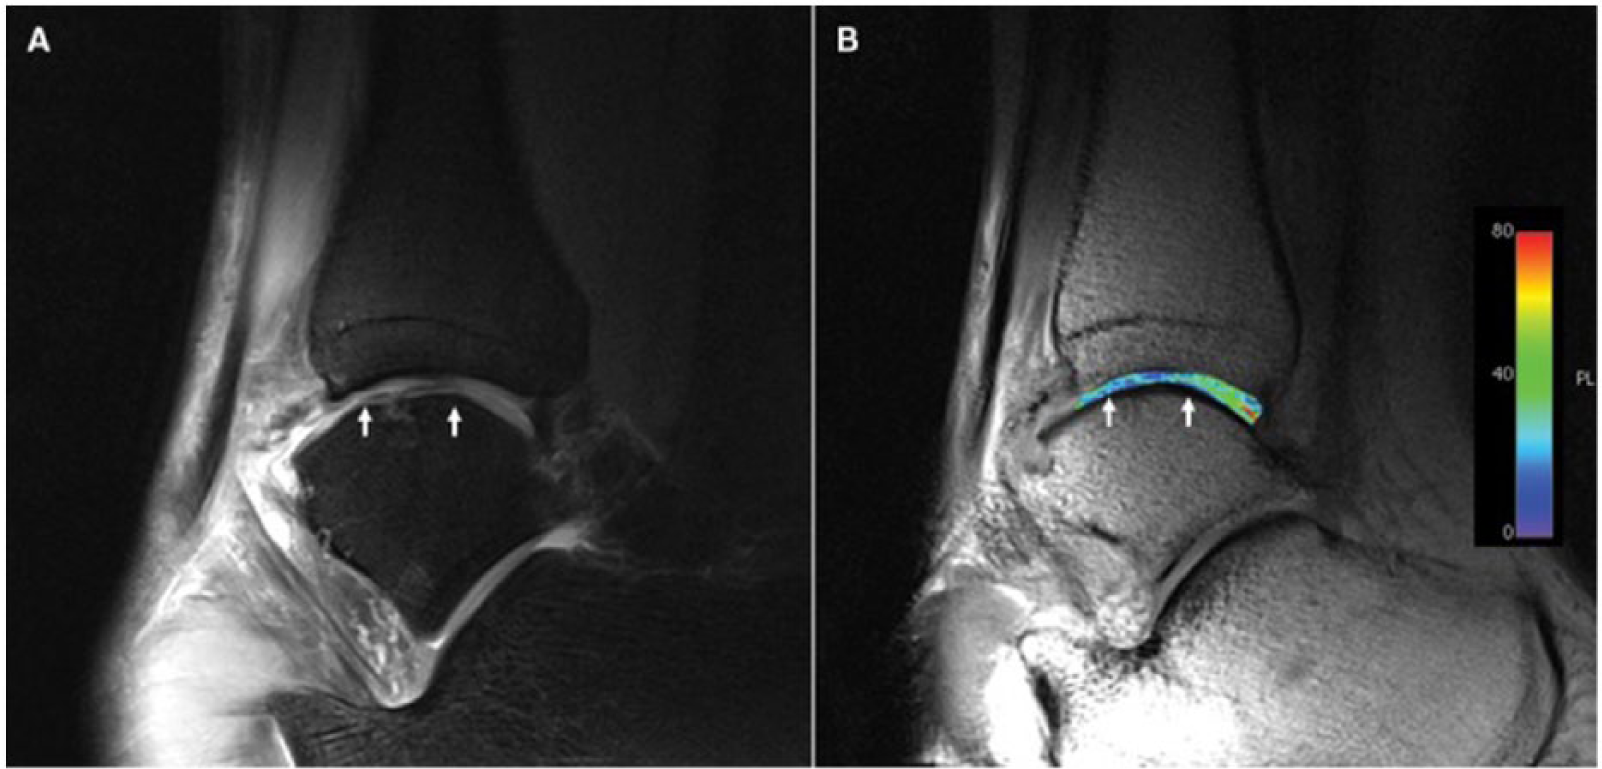
The dGEMRIC technique relies on the equilibration of gadolinium diethylenetriamine penta-acetic acid (Gd-DTPA−) throughout the cartilage. In the majority of cases this is achieved by intravenous administration of this negatively charged contrast agent prior to MRI. After administration, Gd-DTPA2− diffuses into cartilage and distributes in an inversely proportional manner to the negative charge density, which is dominated by the negatively charged GAGs present in cartilage. 43 In healthy cartilage the negative charge of the GAG molecules counteracts the diffusion of the negatively charged contrast agent molecules. With a focal loss of GAG, more contrast agent molecules can accumulate, thus reducing the T1 relaxation times in a concentration dependent manner. This allows for the specific evaluation and quantification of GAG content, as demonstrated in several studies.44,45 To ensure sufficient penetration of articular cartilage, a certain time-interval must be maintained between the administration of contrast agent and MRI. Additionally the patient should repetitively load and unload the joint in the meantime. This interval, which is responsible for the attribute “delayed” in dGEMRIC has to be adapted for different joints, in the ankle joint being optimal around 45 minutes. 46 The evaluation of GAG content may be based on the dGEMRIC index (T1(Gd)), which is the mean T1 in a confined region of interest (ROI) at a certain time point after contrast media administration. 47 For studies designed to evaluate cartilage RT, the relative delta relaxation rate (rΔR1) might be useful, as published by Watanabe et al. 48 The delta relaxation rate (ΔR1) is defined as the difference between postcontrast relaxation rate (R1post = 1/T1post) and precontrast relaxation rate (R1pre = 1/T1pre). The aforementioned relative delta relaxation rate is the ΔR1 of RT divided by the ΔR1 of healthy reference cartilage, and has been shown to correlate well with biochemically assessed GAG content in RT. 48 While healthy cartilage is expected to yield an rΔR1 of approximately 1, higher values would go along with a decrease in GAG content of the RT. However, many confounding variables, such as cartilage thickness, contrast dose, T1-specific imaging protocols as well as the time interval between contrast media administration and imaging, influence T1(Gd). Therefore, exact standardization of the study protocol is a fundamental prerequisite to yield exact and reproducible measurements.47,49
Several studies that have investigated cartilage GAG content based on dGEMRIC have been performed in the knee and hip. The ankle joint, however, is particularly challenging due to its thin cartilage layer. Domayer et al. 46 addressed this issue with the use of a multichannel (phased array) flexible multipurpose coil, which was able to provide sufficient signal-to-noise-ratio (SNR) and resolution for the separate evaluation of the talar and tibial cartilage layers at 3 T. A volume interpolated breath-hold examination (VIBE) sequence was applied. By performing 2 consecutive acquisitions with different flip angles, this sequence enables the calculation of quantitative T1-mapping images. The optimal time interval between the administration of contrast media and the acquisition of postcontrast T1 images was assessed in a volunteer study, which indicated that thorough contrast agent diffusion is reached after 45 minutes. Subsequently, 10 patients after MACT of the talar dome, with a mean follow-up period of 51 months, were examined with this optimized protocol and pre- and postcontrast images were obtained ( Fig. 5 ). 46 The ROI analysis demonstrated a considerable interindividual variation in postcontrast relaxation rates for both, reference cartilage and RT. This variability, however, was ameliorated when calculating the ΔR1 and rΔR1. Regarding ΔR1, no significant difference was found between RT and reference cartilage, although this finding was limited by the relatively small sample size. Average rΔR1 was 1.34, and therefore significantly closer to healthy reference cartilage than the values reported for RT after MACT in the knee, where values of 2.35 and 2.40 were reported.50,51 These findings once again puts emphasize assumption that ankle cartilage has increased regenerative potential.5,6
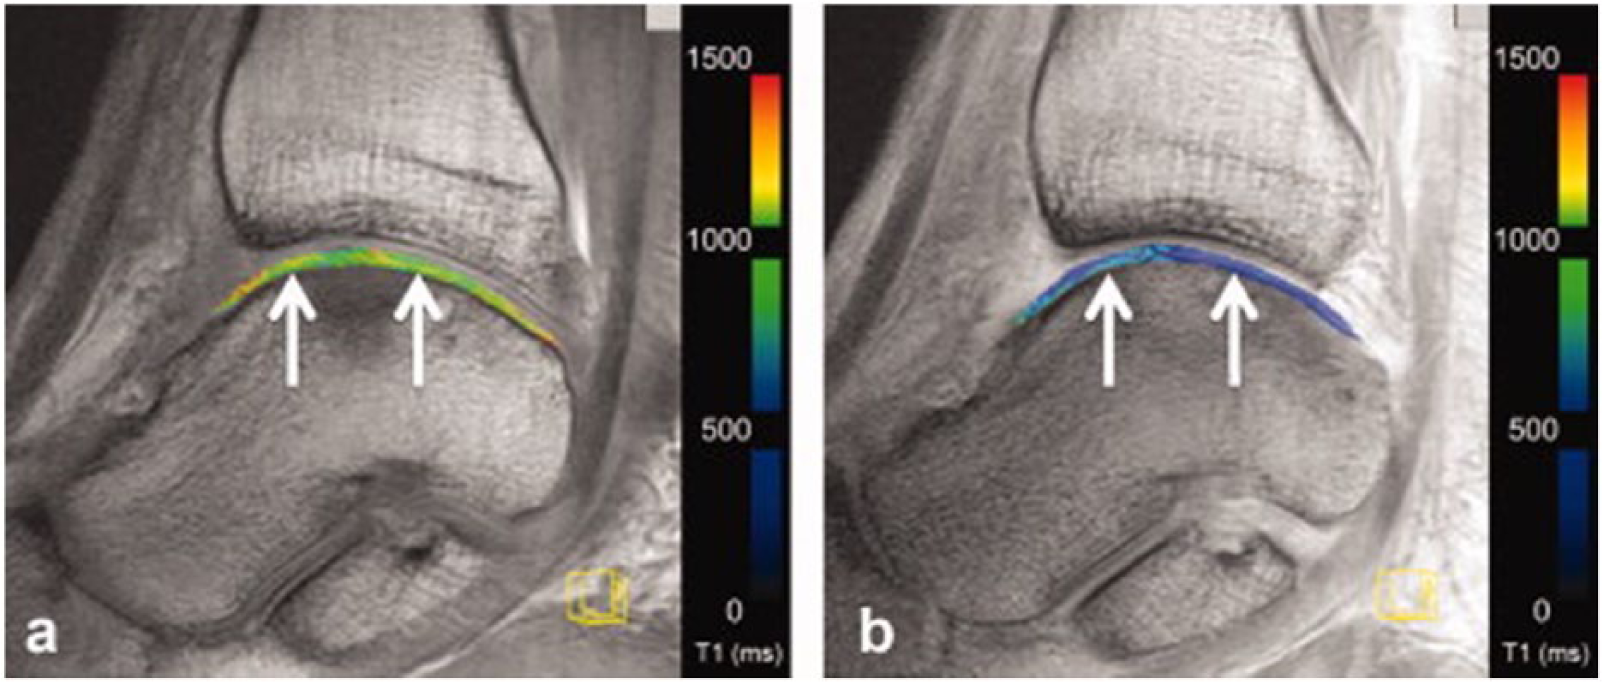
Delayed gadolinium-enhanced magnetic resonance imaging of the talus after matrix-associated autologous chondrocyte implantation (MACI) at 3 T. White arrows indicate repair tissue borders. Image (
Recent studies were able to demonstrate the potential of dGEMRIC not only in larger joints but also in the ankle joint. However, the necessity of contrast media administration, as well as the obligatory time interval before quantitative T1-mapping, may constitute hindrances for widespread clinical application.
Sodium Imaging
Sodium imaging allows for the direct measurement of sodium concentrations in a volume of interest. Its use for the assessment of the GAG content of articular cartilage is based on the premise that the negatively charged sites on GAGs are equalized by positively charged sodium ions. By including phantoms with known sodium concentrations in in vivo measurements, sodium-corrected signal intensities (cSI) or even absolute sodium concentrations can be calculated in native cartilage, as well as cartilage RT. Under consideration of this directly proportional relationship between the concentration of sodium ions and GAGs, cartilage GAG content can be deduced from the sodium values. Its high sensitivity and straightforward approach render sodium imaging a very promising modality for the assessment of GAG content.
However, sodium imaging is a challenging method. It requires special multinuclear hardware and has to deal with sodium concentrations considerably lower than in proton-based imaging. In addition, the physical properties of the sodium nuclei make the situation even more complicated, as their gyromagnetic ratio is only one-fourth that of protons. Four times higher gradient strengths are necessary for sodium to compensate for this. Altogether, the sensitivity of sodium in cartilage is about 4000 times lower compared to that of protons. This results in an inherently low SNR, limiting spatial resolution of sodium images acquired at 3 T. The remedy for this issue is the use of higher field strengths, which, in contrast to proton based MR imaging brings no disadvantages, but offers a substantial increase in SNR. This increase in SNR per unit of time, provided by 7-T systems, can be invested into sodium images with higher spatial resolution.
After several studies showing the possibility of sodium imaging for the evaluation of knee cartilage, including a demonstration of its correlation with dGEMRIC,52-54 the first study on sodium imaging in the ankle joint was recently performed. 55 The authors successfully validated their protocol in ankle joint cadaver specimens ex vivo, correlating the corrected signal intensities with the histochemically evaluated GAG content. A strong correlation was observed, demonstrating that even the thin cartilage layer of the ankle joint is amenable to sodium imaging at 7 T, with high sensitivity to changes in GAG content. Subsequently, baseline values were established in healthy volunteers ( Fig. 6 ) 55 and compared with those of RT after MFX and MACT of the talar dome. RT after both, MFX and MACT, exhibited significantly lower cSI and therefore GAG content than healthy reference cartilage. In line with the findings regarding the collagen network by an aforementioned T2 mapping study, 37 no significant difference between MFX and MACT was observed with respect to the GAG content. This study demonstrated that the value of sodium imaging in cartilage assessment also applies to the ankle joint. Because of its high sensitivity, it has the ability to serve as a reference modality for novel GAG specific sequences in the future.
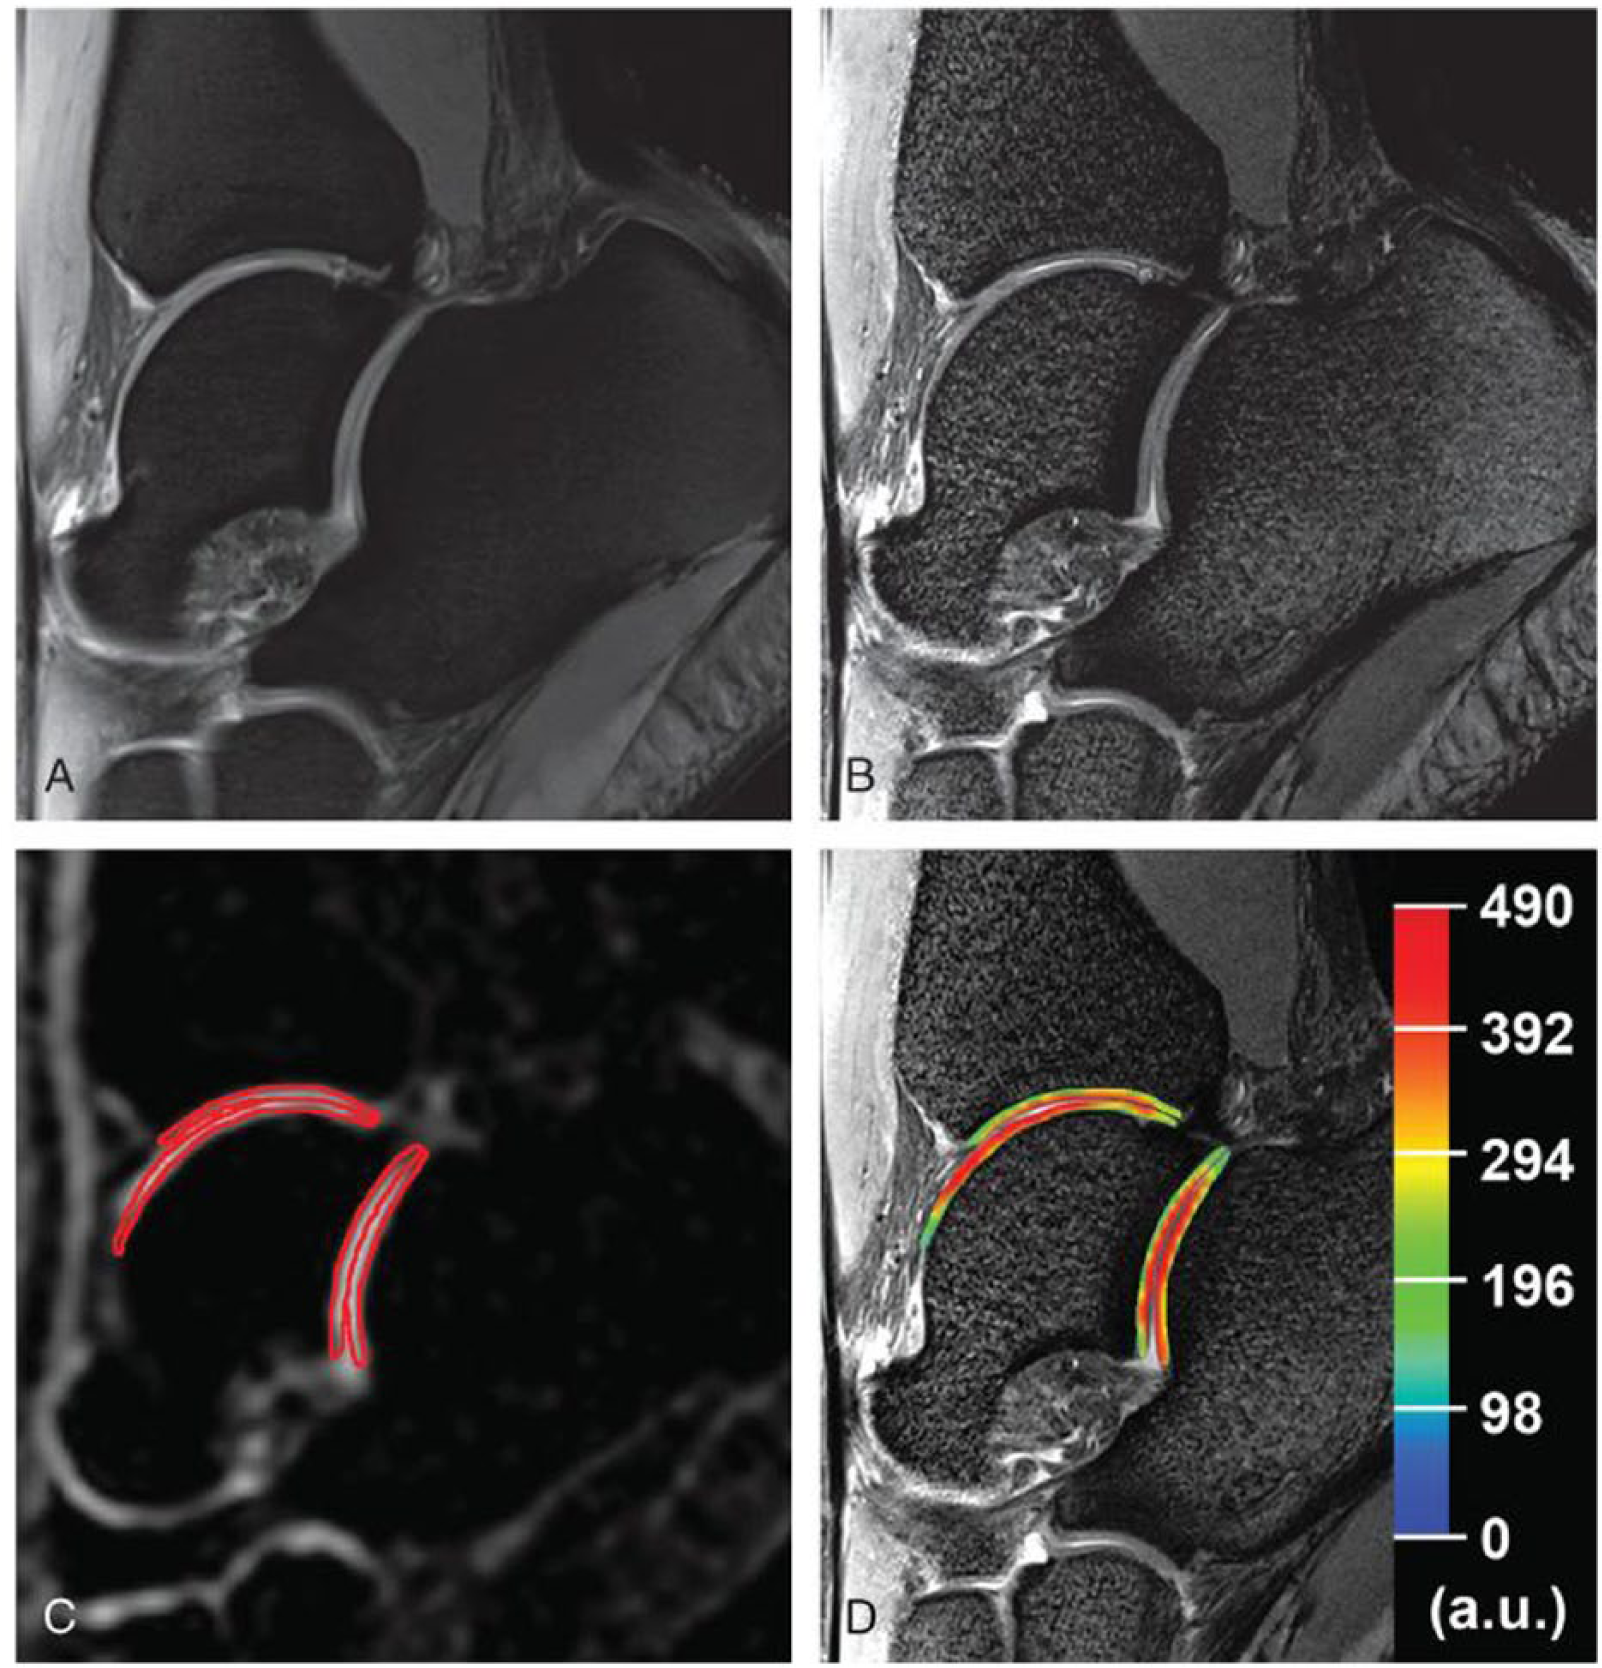
Sagittal proton density–weighted 2-dimensional turbo spin echo (TSE) images (
Conclusion
The role of biochemical MRI in the assessment of cartilage quality cannot be emphasized enough. There are multiple different imaging approaches at disposal, which differ in target parameters, as well as in specific advantages and disadvantages ( Table 1 ). 56 All of these approaches benefit from the use of high field (3 T) and ultra-high field (7 T) MRI, particularly from a gain in SNR and spectral resolution. Increased SNR might be traded for either higher spatial resolution while preserving measurement time or it might be traded for higher temporal resolution while preserving spatial resolution. With improvements in software and hardware (stronger gradients, radiofrequency coils with better B1-homogeneity, efficient fat suppression), most of the former limitations of 7 T, such as field inhomogeneities, increased sensitivity to chemical shift artifacts, as well as to susceptibility artifacts have been addressed and ameliorated. If adequately optimized, most sequences are expected to yield images of higher quality at 7 T in comparison with 3T. The inherent drawbacks of 7 T include SAR limits and increased inhomogeneity of the static magnetic field, as well as the B1 field. Overall, however, there is a substantial preponderance of the benefits of 7-T MRI. Therefore, with increasing availability the introduction of 7-T systems to the clinical routine can be expected in the near future. Nevertheless, with the exception of sodium imaging, all of the discussed sequences have already been successfully applied in the ankle joint at lower field strengths as well. In the ankle joint, biochemical MRI is currently focused on the postoperative evaluation of talar dome lesions and the evaluation of repair tissue after different cartilage surgeries in a research setting. However, as with 7-T systems, the translation of these innovative approaches to a clinical setting is expected.
Overview Over Biochemical Magnetic Resonance Imaging Techniques for the Assessment of Articular Cartilage of the Ankle Joint 56 .
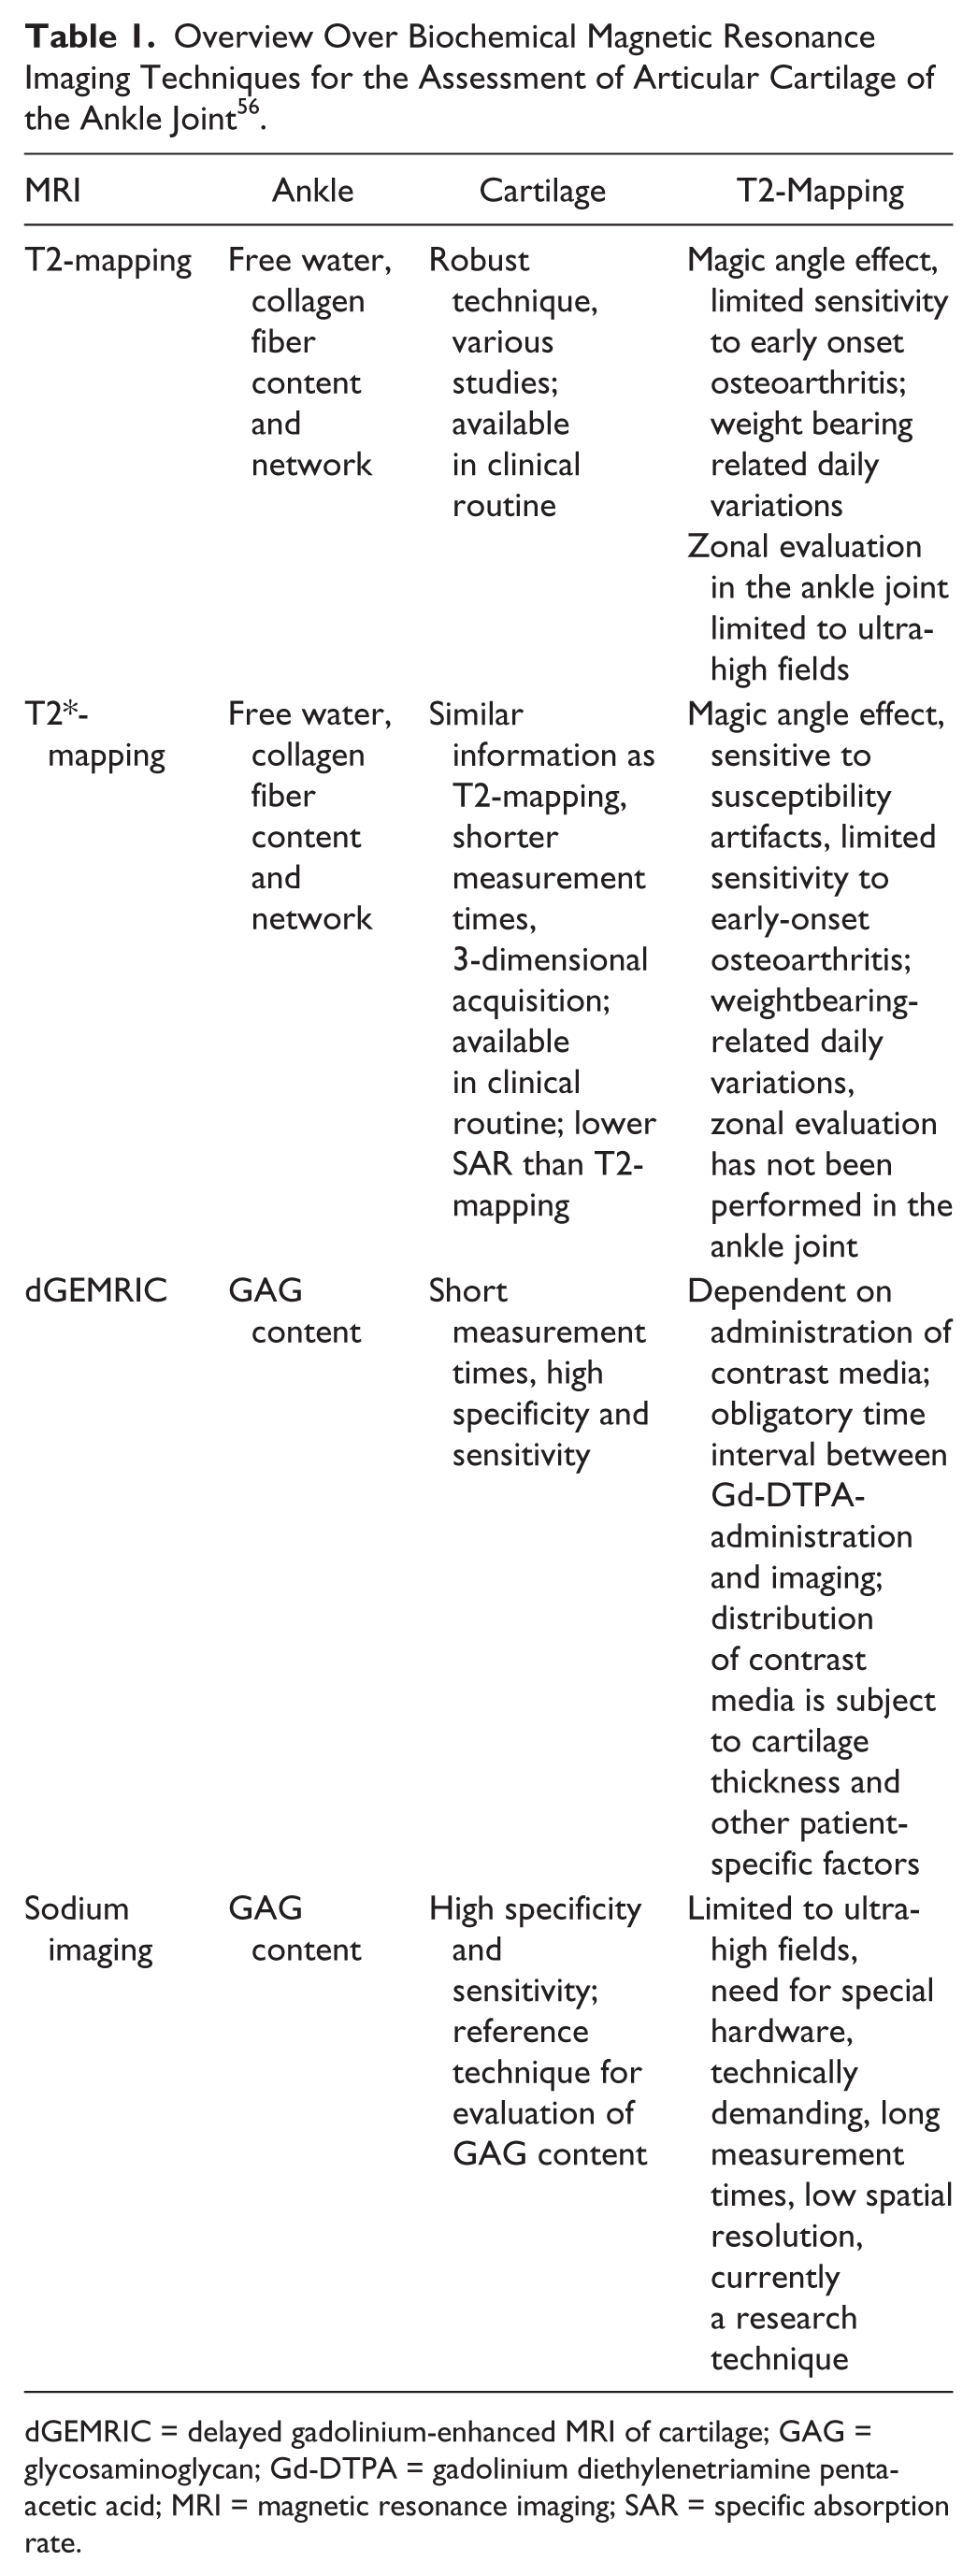
dGEMRIC = delayed gadolinium-enhanced MRI of cartilage; GAG = glycosaminoglycan; Gd-DTPA = gadolinium diethylenetriamine penta-acetic acid; MRI = magnetic resonance imaging; SAR = specific absorption rate.
Footnotes
Acknowledgments and Funding
Funding of this project was provided by the Vienna Science and Technology Fund, Project WWTF-LS11-018.
Declaration of Conflicting Interests
The author(s) declared no potential conflicts of interest with respect to the research, authorship, and/or publication of this article.