
Abstract
Background:
The optimal placement of suture anchors in transosseous-equivalent (TOE) double-row rotator cuff repair remains controversial.
Purpose:
A 3-dimensional (3D) high-resolution micro–computed tomography (micro-CT) histomorphometric analysis of cadaveric proximal humeral greater tuberosities (GTs) was performed to guide optimal positioning of lateral row anchors in posterior-superior (infraspinatus and supraspinatus) TOE rotator cuff repair.
Study Design:
Descriptive laboratory study.
Methods:
Thirteen fresh-frozen human cadaveric proximal humeri underwent micro-CT analysis. The histomorphometric parameters analyzed in the standardized volumes of interest included cortical thickness, bone volume, and trabecular properties.
Results:
Analysis of the cortical thickness of the lateral rows demonstrated that the entire inferior-most lateral row, 15 to 21 mm from the summit of the GT, had the thickest cortical bone (mean, 0.79 mm; P = .0001), with the anterior-most part of the GT, 15 to 21 mm below its summit, having the greatest cortical thickness of 1.02 mm (P = .008). There was a significantly greater bone volume (BV; posterior, 74.5 ± 27.4 mm3; middle, 55.8 ± 24.9 mm3; anterior, 56.9 ± 20.7 mm3; P = .001) and BV as a percentage of total tissue volume (BV/TV; posterior, 7.3% ± 2.7%, middle, 5.5% ± 2.4%; anterior, 5.6% ± 2.0%; P = .001) in the posterior third of the GT than in intermediate or anterior thirds. In terms of both BV and BV/TV, the juxta-articular medial row had the greatest value (BV, 87.3 ± 25.1 mm3; BV/TV, 8.6% ± 2.5%; P = .0001 for both) followed by the inferior-most lateral row 15 to 21 mm from the summit of the GT (BV, 62.0 ± 22.7 mm3; BV/TV, 6.1% ± 2.2%; P = .0001 for both). The juxta-articular medial row had the greatest value for both trabecular number (0.3 ± 0.06 mm–1; P = .0001) and thickness (0.3 ± 0.08 μm; P = .0001) with the lowest degree of trabecular separation (1.3 ± 0.4 μm; P = .0001). The structure model index (SMI) has been shown to strongly correlate with bone strength, and this was greatest at the inferior-most lateral row 15 to 21 mm from the summit of the GT (2.9 ± 0.9; P = .0001).
Conclusion:
The inferior-most lateral row, 15 to 21 mm from the tip of the GT, has good bone stock, the greatest cortical thickness, and the best SMI for lateral row anchor placement. The anterior-most part of the GT 15 to 21 mm below its summit had the greatest cortical thickness of all zones. The posterior third of the GT also has good bone stock parameters, second only to the medial row. The best site for lateral row cortical anchor placement is 15 to 21 mm below the summit of the GT.
Clinical Relevance:
Optimal lateral anchor positioning is 15 to 21 mm below the summit of the greater tuberosity in TOE.
Arthroscopic transosseous-equivalent (TOE) double-row rotator cuff repair techniques have evolved in the past decade with varying configurations of suture anchor placement. The mattress tension band technique developed by Boileau et al 5 positions the anchor much more lateral and distal to the summit of the greater tuberosity (GT), where a higher pullout strength has been demonstrated. 29 These repair techniques enhance the biomechanical strength of the repair and increase the surface area of the repaired tendon on the footprint, but their ability to provide superior anatomic and functional outcomes remains controversial.
With advances in arthroscopic surgery, the use of suture anchors has become increasingly popular because of the ease and speed of their use and decreased surgical exposure and morbidity. 2,8,11 Poor fixation of suture anchors due to reduced bone quality of the proximal humerus is a problem in rotator cuff repair. 1,8,10,12,15,27,28,33 Pullout of suture anchors before tendon healing may result in gap formation between the tendon and the bone, rupture of the rotator cuff repair, and a poor outcome. 1,12,13,15,33 Recommendations in the literature regarding the optimum region for placement of lateral row suture anchors in rotator cuff repair are controversial. 7,11,13,29,31
Surgeons are limited to the region of the GT and the lesser tuberosity when repairing the torn rotator cuff. The site of tendon reattachment is influenced by the size of the rotator cuff tear, the involved rotator cuff tendons, the degree of tendon retraction, and the amount of tendon mobilization achieved as well as the degree of tendon tension during rotator cuff surgery. 7,11,31 However, within these limitations, the surgeon still has some options regarding suture anchor placement. The literature suggests that juxta-articular bone just medial to the GT is best for medial row anchor fixation. 2,7,13,17,20 However, other studies have suggested that lateral row suture anchors placed lateral and distal to the summit of the GT have even higher pullout strengths, and they therefore recommend insertion of anchors as far distal from the tip of the GT as possible. 5,11,29,31 The lateral-distal extent of anchor placement may be limited by the course of the axillary nerve. We hypothesized that greater cortical thickness and better bone microarchitecture may be the reason for this increase in pullout strength.
Micro–computed tomography (micro-CT) is a noninvasive high-resolution imaging modality capable of 2-dimensional (2D) and 3-dimensional (3D) microarchitectural examination of excised bone segments at a level of detection not achievable with conventional CT imaging scanners. Micro-CT has a spatial resolution in the 10 μm range, which is 10 to 100 times better than conventional clinical CT or magnetic resonance imaging (MRI) scanners and can accurately discriminate between trabecular and cortical bone compartments and nonosseous tissues as opposed to conventional clinical CT and MRI imaging. 22,25,26 Histomorphometric studies have observed differences in the osseous structure of the proximal humerus using quantitative computed tomography (QCT) 32 and high-resolution peripheral quantitative computed tomography (HR-pQCT). 17
The aim of this study was to carry out a 3D high-resolution micro-CT histomorphometric analysis of cadaveric proximal humeral GTs to understand the differences in osseous morphology of various zones that may guide optimal positioning of lateral row anchors in posterior-superior (infraspinatus and supraspinatus) TOE rotator cuff repair.
Methods
This study was reviewed and supported by the Human Research Ethics Committee at The Queen Elizabeth Hospital, Woodville South, South Australia, Australia. The cadaveric specimens were provided, after completion of body donation consent forms and physical acceptance, as part of The University of Adelaide School of Medical Sciences Body Donation Program. There were no external sources of funding.
Specimens
A total of 13 fresh-frozen human cadaveric proximal humeri from the Ray Last Laboratory, University of Adelaide, were examined. Seven specimens were male and 6 female, with a mean age of 89 years (range, 73-100 years). Six specimens had an intact rotator cuff while 7 had chronic retracted full-thickness tears of the rotator cuff.
Micro-CT Analysis
Each sample was thawed carefully, wrapped in cling wrap, and placed in a desktop high-resolution micro-CT scanner (Skyscan 1076 in vivo micro-CT scanner). 25 Scans were performed with a source voltage of 100 kVp, current of 90 mA, and a 1.0-mm-thick aluminum filter for beam hardening reduction, with 34.6-mm pixel size.
Cross-sectional images were reconstructed using a filtered back-projection algorithm (NRecon software, V 1.6.4.7; Skyscan). 25,26 For each proximal humerus, a total of 1688 2D radiographic images were acquired as TIF files and reconstructed into 8-bit gray-level (bitmap) image files using a cone beam algorithm with a beam hardening setting of 70% and ring artifact reduction of 15. From the reconstructed bitmap datasets, the volume of interest (VOI) was identified.
Setting the VOI for Histomorphometric Analysis
For the evaluation of bone density and the histomorphometric analysis, specific VOIs were defined within the GT. Each volume had a cylindrical shape with a diameter of 7.5 mm and a depth of 15 mm, corresponding to the mean volume of currently used suture anchors. 3 To achieve a maximum comparability to the clinical situation, each volume had been placed at a 45° angle to the GT. This angle had been previously described by Burkhart, 6 who stated that the anchor’s pullout strength is increased at lower angles. The positions of the VOIs were defined as zones A1 through 4, B1 through 4, and C1 through 4.
The borders of the GT were defined based on anatomical studies by Meier and Meier. 19 It was divided into 3 equal zones in the sagittal plane: (A) posterior, (B) intermediate, and (C) anterior. In the coronal plane, the GT was divided into 4 zones, corresponding to potential anchor sites for TOE rotator cuff repair. Row 1 (A1, B1, C1) was medial to the GT, adjacent to the articular surface, where suture anchors for the medial row are generally placed. Rows 2, 3, and 4 were lateral to the summit of the GT, where lateral anchors are often placed. Row 2 was 0 to 7 mm below the summit, Row 3 was 8 to 14 mm below, and zone 4 was 15 to 21 mm below the summit. For each row (1 to 4), there was a posterior (A), intermediate (B), and anterior (C) volume of interest (ie, A1, B1, and C1). The VOIs are illustrated in Figure 1.
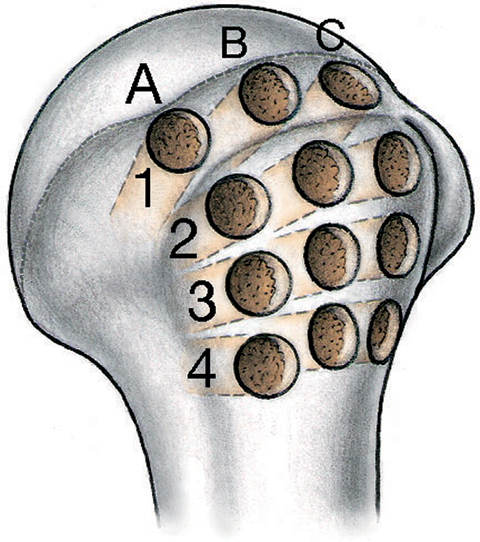
Posterolateral view of the proximal humerus depicting the exact locations of volumes of interest in zonal arrangement. The greater tuberosity is divided into 3 equal zones in the sagittal plane (A, B, C). Four rows were defined in the coronal plane, 1 medial row adjacent to the articular surface (A1, B1, C1) and 3 rows lateral to the summit of the greater tuberosity. Row 2 (A2, B2, C2), 0 to 7 mm below the summit; Row 3 (A3, B3, C3), 8 to 14 mm below; and Row 4 (A4, B4, C4), 15 to 21 mm below.
Histomorphometric Analysis
The micro-CT images were segmented using global thresholding, and 3D morphometric parameters were calculated within the cylindrical VOI zones using CT Analyser Software (Skyscan). 24 The following histomorphometric properties were analyzed (Table 1):
Cortical thickness Cortical thickness was measured in mm at the center of and perpendicular to VOI for zones 2, 3, and 4 (A2, B2, and C2 to A4, B4, and C4) The cortical thickness of the juxta-articular medial row was not reported as this area is usually decorticated by many surgeons prior to medial row anchor placement
Bone volume Bone volume (BV; mm3) Total (tissue) volume (TV; mm3) Bone volume to total (tissue) volume ratio (BV/TV; %), the relative volume of calcified tissue in the selected bone volume of interest
Trabecular properties Trabecular connectivity (trabecular pattern factor = Tb.Pf; mm–1), the 3D index that describes the reciprocal trabecular lattices Structure model index (SMI), the relative prevalence of rods and plates of trabecular bone in a 3D structure Number of trabeculae (Tb.N; mm–1) Trabeculae thickness (Tb.Th; μm) Trabecular separation (Tb.Sp; μm)
Bone Histomorphometric Properties a

a 3D, 3-dimensional; micro-CT, micro–computed tomography.
BV/TV was determined by simple voxel counting of the bone and background phases. The mean trabecular dimensions (Tb.Th, Tb.N, and Tb.Sp) were calculated directly using a model-independent sphere-filling technique. The morphometric parameter, SMI, was calculated from the surface convexity of the triangulated bone surface and allowed for quantification of plate- and rod-like geometries of trabecular bone. 16 SMI has been shown to strongly correlate with bone strength. 21 The stability of trabecular bone depends not only on the amount of bone tissue but also on the 3D orientation and connectedness of trabeculae. The trabecular pattern factor (Tb.Pf) is a 3D index that describes the reciprocal trabecular lattices and is a marker of trabecular connectivity. The loss of connectivity has a substantial impact on structural integrity and results in elevated fracture risk. 9,14,23
Statistical Analysis
Statistical analysis was performed using SPSS statistical software (IBM Corp). Descriptive analysis of the data was performed to report means and standard deviations as well as the range. Differences between the areas were made using univariate analysis with Bonferroni-Dunn correction for the subgroups. Differences between torn and intact tendons were made using t test analysis. Statistical significance was defined as P < .05.
Results
Specimens
Of the 13 fresh-frozen human cadaveric proximal humeri specimens, 7 were male and 5 female, with a mean age of 89 years (range, 73-100 years). Six specimens had an intact rotator cuff, while 7 had chronic retracted full-thickness tears of the rotator cuff. The rotator cuff was divided into 6 sectors (A, B, C, D, E, or F), and the tears were classified per the Thomazeau et al 30 classification modified by Boileau et al. 4 There were no differences regarding sex or side between the torn and intact groups (Table 2).
Proximal Humeral Cadaveric Specimen Analysis a

a ns, not significant.
Cortical Thickness of Lateral Rows
Analysis of the cortical thickness of the lateral rows demonstrated that the entire inferior-most lateral row, 15 to 21 mm from the summit of the GT (zones 4A, 4B, and 4C), had the thickest cortical bone (mean, 0.79 mm). In all 3 zones (A-C), there was a statistically significant difference between the heights (P = .001). In detailed analysis between the heights, there was significant difference between Rows 3 (P = .008) and 4 (P = .008) in the anterior and posterior thirds. Zone 4C, which is the anterior-most part of the GT and 15 to 21 mm below its summit, had the greatest cortical thickness at 1.02 mm (Table 3).
Cortical Thickness of Volumes of Interest in the Lateral Rows a

a Data are reported as mean ± SD. Boldfaced P values indicate statistical significance. GT, greater tuberosity.
Anterior-Posterior Comparison of Bone Histomorphometric Parameters
There was a significantly greater BV and BV/TV in zone A (A1-A4) of the GT than in zones B or C. There was no statistically significant difference in the trabecular properties between the posterior, intermediate, and anterior zones (Table 4).
Anteroposterior Comparison of Bone Morphometric Parameters a
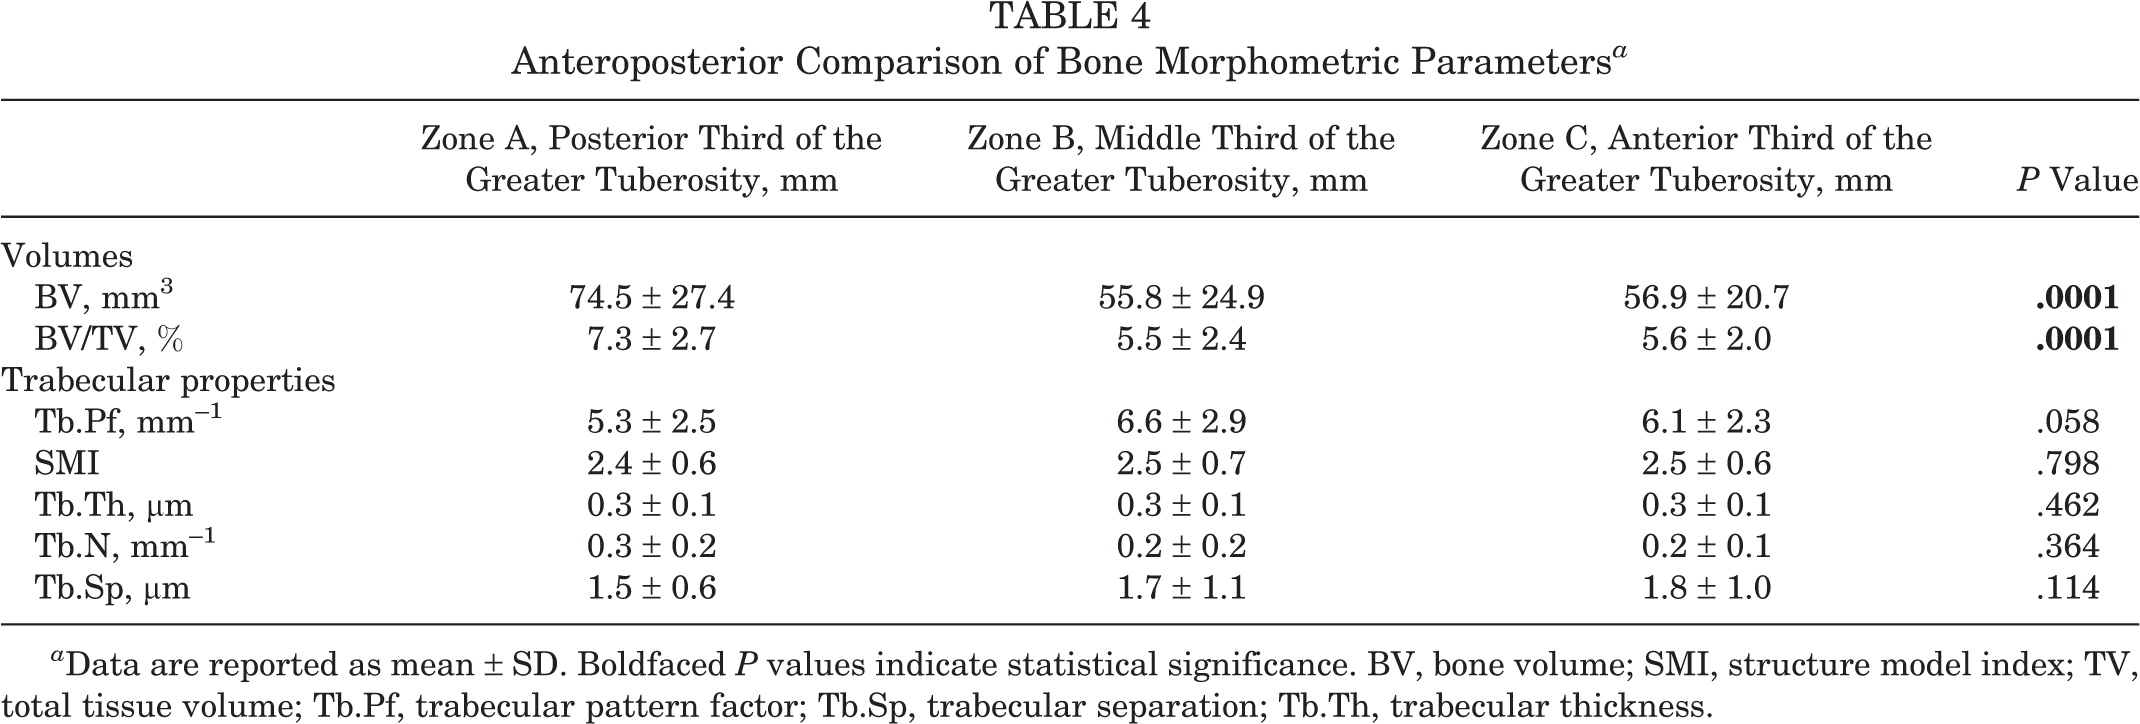
a Data are reported as mean ± SD. Boldfaced P values indicate statistical significance. BV, bone volume; SMI, structure model index; TV, total tissue volume; Tb.Pf, trabecular pattern factor; Tb.Sp, trabecular separation; Tb.Th, trabecular thickness.
Superior-Inferior Comparison of Bone Histomorphometric Parameters
There were statistically significant differences in all histomorphometric parameters of bone volume and trabecular properties between the 4 rows from superior to inferior on the GT (Table 5).
Superoinferior Comparison of Bone Morphometric Indices a

a Data are reported as mean ± SD. Bolded P values indicate statistical significance. BV, bone volume; GT, greater tuberosity; SMI, structure model index; TV, total tissue volume; Tb.Pf, trabecular pattern factor; Tb.Sp, trabecular separation; Tb.Th, trabecular thickness.
In terms of both BV and BV/TV, Row 1 had the greatest value (BV, 87.3 ± 25.1 mm; BV/TV, 8.6% ± 2.5%; P = .0001 for both compared with the other 3 rows), followed by Row 4, 15 to 21 mm from the summit of the GT (BV, 62.0 ± 22.7 mm; BV/TV, 6.1% ± 2.2%; P = .0001 for both compared with the other 3 rows). Row 2, 0 to 7 mm from the GT, had the lowest BV and BV/TV percentage (BV, 47.4 ± 15.8 mm; BV/TV, 4.7% ± 1.6%; P = .0001 for both compared with the other 3 rows).
The trabecular pattern factor (Tb.Pf) is a 3D index that describes the reciprocal trabecular lattices and is a marker of trabecular connectivity. 9,14,23 This was greatest in the superior-most lateral row, 0 to 7 mm from the GT (8.1 ± 1.8; P = .0001). This is the same area that had the lowest BV and BV/TV described above. Tb.Pf was lowest in the medial row and the inferior-most lateral row, where the bone volume parameters where greatest. Trabecular connectivity demonstrated an inverse relationship to BV/TV.
The SMI has been shown to strongly correlate with bone strength. 21 It is a nonmetric parameter that describes the relative prevalence of rods and plates of trabecular bone in a 3D structure. The SMI was greatest at the inferior-most lateral row, 15 to 21 mm from the summit of the GT, (2.9 ± 0.9; P = .0001).
Row 1 had the greatest value for both Tb.N (0.3 ± 0.06 mm–1; P = .0001) and Tb.Th (0.3 ± 0.08 μm; P = .0001) with the lowest degree of Tb.S (1.3 ± 0.4 μm; P = .0001), while Row 4, 15 to 21 mm from the summit of the GT, demonstrated the lowest Tb.N (0.2 ± 0.1 mm–1) and Tb.Th (0.1 ± 0.05 μm) with the highest Tb.S (2.2 ± 1.1 μm).
Bone Histomorphometric Parameters: Torn Versus Intact Tendons
There were statistically significant differences in the histomorphometric parameters between specimens that had torn or intact rotator cuffs. These differences were evident for both BV and some trabecular properties but not SMI. The GTs of specimens with intact rotator cuff tendons had significantly greater BV (61.9 ± 24.1 mm [intact] vs 51.8 ± 21.7 mm [torn]; P = .018) as well as BV/TV (6.1% ± 2.4% [intact] vs 5.1% ± 2.1% [torn]; P = .018). The trabecular pattern factor (7.6 ± 2.3 [intact] vs 6.1 ± 2.1 [torn]; P = .003) and trabecular number (0.31 ± 0.30 mm–1 [intact] vs 0.17 ± 0.08 mm–1 [torn]; P = .001) were also greater in lateral rows of the GTs with intact tendons. While the trabecular separation was significantly greater in the lateral rows of the GTs with torn tendons (2.1 ± 1.2 μm [torn] vs 1.4 ± 0.5 μm [intact]; P = .0001) (Table 6 and Figure 2).
Superoinferior Comparison of Bone Morphometric Indices a

a Data are reported as mean ± SD. Boldfaced P values indicate statistical significance.

Macroscopic representative regions of greater tuberosity volume of interest in an individual who had a (A) torn rotator cuff on the right side and (B) intact tendons on the left side. On close inspection, it is evident that the bone quality in the lateral zones (A-C and 2-4) is different.
Discussion
Arthroscopic TOE double-row rotator cuff repair techniques have evolved over the last decade with varying configurations of suture anchor placement. Recommendations in the literature regarding the optimum sites for placement of suture anchors in rotator cuff repair are controversial. 7,11,13,29,31 Furthermore, the type of anchor utilized depends on an understanding of the osseous morphology of the fixation area and, specifically, the predominance of cortical or spongious bone.
The mattress tension band technique developed by Boileau et al 5 positions the anchor much more distal to the summit of the GT, where a higher pullout strength has been demonstrated. Rossouw et al 29 found that suture anchors placed more than 20 mm distal of the tip of the GT had greater pullout strengths. The authors speculated that a greater cortical thickness might be the reason for this increase in pullout strength and therefore recommended insertion of anchors as far distal from the tip of the GT as possible. Other authors have also recommended placing suture anchors distal to the GT because the bone stock was thought to be better in this region. 11,31
This micro-CT study is the first to demonstrate that the inferior-most lateral row, 21 mm from the summit, not only has good bone stock, demonstrated by the high levels of BV and BV/TV percentage, but also the thickest cortical bone. We also found this region to have the greatest SMI. SMI is a nonmetric parameter that describes the relative prevalence of rods and plates of trabecular bone in a 3D structure, with strong correlation with bone strength. 21 In terms of BV/TV, the juxta-articular medial row had the best bone stock, followed by the inferior-most lateral row 15 to 21 mm from the summit of the GT. Previous studies have similar findings with regard to the juxta-articular medial row and they recommend placement of medial row anchors adjacent to the articular surface to guarantee a better structural bone stock. 17,20
We found no significant difference in the trabecular properties between the posterior, intermediate, and anterior zones of the GT, but both BV and BV/TV were significantly greater in the posterior third of the GT than in the intermediate or anterior thirds. Barber et al reported decreased pullout strength of suture anchors in the anterior compared with posterior portion of the GT. 1 Although they found greater pullout forces in the posterior part of the GT, they failed to show any trabecular differences between the anterior and posterior areas of the GT. Our findings are also consistent with Kirchhoff et al, 17 who analyzed the mean BV/TV of the GTs of the osteoporotic humeral head using high-resolution peripheral quantitative computed tomography (HR-pQCT). These authors also found significant regional differences, with the best bone stock in the posterior parts of the GT.
The trabecular pattern factor (Tb.Pf) is a 3D index that describes the reciprocal trabecular lattices and is a marker of trabecular connectivity. 9,14,23 To our knowledge, this parameter has never been studied in the GT before. We found that trabecular connectivity had an inverse relationship to bone stock (BV and BV/TV). Tb.Pf was greatest in the superior-most lateral row, 7 mm from the GT, followed by the intermediate lateral row, 14 mm below the summit of the GT. These 2 areas had the lowest BV and BV/TV percentage in our study, consistent with other micro-CT studies in the literature. 17,20 Cortical thickness was also lowest in these zones. The loss of connectivity has a substantial impact on structural integrity and results in elevated fracture risk.
In a further study, Kirchhoff et al 18 showed better micro-CT parameters of bone quality in the superficial portion of the analyzed bone cylinders from the GT of cadaveric specimens with intact rotator cuffs in comparison with the deep portion. They demonstrated that cancellous bone presents with increasingly worse bone quality in terms of low BV/TV, reduced trabecular number as well as trabecular thickness, and increased trabecular separation when analyzing subsequently deeper portions of the bone cylinders of the GT starting from the outer cortical surface. They concluded that screwing of the anchors to a deeper cancellous region would not result in increased stability.
There were no differences regarding sex or side between the torn and intact groups. We found statistically significant differences in some histomorphometric parameters between the GTs of proximal humeri that had torn or intact rotator cuffs. A micro-CT study by Meyer et al 20 found that tendon tears are associated with a reduction in cancellous bone density of greater than 50%, leading to a virtually hollow GT with intact cortical bone. They found that the cortical bone quality was far more consistent and not grossly altered by full-thickness tendon tears. 20 We also found that there were statistically significant differences in the bone volume parameters as well as the trabecular number (Tb.N), trabecular separation (Tb.S), and trabecular pattern factor. Interestingly, there was no difference in SMI.
This investigation has several limitations. The advanced age of the cadaveric specimens may limit the applicability of our findings to the 50- to 60-year-old patient groups that commonly present with rotator cuff tears. The presence of chronically retracted tears would have an impact on GT bone quality, as demonstrated by this study and Meyer et al. 20 We did not carry out biomechanical testing of the lateral rows to further support our histomorphometric findings. Rossouw et al 29 found that suture anchors placed more than 20 mm distal to the tip of the GT had greater pullout strength, but we limited our histomorphometric analysis to 21 mm below the GT because of the potential risk to the axillary nerve below this level.
Conclusion
The inferior-most lateral row, 15 to 21 mm from the tip of the GT, has good bone stock, the highest cortical thickness, and the best SMI for lateral row anchor placement. The anterior-most part of the GT, 15 to 21 mm below its summit, had the greatest cortical thickness of all zones. The posterior third of the GT also has good bone stock parameters, second only to the medial row.
The best site for lateral row cortical anchor placement in posterior-superior transosseous equivalent rotator cuff repair is 15 to 21 mm below the summit of the GT.
Footnotes
The authors declared that they have no conflicts of interest in the authorship and publication of this contribution.