
Abstract
Keywords
Introduction
Over 1 quarter of all new HIV infections globally occur among youth between the ages of 15 and 24. 1 Adolescents living with HIV have worse outcomes than those living with HIV in other age groups, including increased rates of loss to follow up, higher likelihood of unsuppressed viral loads, and increased mortality rates.2,3 Between 2010 and 2019, global HIV-related deaths decreased by 39% in all age categories 4 but increased by 24% among young people 15 to 24 years old. 5
Of the 2.1 million adolescents living with HIV worldwide, 85% reside in sub-Sahara African countries. 6 In Rwanda, as in many other sub-Sahara African countries, youth aged 15 to 24 make up over 20% of the total population. 7 Rwanda's HIV prevalence has stabilized at around 3% for the general population and around 1% for youth over the last decade; however, only 61% of Rwandan youth living with HIV (PLHIV) are virally suppressed, compared to 76% in the general population. 8 Studies in Rwanda have also shown that PLHIV are more likely to have unsuppressed viral loads due to poor antiretroviral therapy adherence (ART), resulting mainly by missing or refusing ART doses, and low retention in HIV services, and poor mental health often caused by levels of depressive symptoms.8,9 Rwanda's young population and poor HIV outcomes among youth makes PLHIV a critical population for improved HIV treatment.
Many strategies have been developed to address poor adherence to ART and low retention of services among youth with HIV, including home visits, adherence counselling, education, technology platforms, psychosocial support, financial incentives, and peer support groups.10,11 Economic interventions among PLHIV in other African countries such as Uganda, Malawi, and South Africa, as well as globally in countries like the United States, have led to positive outcomes including viral suppression.12-16 Similarly, several studies have shown that peer support groups are feasible to implement and highly acceptable among PLHIVs and can increase monthly peer support meeting attendance, psychologic well-being, and clinical outcomes.17-20 However, only 1 previous paper has reported on youth-targeted intervention for PLHIV that combines peer support and economic incentives. This small pilot study of 35 Ghanaian adolescents was perceived positively by the adolescents, but does not provide information about the implementation of a full-scale program implemented outside of a research setting. 21
This paper describes the implementation of an Adolescent Support Group (ASG) program, which combined economic empowerment and peer support among young people aged 15 to 25 living with HIV in 3 rural districts of Rwanda. Here we describe: the design, implementation, and adaptions to this program; the characteristics of group members; group composition; and group performance. We also assessed associations between group characteristics and group performance and between individual characteristics and member retention in the program. We aim to highlight both successes and lessons learned that can guide the implementation and evaluation of future combined economic and peer support programs for youth living with HIV.
Methods
Study Design
This study is a retrospective cohort study which focused on the first 12 months of the implementation of the ASG program in 3 rural districts of Rwanda.
Study Setting
Since 2016, Rwanda provided ART for everyone living with HIV regardless of their CD4 count under the “Treat All” strategy. Per national guidelines, viral load monitoring occurs at 6 month after ART initiation and yearly thereafter, with load suppression defined as ≤20 copies/mL prior to July 2018 and ≤200 copies/mL after July 2018. 22 PLHIV are managed in 3 age groups: children younger than 10, adolescents from 10 to 19 years, and adults with more than 19 years old. In Rwanda, counselling and testing for HIV positive adolescents is available without parental consent starting at age 12 at all public health facilities. 23 HIV positive youth are enrolled in care and initiated on ART after being assessed for emotional readiness and maturity. Pediatric HIV children graduate into the adolescent program starting at age 15 and remain in the adolescent program until they are 24 years old. 23 Both vertically and horizontally infected HIV positive youth aged 15 to 24 are encouraged to join peer support groups that meet on a monthly basis at their nearest primary-level health facility for health care provider-led counselling, peer support, and treatment adherence follow up.
The ASG program was implemented in 3 rural Rwandan districts, Burera, Kayonza, and Kirehe, which are supported by Partners In Health (PIH)/Inshuti Mu Buzima (IMB). PIH is a Boston-based nongovernmental organization that operates in Rwanda as IMB and has supported the Rwandan Ministry of Health in health system strengthening since 2005. In 2017, about 10 200 PLHIV were enrolled in HIV services at PIH-supported sites, approximately 900 of whom were aged between 15 and 25.
Description of the Intervention
In 2017, PIH/IMB implemented the ASG program in Kayonza district to improve HIV positive youth's health outcomes through combined peer support groups and economic empowerment interventions. After 1 year, the project was scaled up to Kirehe and Burera districts. Health care providers at each participating health facility were asked to identify and invite economically vulnerable youth aged 15 to 25 to join the ASG. While healthcare workers were instructed to prioritize extremely vulnerable youth, especially orphans or youth who were out-of-school during group creation, ultimately strict recruitment criteria were not enforced, and health care providers used their discretion when identifying youth who would benefit from the program. Initially only 1 support group was created at each participating health facility. Within the support group, nurses were instructed to lead monthly group discussions focused on both HIV and economic-related challenges faced by PLHIV. The group opened a joint savings account, and financial incentives were deposited into the account according to group performance on predefined indicators. Enrollment in the group was designed to be open during the first quarter, and then closed following the initial awarding of incentives.
In the initial phase of implementation, 4 main indicators were defined to assess group performance: (1) quarterly pharmacy visit attendance, which assessed youths’ timely receipt of ART prescriptions, (2) achieving biannual savings targets, (3) annual viral suppression, and (4) creation of a new ASG within 1 year. Groups’ performance on indicators were assessed and incentives were deposited into the joint group account on a quarterly basis, depending on indicator achievement. For indicators 1 to 3, incentives were awarded in a stepwise manner (Table 1).
Implementation, Adaptation, and Fidelity to the Adolescent Support Group Program.

Abbreviations: PLHIV, people living with HIV; RWF, Rwandan Francs.
Incentives were awarded in a stepwise manner. Groups scoring 100% received 100% of incentives, groups scoring 90%-<100% received 80% of incentives, groups scoring 80%-<90% received 60% of incentives, groups scoring 70%-<80% received 40% of incentives, groups scoring 60%-<70% received 20% of incentives, and groups scoring <60% received no incentives.
Under the National Differentiated Service Delivery Model, PLHIV with 2 consecutive suppressed viral loads who respect pharmacy appointments are eligible for multi-month ART prescriptions.
By awarding indicators in a stepwise manner based on group rather than individual performance, the ASG program was designed to encourage positive peer pressure, where the youth would support each other to achieve targets, attend adolescent support meetings, and remain in care. After 2 years of savings, group members were eligible to withdraw from their accounts to finance small income generating projects, such as livestock, hair salons, or bicycle taxis. In practice, the scoring of the intervention evolved over time. An initial phase of adaptation occurred during the implementation in Kayonza in 2017. A second round of adaption occurred during the implementation in Burera and Kirehe in 2018. A full definition of indicators, incentive levels, and adaptations are described in Table 1.
Data Sources
The primary data source for our report was the quarterly evaluation form used by health facility nurses to track group's performance on indicators. The form described each indicators’ definition, calculation, and timeline for evaluation as well as the process for calculating incentives. The form also had a table to track pharmacy appointment keeping for each ASG member and a table highlighting targeted and achieved savings. These quarterly reports were submitted to the implementing team at PIH/IMB to initiate transfer of funds into the group accounts. Data on group performance, money earned, and money transferred were extracted from these forms. When data was missing from the quarterly report, we contacted health facility nurses to consult the support group register, which were filled out by health care providers and social workers during support group meetings, and the groups’ bank statement and bankbooks.
Individual-level data on ASG participants were extracted from the electronic medical record (EMR) system which captures all PLHIV's clinical and demographic information. The roster of participating members was fuzzy matched to the EMR based on health facility location, name, birth year, and TracNet number, which is a unique identifier used in Rwanda's national HIV program. Fuzzy, rather than exact, matching was used to allow for small discrepancies in the spelling of names or recording of other information between the ASG roster and the EMR. 24 Individual-level data were de-identified before analysis.
Data Analysis:
Using the individual-level dataset, we described sociodemographic and clinical characteristics of the ASG members. Variables were categorized and described using frequencies and percentages. For all ASG members, we had data on district and whether or not the member was able to be matched to the EMR. Among members found in the EMR, we reported on: patient sex; whether the patient's original status at enrollment in HIV care was as a pediatric patient, Prevention of Mother To Child Transmission (PMTCT) patient, or whether the patient enrolled through another route; distance from health center; age; BMI; ART treatment history, and recent viral load results at the time of enrollment in the ASG program. Recent viral load results were defined as results from within 2 years of enrollment in ASG. Although some of the identified ASG members fell outside the age range of 15 to 25 and therefore did not meet the original age criteria for participating in the ASG, we did not exclude from the analysis because we were interested in understanding how the intervention was implemented in practice, even if that implementation was imperfect. We also assessed whether these variables were associated with retention among youth enrolled in ASGs using Fisher's exact tests. The retention in ASG was defined as not having exited the group in the 12 months of this assessment.
Individual-level data were aggregated to describe group composition, including average age of group members, proportion of group members who were male, and proportion of group members who enrolled in HIV care and treatment as pediatric and PMTCT enrollees. To assess within-group heterogeneity, we also calculated the average difference in the absolute value between group member's age and the average age of the group, the proportion of participants who did not belong to the mode gender of the group, and the proportion of participants who did not belong to the mode method of enrollment within the group. For these metrics, a higher value reflects increased heterogeneity within the group. This data was merged to a group-level dataset containing data on indicator performance and incentives. Using the group level dataset, we described characteristics of each ASG by reporting frequencies and percentages for categorical variables and median and ranges for continuous variables. We reported ranges, rather than interquartile ranges, to better capture the high variability in groups’ composition and implementation.
To better understand group achievement and program implementation, we also described groups’ indicator performance by quarter, annual average appointment attendance, and average annual savings per group member. This indicator performance data was extracted from the ASG quarterly reports. Consequently, there is no comparable data source for non-ASG members. For each indicator, we calculated the average performance for each group. This within-group average would have been the metric used to award incentives to the group according to the original design of the intervention. Due to the small sample size of groups and in order to better reflect the total variation in group performance, we summarized indicator performance across groups using means and ranges. To assess the programs’ fidelity to the stated incentive structure, we used groups’ indicator achievement to calculate the amount of incentives earned per group member according to the original rules of the intervention and compared the amount of incentives earned to the amount of incentives awarded per group member using medians and ranges. Although incentives were provided in Rwandan Francs (RWF), they were converted to US dollars (USD) for analysis using an exchange rate of 990 RWF per USD.
We hypothesized that group characteristics, and especially the extent to which were similar to each other, come impact group performance. To test this hypothesis, we first assess overall group achievement, by ranking each groups’ indicator performance (4 quarters of pharmacy keeping, 2 quarters of saving, and 1 quarter of viral load). Rankings ranged from 1 (the worst) to 34 (the best), with tied groups receiving the same score. The average of these 7 ranks was used to assess overall group performance after 1 year of the program. Using linear regression, we assessed whether baseline group characteristics were associated with indicator performance using model coefficients, 95% confidence intervals, and P values.
Ethical Approval and Informed Consent
This study received approval from Inshuti Mu Buzima Research Committee (IMBRC), Rwanda National Ethics Committee (NO. 150/RNEC/2020) and Harvard University approvals (IRB20-0565). Since this study relied on program retrospective data sources, both Harvard University IRB and IMBRC waived the requirements for written informed consent.
Results
Of the 324 PLHIV who participated in the ASG group program, 110 (34%) were from the first round of implementation in Kayonza, 118 (36.42%) were from Burera, and 96 (29.63%) were from Kirehe (Table 2). Among all PLHIV, 287 (88.6%) were matched to EMR. Women made up slightly more than half of the population (56.5%). Most PLHIV (80.1%) had originally enrolled in HIV care through the pediatric program, with 3.5% PLHIV enrolling from PMTCT and 16.4% enrolling from other routes. Overall, 78.4% of youth were in the target age range of 15 to 25 years at enrollment; however, 45 (16.0%) participants were ≤14 years old and 16 (5.6%) were ≥26 years. At the time of enrollment in the ASG program, almost all youth (97.6%) had been initiated on ART with 88.5% being on first line regimens and over half having been on these drugs for over 5 years; however, 17.4% of youth had an unsuppressed viral load (>1000 copies/mL) at their most recent test.
Characteristics of HIV Youth Who Enrolled in the Adolescent Support Group Program (N = 324).

Abbreviations: ART, antiretroviral therapy adherence; ASG, Adolescent Support Group.
Calculated among the 287 individuals matched to the EMR.
A total of 34 ASGs were created, 8 groups in Kayonza, 10 in Kirehe, and 16 in Burera (Table 3). The median number of group members at baseline were 8, however group size ranged from 2 to 33. Although most groups did not lose or add any group members, 1 group lost 8 ASG members and groups added up to 7 new members after the first quarter. We observed substantial heterogeneity both between and within groups. For example, between groups, the average age of group members ranged from 11 to 24.7. Within groups, the average difference in age between individual group members and the group average had a median of 2.2 years, but could be as high as 10.2 years.
Adolescent Support Group Characteristics at Baseline (N = 34).

One group had no members matched to the EMR, so metrics of groups composition and within-group heterogeneity could not be calculated. bAverage difference in the absolute value between group member's age and the average age of the group. cProportion of participants who did not belong to the mode gender of the group. dProportion of participants who did not belong to the mode status at enrollment into HIV care (pediatric, PMTCT, or other routes) of the group.
Over the course of the first 12 months of the program, pharmacy appointment attendance was generally high, with groups reporting a median of 93% appointment attendance (range: 42%-100%). When considering group performance on indicator one, the median pharmacy visits attendance increased slightly from quarter 1 (91%) to quarter 4 (100%), but the lower end of the range increased more dramatically from 14% in quarters 1 and 2 to 28% and 52% in quarters 3 and 4 (Figure 1). Similarly, over the first 12 months group members contributed a median of $9.70 to their savings account (range: $0.00, $17.17). When considering group performance on indicator 2, median group achievement was at least 80% of their target for both quarter 2 and quarter 4. When considering group performance on indicator 3, the median percentage of viral load suppression among groups was 100% (range: 33%-100%). In the first year of the program, median annual incentive earned according to the rules of the program per group member was $46.87 (range: $21.21-$67.68). However, the median annual incentive received was $57.46 (range: $21.21-$139.49). The biggest discrepancies between money earned and money received occurred in Kirehe in the third quarter of the 2018/2019 fiscal year, where incentives were doubled at most of the health centers. The awarding of surplus money in Kirehe occurred partly in an effort to allow those groups to attain similar savings levels as what had occurred in Kayonza.

Indicator performance among adolescent support groups, N = 34.
When assessing the relationship between groups’ characteristics and overall indicator performance, we found that a higher proportion of males in the group was associated with worse indicator performance (β = −11.1, 95% CI: −21.3, −0.9, P = .03, Table 4). We did not find statistically significant associations between remaining group characteristics and overall indicator performance, but the magnitude of effect was large for the proportion of PLHIV who were pediatric enrollees (β = −6.2, 95% CI: −13.5, 1.1, P = .09), for the proportion of heterogeneity in sex within-group (β = −11.0, 95% CI: −23.6, 1.6, P = .08), and for the proportion of members who entered HIV treatment through the pediatric program (β = −6.2, 95% CI: −13.5, 1.1, P value = .09) ].
Results from Univariate Linear Regressions Assessing the Relationship Between Group Characteristics and Indicator Performance (N = 34).
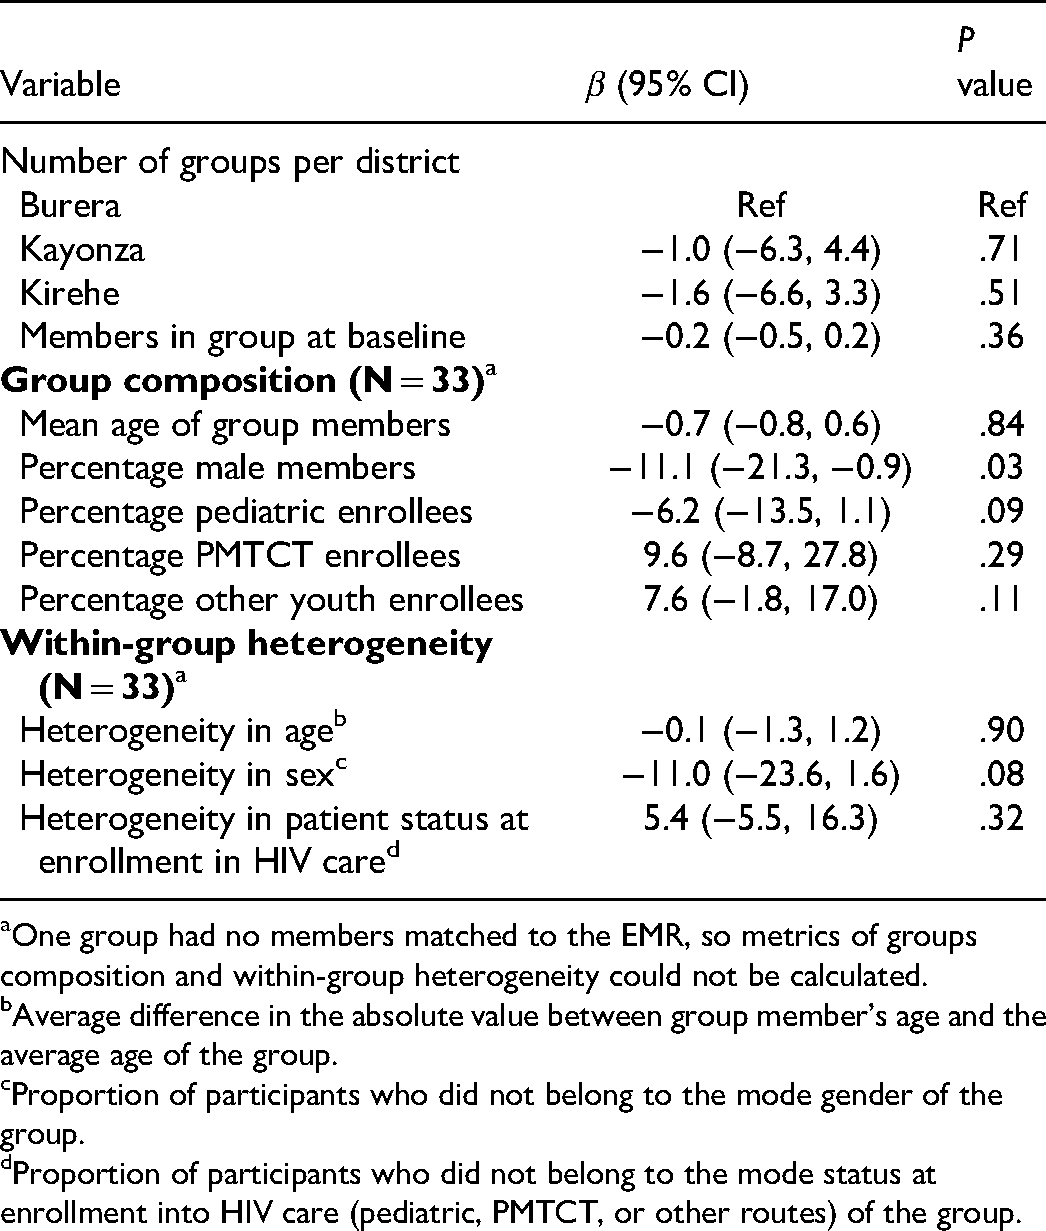
One group had no members matched to the EMR, so metrics of groups composition and within-group heterogeneity could not be calculated.
Average difference in the absolute value between group member's age and the average age of the group.
Proportion of participants who did not belong to the mode gender of the group.
Proportion of participants who did not belong to the mode status at enrollment into HIV care (pediatric, PMTCT, or other routes) of the group.
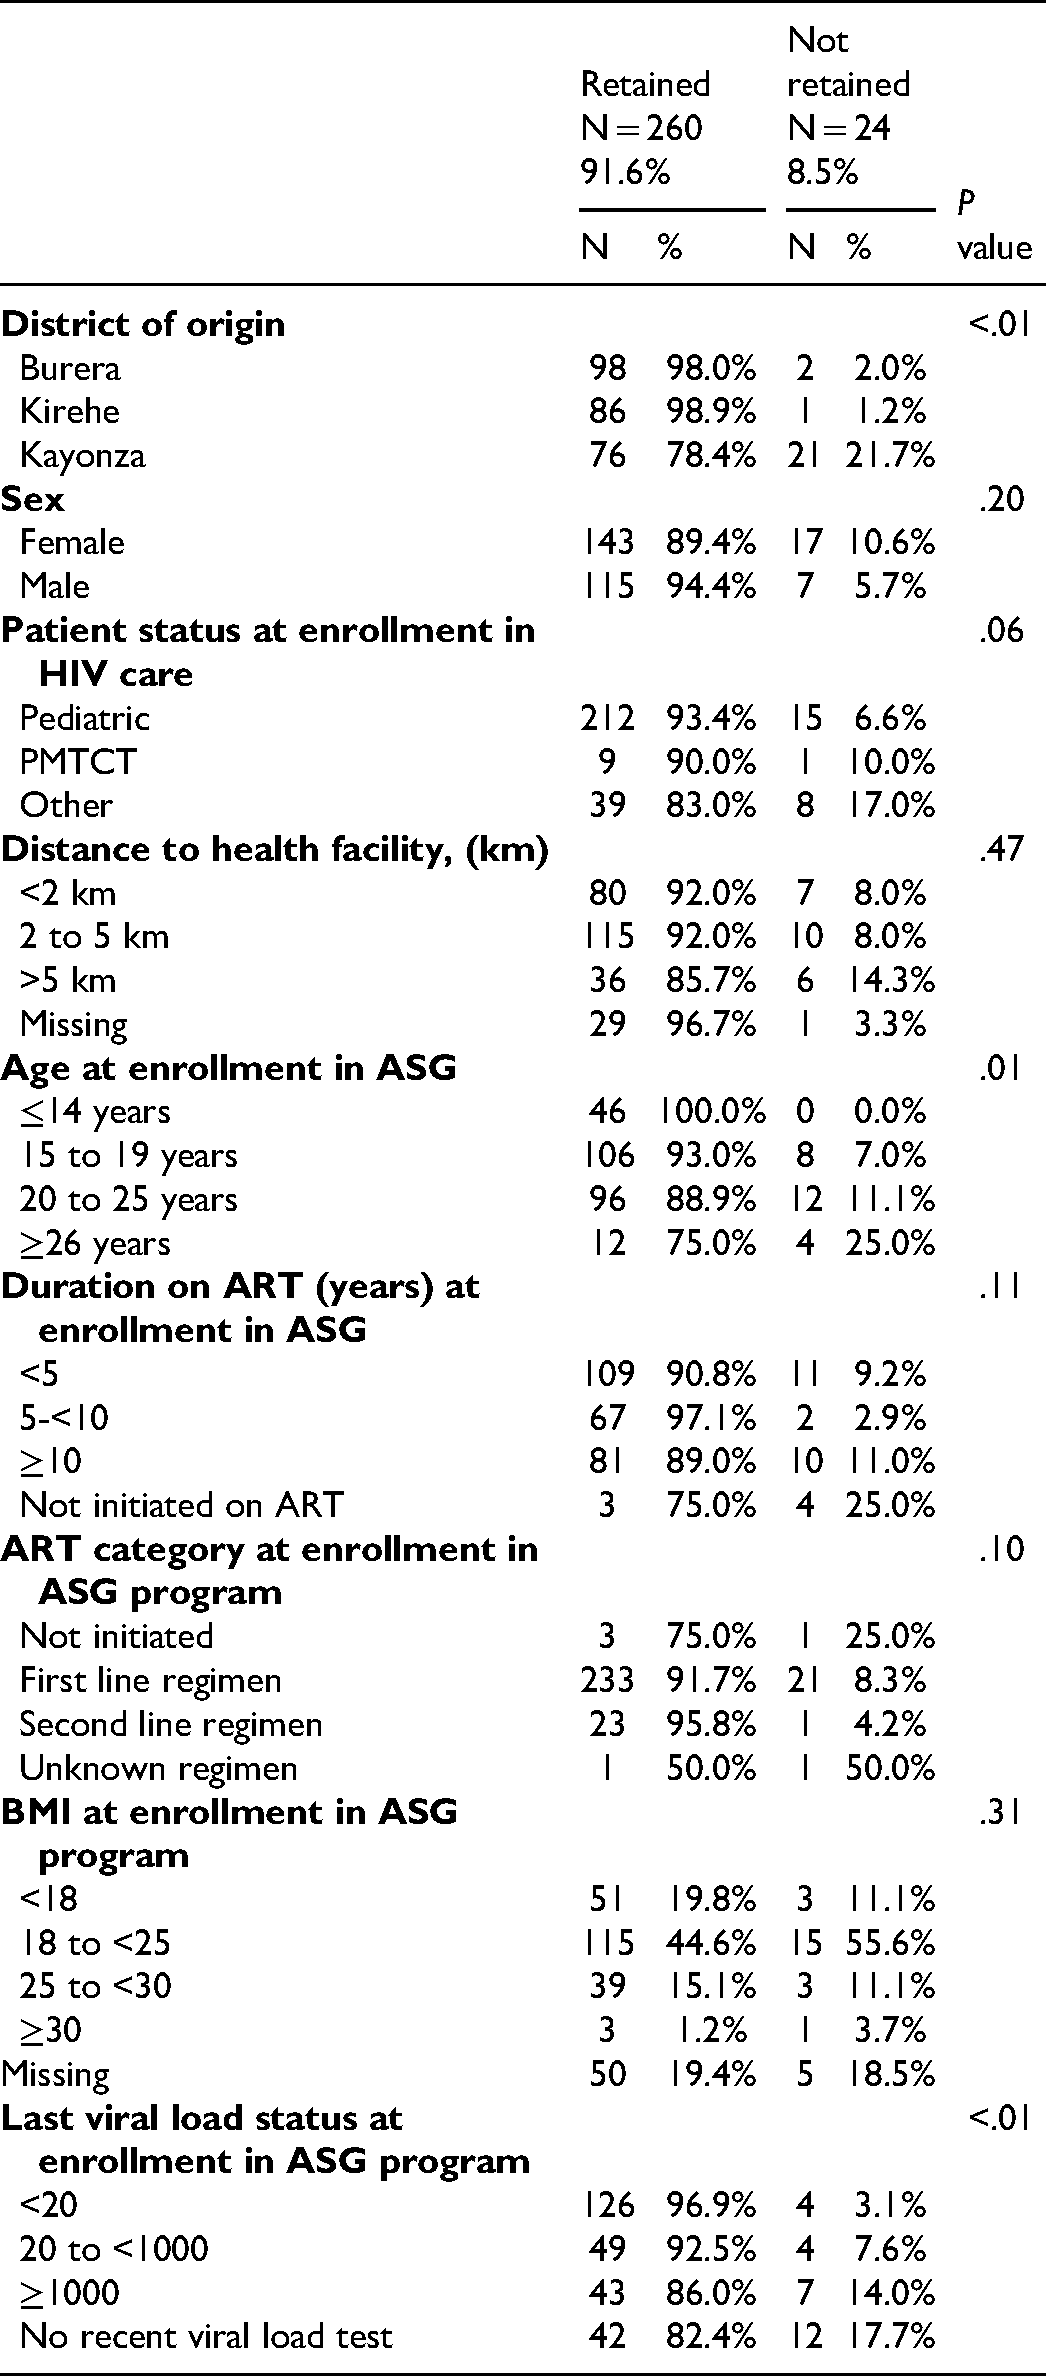
Overall, 296 (91.4%) ASG members were retained in the ASG program. Three youth who left the program exited because they tested as HIV negative. Among the remaining 284 participants in the ASG program who were linked to the EMR, retention was significantly associated with district, with youth in Kayonza being at greatest risk for poor retention (21.7%). Older age at enrollment in the ASG program and having higher viral load results at last recent viral load tests were also significant predictors of poor adherence (Table 5).
Predictors of Retention in the Adolescent Support Group Program (N = 284).
Discussion
Our assessment of the implementation of the ASG program identified several areas where the initial program design was either adapted or imperfectly implemented. Changes in the program occurred in terms of member eligibility, group creation, indicator evaluation, and awarding of incentives. In this program, adaptation occurred to reflect field realities and to address challenges that would be barriers to effective implementation, as has occurred in other settings.25,26 However, some of the changes were unplanned and may have affected the effectiveness of the intervention.
In terms of group creation, over a fifth of group members were outside the target age range of 15 to 25. Group size was not consistently limited to 10 to 15 members, resulting in some groups with as few as 2 members and others with as many as 33 members. Especially in Kayonza, new youth members were allowed to enroll into the group even after awards had been provided for the first quarter. Partly due to these inconsistencies in group creation, we observed substantial heterogeneity both between and within groups. In general, this group heterogeneity suggests to us that the intervention was appealing to a wide range of PLHIV, not just to youth. For example, the group with the average age of 11.5 reflected a group of pediatric children living with HIV aged 1 to 12 who were accompanied by their mothers, and the mothers rather than the youth may have been the primary recipients of peer support in this group. Although we did not observe that metrics of within-group heterogeneity were associated with worse group performance, our sample size was small and some of the effect sizes were large in magnitude. In general, we would recommend future implementers to more purposefully consider how the mixture of members’ ages, gender, and treatment history could impact the feasibility of peer support during counselling and training sessions.
We found that the scoring of indicator 1, which focused on pharmacy attendance, and indictor 2, which focused on savings, were consistently implemented in all 3 districts and no changes to the indicator definition were necessary. One of the key features of indicator 2 was that groups set their own savings target, for example, by choosing whether members would target to save 500 or 1000 RWF per month. We believe that allowing the groups to identify a customized target that reflected their financial constraints may have contributed to good achievement on this indicator. On the other hand, indicator 3 was difficult to implement and had to be adapted. There were 2 difficulties in implementing indicator 3. First, although viral loads are assessed throughout the year, the viral load indicator was only calculated at the end of the last quarter. Second, the return of viral load results is often delayed. These factors led to a long lag between viral load testing and awarding of incentives and meant that many individuals were unable to be evaluated for viral load suppression in quarter 4. In line with previous recommendations that incentives work best when they are provided soon after the positive behavior, 27 a better strategy may have been to provide flat, per-person incentives that were awarded whenever a suppressed viral load result was achieved, without using the stepwise reduction in incentives used for indicators 1 and 2. In addition to enhancing youths’ motivation, simplifying the calculation of and the awarding schedule for incentives may be a critical step in enhancing the feasibility of implementing this program in public health facilities that do not have additional support from international NGOs. Finally, indicator 4 was discontinued because not all health facilities had enough PLHIV to create a second group.
Awards provided for indicator performance were higher in practice than in the original design. Although the changes to the incentive structure always favored the youth, it is not known how that change could have affected youth perceptions of the program. Insights from behavioral economics highlight how small changes in incentive structures can meaningfully alter PLHIV's psychologic responses to incentive programs.27,28 Consequently, it is possible that unannounced changes in incentives negatively impacted group performance if they were not perceived as fair. Ultimately, groups received a median of 57 USD per person in the first 12 months of this program, which is approximately equivalent to 3 months’ earnings for a rural Rwandan farmer (21 USD per month). 29 This level of incentives is similar to what has been reported in other studies 28 and with the incentives provided through the only youth-focused interventions that combines peer support groups and economic incentives. 21 Our program and Gálarraga et al. both provided incentives based on group-based performance indicators to create positive peer pressure. Additionally, Gálarraga et al. provided some incentives based on individual-level performance. A second critical difference is that Gálarraga et al. provided the incentives in cash directly to the youth, while our incentives were deposited into a joint savings account for investment in future economic activities. Future programs should carefully consider how these small differences in the structure of incentive provision could affect group dynamics and individual accountability.
Our intervention did have some key successes. First, indicator achievement was quite high for pharmacy attendance, achieving target savings, and median viral load suppression. However, without a comparison group it is unclear whether this achievement can be attributed to the intervention. Second, although retention was lower in Kayonza, the first district where the program was implemented, than in the other 2 districts, retention was very high overall (90.5%). This high retention rate also suggests a high acceptability of the program among youth. Although this study is primarily descriptive and does not formally assess the program's effectiveness, other similar programs have improved adolescent health.30,31 A retrospective cohort study that will investigate the effectiveness of our program on clinical outcomes as well as a qualitative study to assess youth perspectives are currently underway. Unlike in the current paper, which reports group performance on indicators that were extracted from the ASG quarterly evaluation form and used to allocate incentives, our retrospective cohort study will (1) focus on individual level outcomes, (2) include a comparison group, and (3) rely exclusively on data extracted from the EMR.
Our paper has several limitations. First, the primary data source for this study was quarterly reports, which were usually completed by the health care provider and sometimes had missing data or included inaccuracies, such as discrepancies between the attendance tables and calculations of the attendance indicators. Additionally, health providers may have over-reported group performance in an effort to maximize incentives for their beneficiaries, therefore creating discrepancy between real and reported ASGs indicator performance. Second, we were unable to match 11.4% of the adolescent group members to the EMR, which resulted in additional missing data and a reduction in sample size. Third, for our analysis of the association between group characteristics and group performance, our sample size was very small. Several of the effect sizes we observed were large in magnitude and could be clinically relevant factors to consider in future programs. Finally, our intervention was conducted in a rural setting and may not be generalizable to urban areas where the cost of living is generally higher and larger incentive levels may be necessary to motivate behavior change.
Conclusion
This study suggests that, after minor adaptations, the ASG program was feasible to implement and was acceptable and well-received among participants. We have also identified several recommendations for those seeking to develop a similar intervention in the future. First, predefine the extent to which between-group and within-group heterogeneity will be allowed. Second, allow groups to customize indicators in a way that reflects their social and economic realities. Third, award indicators in a way that is timely to enhance feasibility of assessing the indicator and to encourage individual accountability. Finally, design incentives in a way that promotes both positive peer pressure and individual accountability. Further investigation is needed to assess the effectiveness of this intervention and better understand beneficiaries’ perspectives.
Footnotes
Declaration of Conflicting Interests
The authors declared no potential conflicts of interest with respect to the research, authorship, and/or publication of this article.
Funding
The authors disclosed receipt of the following financial support for the research, authorship, and/or publication of this article: This work was supported by the Harvard University Center for AIDS Research (grant number HU CFAR NIH/NIAID fund 2P30AI060354-16 and 5P30AI0, N/A). DAB is supported by the Harvard Medical School Global Health Equity Research Fellowship, funded by Jonathan M. Goldstein and Kaia Miller Goldstein.