
Abstract
Introduction
Knee osteoarthritis (KOA) is a common chronic disease manifested by articular cartilage degradation, bone remodeling, osteophyte formation, and eventually the loss of joint space widths (JSW). 1 Indisputably, KOA affected the function of joints and reduced the quality of life, even led to disability, and finally incurred enormous social and economic burdens.2–4
Although the long and wide implementation since its generation in 1957, Kellgren-Lawrence (KL) staging system of KOA still had some deficiencies. 5 KL staging based on radiographs has gradually exerted the shortcoming in terms of the ambiguous differentiation due to its non-quantitative depiction on the morphological change especially in patients at the early stage of KOA, leading to the uncertainty in hierarchical remedy. In recent decades, despite numerous attempts based on X-rays on modifying this classification, none has been widely recognized; moreover, the non-quantitative traits of KL staging were hardly radically revolutionized.6,7
With the popularity of MRI, the perception of KOA has been rapidly upgraded, pathological change including cartilage injuries (CI), and bone marrow lesions (BML) were realized their diagnostic significance. 8 However, an integrated algorithm encompassing X-rays and MRI considering JSW, CI, BML has never been generated for better KOA grading.
Therefore, in this study, we aimed at investigating the differences on X-ray and MRI among each stage of KOA and further figuring out a new staging system which called West Lake (WL) staging orchestrated with JSW on X-rays and CI, BML on MRI.
Materials and methods
Patients’ enrollment
Patients diagnosed with KOA and treated in our institution from 2013 to 2018 were retrieved on the hospital information system (HIS). The inclusive criteria were (1) knee OA; (2) with both eligible MRI and X-rays document on knee; (3) with entire case record. The exclusive criteria were (1) with at least one musculoskeletal comorbidity, including rheumatoid arthritis, hemophilia arthritis, ankylosing spondylitis, gout, and other painful diseases of the knee joint; (2) with complications affecting knees, including psoriasis, syphilitic neuropathy, ochronotic arthritis, metabolic osteopathy, and acute trauma; (3) the radiographs were unclear.
Eventually, a total of 220 patients met the criteria. Generally, the mean age was 53.68 ± 13.39; the majority was female.
Staging based on treatment protocols
Referring to the principle of stepwise treatment strategy of KOA, the treatment methods were divided into four steps: basic therapy, drug therapy, restorative therapy, and reconstructive therapy. Stage I, II, III, and IV were divided according to which step was effective. Whether the treatment was effective or not was judged according to whether the symptoms of the affected knee are significantly relieved after treatment
9
(Figure 1). Basic therapy included health education, exercise guidance, losing weight, rehabilitation training, and other non-drug treatment. Drug therapy included topical or oral NSAIDs and traditional Chinese medicine as well as oral glucosamine and intraarticular injection of glucocorticoids and sodium hyaluronate. Restorative therapy included intraarticular injection of mesenchymal stem cell and platelet-rich plasma as well as arthroscopy and osteotomy around the knee joint. Reconstructive therapy included partial and total knee arthroplasty. Patients who received basic therapy effectively were divided into stage I. Patients who received drug and basic therapy effectively were divided into stage II. Patients who received restorative, drug, and basic therapy effectively were divided into stage III. Patients who received reconstructive, restorative, drug, and basic therapy effectively were divided into stage IV.
X-rays
The X-rays were projected in weight-bearing standing position with knees in 20°of flexion and the feet in 5°of extorsion. 10 A line was made parallel to the axis of the tibia through the points on the surface of the femoral condyle, and the distance between the two straight lines was measured and defined as JSW. The narrowest JSW was recorded.
MRI
CI and BML were measured on 3T MRI scanner.
According to the Recht scores, CI were divided into 4 grades: Grade 0, normal articular cartilage; Grade I, articular cartilage degeneration while no cartilage defect; Grade II, cartilage defect and the depth of cartilage defect was less than 50% of the full thickness; Grade III, the depth of cartilage defect was more than 50% while less than 100% of the full thickness; Grade IV, full-thickness cartilage defect and subchondral bone exposed. 11
It was difficult to measure the area of BML on MRI and the current WORMs scores were too complex, so referring to WORMs scores, the MRI of knee joint was divided into 15 regions, including lateral patellar section, medial patellar section, lateral–anterior femoral section, lateral–central femoral section, lateral–posterior femoral section, medial–anterior femoral section, medial–central femoral section, medial–posterior femoral section, lateral–anterior tibial section, lateral–central tibial section, lateral–posterior tibial section, medial–anterior tibial section, medial–central tibial section, medial–posterior tibial section and “S” section (the non-articulating portion of the tibial plateau beneath the tibial spines). 12 Meanwhile, the number of regions involved in BML was evaluated.
Statistical analysis
Power analysis was performed for sample size. According to previous studies, the prevalence (p) of KOA was about 30%, and a conservative estimate put it at 29%. The allowable error (d) was set at 6%. A 2-tailed test was required with an alpha level (α) of 0.05. Using the standard formula
Stata/MP, version 16.0 was used for statistical analysis, and Receiver operating characteristic (ROC) curves were rendered by Medcalc, version 15.2.2. Statistical indicators included age, gender, JSW, the grade of CI, and the number of regions involved in BML. All data were presented as mean ± SD. The difference of those radiological parameters across the groups was calculated by T-test. Chi-square test was used to analyze the difference of gender among four groups. Logistic regression was used to adjust for confounders when there was a statistical difference in age or gender between the two groups. ROC curves were rendered to obtain the areas under the curves (AUC), maximum Youden index, and corresponding cut-off points. Agreement Index (KAPPA) was used to analyze the consistency of WL stages assessed by two qualified orthopedic surgeons. All reported p values are 2-tailed, with an alpha level of 0.05 indicating significance.
Results
Eventually, 25 patients were included in stage I; 62 patients were included in stage II; 109 patients were included in stage III; and 24 patients were included in stage IV.
Stage I/II
The results of T-test on age and chi-square test on gender among stage I, II, III, and IV.

The results of t-test among stage I, II, III, and IV on JSW, CI, and BML.

To rule out the effect of age on results, the logistic regressions included age and each indicator were done and showed there were still no statistical differences on JSW (B = 0.434, Wald = 2.164, p = 0.141, Exp(B) = 1.544, 95%CI (0.866, 2.752)), CI (B = 0.195, Wald = 0.601, p = 0.438, Exp(B) = 1.216, 95%CI (0.742, 1.992)), and BML (B = −0.099, Wald = 0.251, p = 0.617, Exp(B) = 0.905, 95%CI (0.613, 1.336)).
Stage II/III
There was statistical difference on gender (p < 0.05), while there was no statistical difference on age (p > 0.05) between stage II and III (Table 1).
There were statistical differences between stage II and III on JSW, CI as well as BML (p < 0.05). (Table 2)
To rule out the effect of gender on results, the Logistic regressions included gender and each indicator were done and showed there were still statistical differences on JSW (B = −5.440, Wald=26.361, p < 0.001, Exp(B) = 0.004, 95%CI (0.001, 0.035)), CI (B = 0.953, Wald = 27.172, p < 0.001, Exp(B) = 2.594, 95%CI (1.813, 3.712)) and BML (B = 0.451, Wald = 0.104, p < 0.001, Exp(B) = 1.569, 95%CI (1.280, 1.924)).
Respectively, to differentiate stage III from stage II, the cut-off points were JSW≤5.1 mm, CI>1, and BML>2 from ROC curves (Figure 2). The results of ROC curve between stage II and III. The ROC curve of JSW showed the AUC was 0.985, Youden index was 0.9424, cut-off point was 5.1 mm, meanwhile the corresponding sensitivity and specificity was 99.08% and 95.16% (a). The ROC curve of CI indicated the AUC was 0.759, Youden index was 0.3838, cut-off point was >1, simultaneously the corresponding sensitivity and specificity was 70.64% and 67.74% (b). The ROC curve of BML pointed the AUC was 0.712, Youden index was 0.4512, cut-off point was >2, simultaneously the corresponding sensitivity and specificity was 59.63% and 85.48% (c).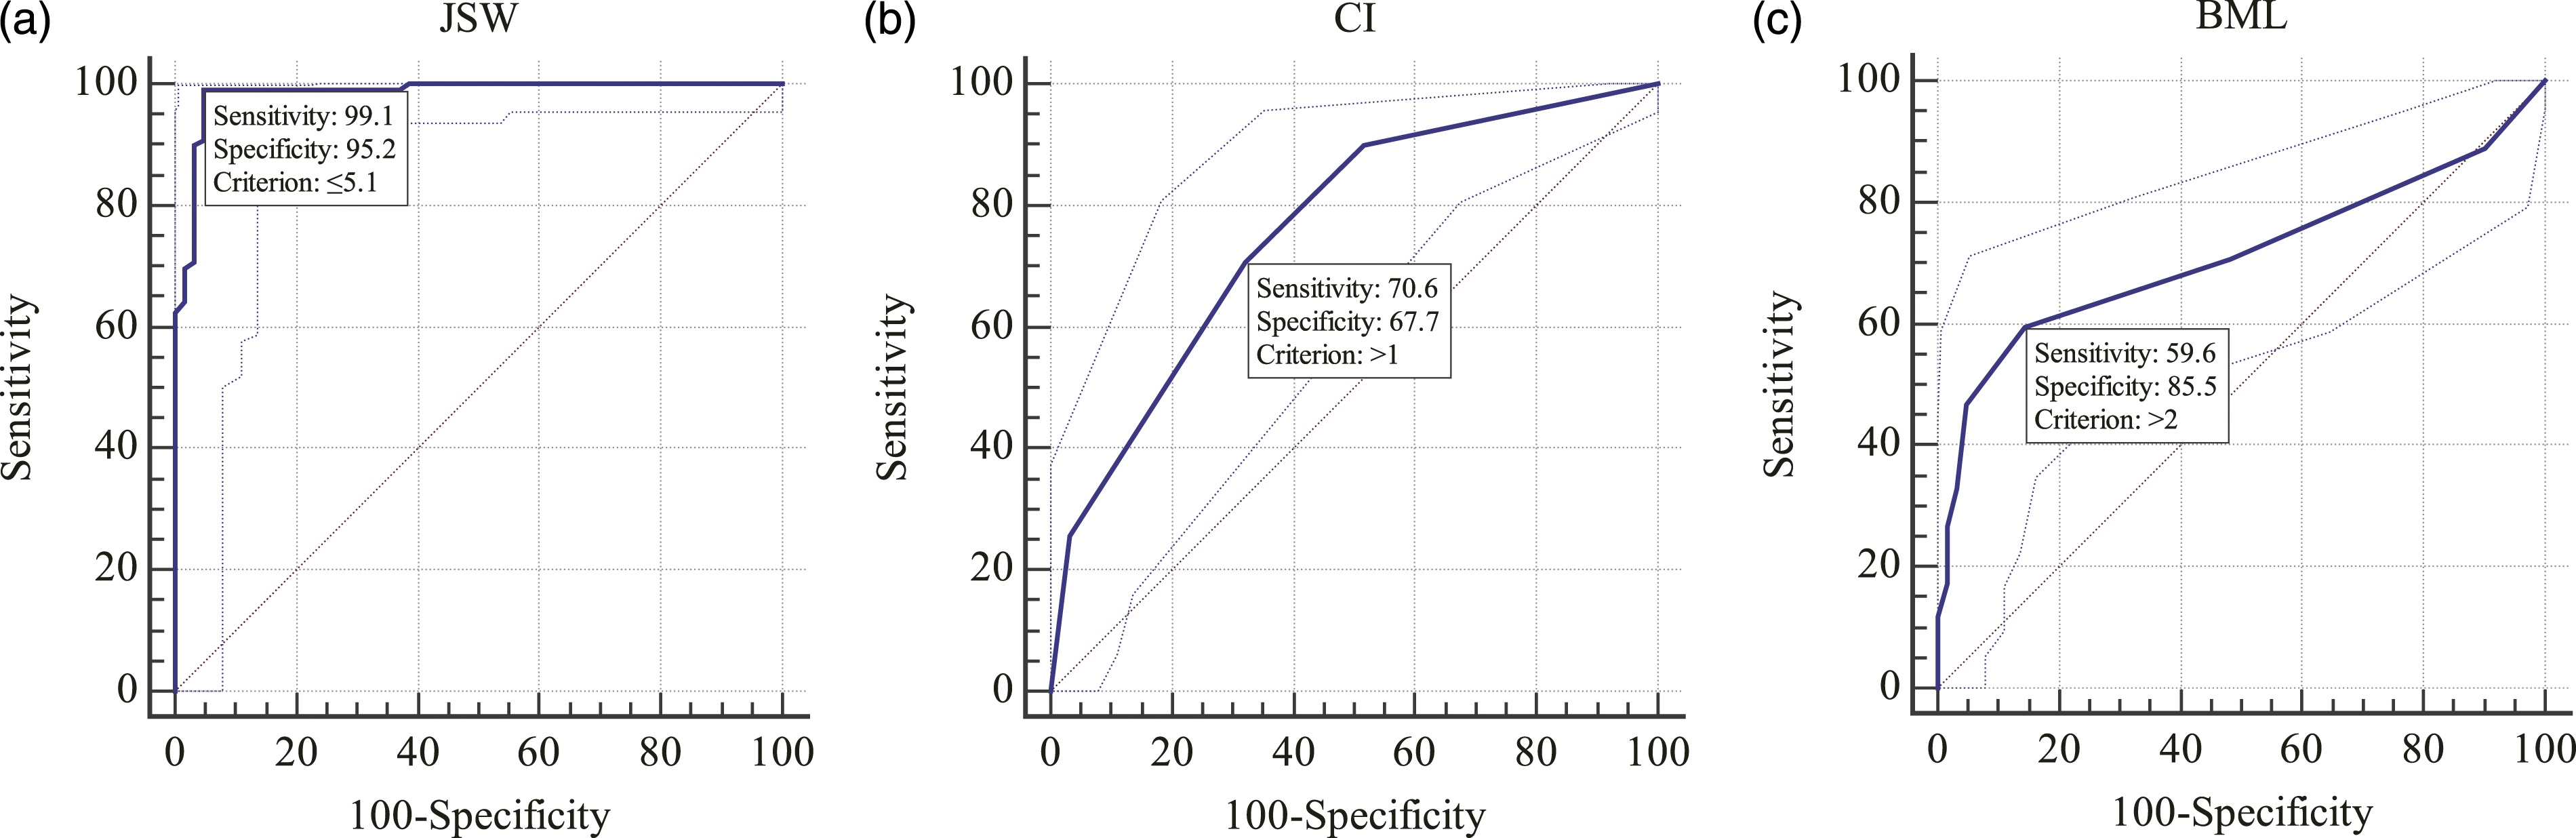
Stage III/IV
There was statistical difference on age (p < 0.05), while there was no statistical difference on gender (p > 0.05) between stage III and IV (Table 1).
There were statistical differences on JSW, CI, and BML between stage III and IV (p < 0.05) (Table 2).
To rule out the effect of age on results, the logistic regressions included age and each indicator were done and showed there were still statistical differences on JSW (B = −3.488, Wald =18.240, p < 0.001, Exp(B)=0.031, 95%CI (0.006, 0.151)), CI (B = 1.030, Wald = 17.021, p < 0.001, Exp(B) = 2.801, 95%CI (1.717, 4.570)) and BML (B = 0.264, Wald =11.685, p = 0.001, Exp(B) = 1.302, 95%CI (1.119, 1.514)).
Respectively, to differentiate stage IV from stage III, the cut-off points were JSW≤3.2 mm, CI>3, and BML>4 from ROC curves (Figure 3). The results of ROC curve between stage III and IV. The ROC curve of JSW showed the AUC was 0.956, Youden index was 0.8383, cut-off point was 3.2 mm, meanwhile the corresponding sensitivity and specificity was 87.50% and 96.33% (a). The ROC curve of CI indicated the AUC was 0.793, Youden index was 0.5799, cut-off point was >3, simultaneously the corresponding sensitivity and specificity was 70.83% and 87.16% (b). The ROC curve of BML pointed the AUC was 0.743, Youden index was 0.3781, cut-off point was >4, simultaneously the corresponding sensitivity and specificity was 70.83% and 66.97% (c).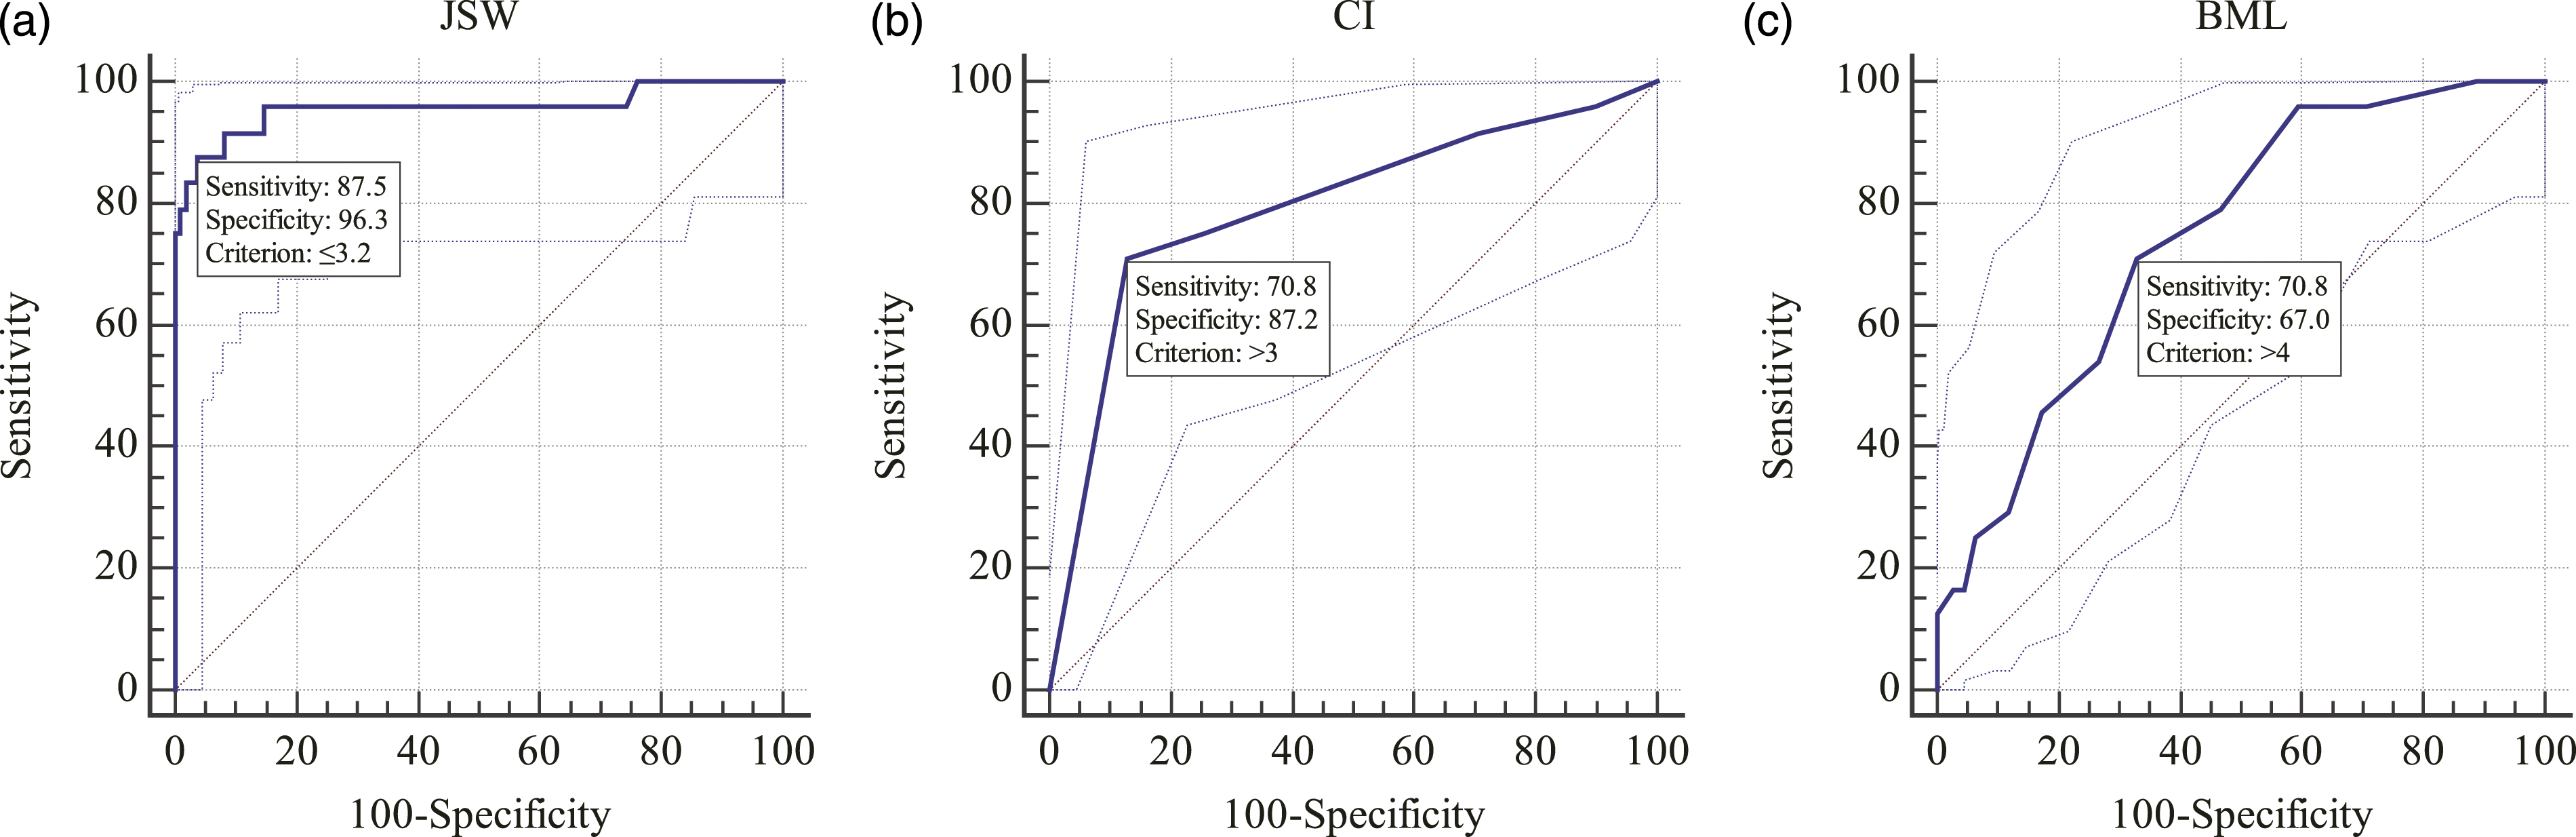
Agreement index (KAPPA)
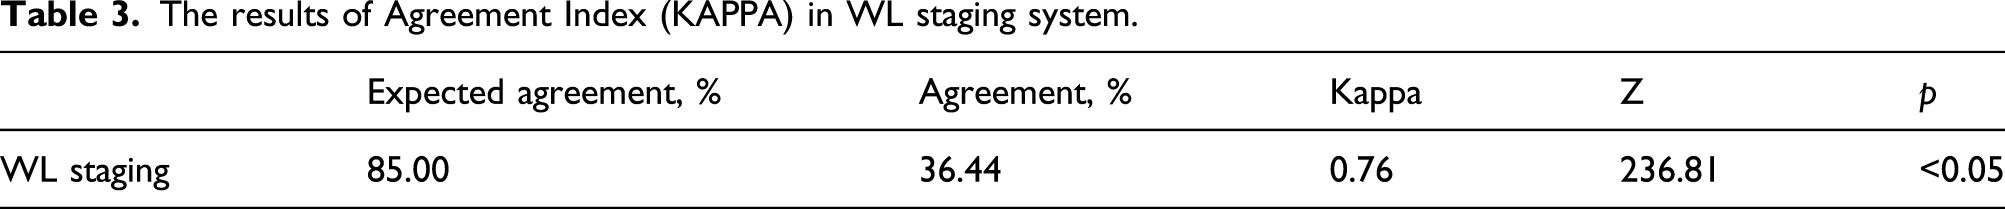
The results of Agreement Index (KAPPA) in WL staging system.
Discussion
To our knowledge, this was the first study combining MRI and X-ray features to classify KOA grades. Although X-ray was always the most available and convenient tool in the world for screening OA, previous literature uncovered intra-rater reliability ranging from 0.67 to 0.73 and hardship in distinguishing KL II and III by means of KL staging.13–15 Guermazi 16 proposed that KL staging had little information about the rate of cartilage degeneration through the comparison between same KOA patient’s X-ray and MRI. So, it was necessary to propose a new staging system so that every surgeon could agree on the severity of KOA.
For there was still a lack of an effective quantitative method to evaluate the number of osteophytes, the description of osteophytes in WL staging was removed. 17 On the contrary, JSW was easier to be measured and confirmed that had a significant association with the severity of KOA as well as knee pain.18,19
The mechanism of KOA could be summarized as follows: Abnormal mechanical loads were applied to the cartilage and transmitted to the subchondral bone, which led to microfractures of the subchondral bone, then an inflammatory response occurred and immune cells were recruited, which could activate bone growth factor and promotes subchondral bone reconstruction which led to the formation of BML finally.20–22 Current studies suggest that the pathogenesis of KOA is mainly the lesion of the cartilage layer, meanwhile BML could inform on the degenerative state within the osteochondral unit.23,24 In addition, BML has been known as a phenomenon to assess the severity and prognosis of KOA.25,26 So, CI and BML were included in the study.
In the study, we found there were no statistical differences on JSW, CI, and BML between stage I and II which let us to make the decision of merging them together. This may be because the JSW difference in early KOA is relatively small. Besides, osteophytes are a main tool to identify KL I or II in KL staging system, neglect of osteophytes may also play a role. 15 The possible reason for the failed correlation of CI between stage I and II was that maybe there was significant difference in the level of cartilage degeneration, it could not be shown by our CI scores. 27 It is well known that the formation of BML was closely related to cartilage injuries, with mild cartilage damage, the vicious cycle of BML formation was less severe which caused the mild BML in stage I/II. 28 In clinical, surgeons generally decide whether to use drug therapy or not through the patient’s pain, function, and other aspects in early KOA, so it is feasible to combine stage I and II. 29 In summary, the imaging findings (JSW, CI, BML) of stage I and stage II are similar, and we can judge whether to use basic therapy alone or combination of basic therapy with drug therapy according to the patient’s pain degree.
Dramatically, there were significant differences on JSW, CI, and BML between stage II and III as well as III and IV. ROC curves of JSW, CI, and BML showed the AUC was 0.99, 0.76, 0.71 in stage II/III and 0.96, 0.79, 0.74 in stage III/IV respectively which suggested high diagnostic value and JSW was the best indicator among them. Theoretically, a cut-off point with 100% sensitivity and 100% specificity is the most appropriate diagnostic value. While in practice, sensitivity decreases as specificity increases, and vice versa. So, a balance must be struck between sensitivity and specificity to obtain an optimal cut-off point. The Youden index is equal to (sensitivity + specificity −1) and when picked the maximum Youden index which meant optimal sensitivity and specificity, JSW ≤5.1 mm, CI >1, and BML >2 were the cut-off points to differentiate stage II and III, and JSW ≤3.2 mm, CI >3 and BML>4 were the cut-off points to distinguish stage IV from III. Although there was error in joint clearance measurements and people in different regions maid have different JSW, our study confirmed that compared with stage I and II, the JSW of stage III were narrow and JSW of stage IV were the most serious one, which has also been verified by previous studies.30,31 At present, no studies have explored the difference of CI between stage II and III, while it was known that narrowing of the joint space could reflect the degree of cartilage wear, so cartilage damage was gradually exacerbated with the increase of KL staging and full-thickness wear of the cartilage was often present in stage IV for the reason of extreme narrowing or loss of JSW. 32 Besides, it has been confirmed that partial and total knee arthroplasty is always used on patients with full-thickness cartilage defect. 1 Since we used the number of regions involved in BML as an indicator, no data were found in the current literature to support our results. However, we have known that the area of BML were associated with the progression of KOA, meanwhile BML size was associated with longitudinal cartilage loss.33,34
Agreement Index (KAPPA) is a tool to verify the consistency of WL staging between two qualified orthopedic surgeons. In further research, the KAPPA value was 0.76 which indicated their conclusions were highly consistent. This result showed that WL staging can be well unified among surgeons, which will be of great help to clinical treatment and academic discussion.
Our study still had several limitations. First, we did not take into consideration of synovium, joint effusion, ligaments, meniscus, and other imaging on MRI since they had no quantitative or semi-quantitative evaluative methods. Second, given the inadequate following period, we could not verify the validity of the new staging system; however, we will publish our short-middle term results of this grading later. Third, patellofemoral osteoarthritis was not included in this study, for patellofemoral osteoarthritis often exists as an independent concept while tibiofemoral was still the main body of KOA. For example, the KL staging system also only includes the tibiofemoral JSW. Certainly, we hope to conduct further statistical analysis of the patellofemoral JSW to make the staging system more complete in the following series of studies.
Conclusion
The WL staging system.

Footnotes
Declaration of conflicting interests
The author(s) declared no potential conflicts of interest with respect to the research, authorship, and publication of this article.
Funding
The author(s) disclosed receipt of the following financial support for the research, authorship, and/or publication of this article: The study was in part supported by the National Natural Science Foundation of China (grant nos. 81873324) and the project of Administration of Traditional Chinese Medicine of Zhejiang Province of China (grant no. 2018ZZ011).
Appendix
The MRI of knee joint was divided into 15 regions, including lateral patellar section, medial patellar section, lateral–anterior femoral section, lateral–central femoral section, lateral–posterior femoral section, medial–anterior femoral section, medial–central femoral section, medial–posterior femoral section, lateral–anterior tibial section, lateral–central tibial section, lateral–posterior tibial section, medial–anterior tibial section, medial–central tibial section, medial–posterior tibial section and “S” section (the non-articulating portion of the tibial plateau beneath the tibial spines). Meanwhile, the number of regions involved in BML was evaluated as BML area.