
Abstract
Purpose:
There are many radiographic parameters to evaluate developmental dysplasia of the hip joint (DDH); however, the priority between the parameters is unclear. We evaluated the priority of radiographic parameters in DDH.
Methods:
We retrospectively reviewed the radiographs of 82 consecutive patients aged above 85 years without hip osteoarthritis (OA; no osteoarthritis (NO) group), and 28 patients with early stage hip OA were set as the control group (OA group). We used the linear discriminant analysis (LDA) to consider the priority of the following parameters: acetabular roof obliquity (ARO), center-edge (CE) angle, Sharp angle, acetabular head index (AHI), and acetabular depth ratio (ADR).
Results:
The LDA of five different parameters revealed that the NO and OA groups could be almost distinguished with 83.6% accuracy (p < 0.0001, Wilks’ lambda test). The standardized scoring coefficients were as follows: ARO, −0.23; CE, −0.43; Sharp, −0.29; AHI, 0.97; and ADR, 0.11. The AHI was particularly noticeable in the NO group.
Conclusion:
Dissociation of the AHI in the OA group was significantly higher than that of the other parameters in the OA group compared to the parameters in the NO group. A small AHI may be a risk parameter for hip OA due to DDH.
Keywords
Introduction
Hip osteoarthritis (OA) is a common disease, which diminishes an individual’s quality of life and ability to carry out activities of daily living. In the Japanese population, over 70% of the hip OA cases have secondary hip OA caused by developmental dysplasia of the hip joint (DDH). 1,2 The resulting inadequate coverage of the femoral head causes its superolateral subluxation, leading to incongruity and instability of the joint. The disease progresses unless this biomechanical abnormality is corrected. Therefore, many types of joint-preserving periacetabular osteotomies have been developed and are reported to improve coverage of the femoral head to restore congruity and stability, prevent further deterioration of OA, and induce regeneration of the hip joint. 3 –5 Pelvic osteotomy, such as transpositional acetabular osteotomy or rotational acetabular osteotomy, is a useful hip joint-preserving surgery for DDH. 3 –5 However, there is little consensus regarding the parameters for confirming the presence of DDH and the ultimate target angle of the acetabulum to be achieved following surgery. When the acetabular correction is insufficient, there is a possibility of early conversion to total hip arthroplasty. 6,7
Although there are many reports describing the radiographic index of the acetabular angle, the borderline between a normal hip and mild dysplasia of the acetabulum is still difficult to determine. Patients with normal hip radiographic evaluation could still develop hip OA in the future. Conversely, some patients with DDH may not ever develop hip OA. The specific parameters that are most important to the stability of the hip joint are unknown.
Herein, we examined radiographic measurements of the acetabulum in participants above 85 years of age without hip OA, to identify the optimal target acetabular angles during pelvic osteotomy. The selected study population had reached an advanced age without developing hip OA, and thus it was assumed that they possessed an acetabular morphology that did not lead to degenerative hip OA. Therefore, the parameters present in this group of individuals without OA could be used as target parameters during hip osteotomy.
Materials and methods
This study adhered to the ethical guidelines of the 1975 Declaration of Helsinki, and the protocol was approved by the local institutional review board. Formal consent was not required as this was a retrospective study.
We retrospectively reviewed the radiographs of 82 consecutive patients aged above 85 years who underwent osteosynthesis of the femur or bipolar hemiarthroplasty to treat proximal femoral fractures between December 2014 and November 2015 (no osteoarthritis (NO) group). All the selected study participants were Japanese and did not have hip OA. The average age at the time of evaluation was 90.1 years (Table 1). As the control group, the current study recruited 28 patients with early stage hip OA (OA group). Early stage hip OA was defined as a Kellgren–Lawrence grade I or II 8 (Table 1).
Patient characteristics.

NO: no osteoarthritis; OA: osteoarthritis; SE: standard error.
Radiographic assessment
All patients underwent pelvic radiographic examination in the supine position preoperatively. We measured the following parameters: the acetabular roof obliquity (ARO), center-edge (CE) angle, Sharp angle, acetabular head index (AHI), 9 acetabular depth (AD), acetabular width (AW), and acetabular depth ratio (ADR: AD/AW × 1000) 10 (Figure 1).

Radiographic parameters: (a) ARO (°), (b) CE angle (°), (c) Sharp angle (°), (d) AHI ([A/B] × 100) (%), and (e) acetabular depth (A: AD), acetabular width (B: AW), and ADR (AD/AW × 1000). ARO: acetabular roof obliquity; CE: center-edge; AHI: acetabular head index; ADR: acetabular depth ratio.
We investigated the correlations among the acetabulum measurements and determined the differences in the acetabulum parameters between the hip NO and the hip OA groups. To evaluate the importance of each parameter, statistical analysis was performed as follows.
Statistical analysis
All numerical data are expressed as the mean ± standard error. The unpaired t-test as well as the χ2 test was used for patient characteristics or radiographic parameters between the two groups. Pair-wise associations between all variables were visually assessed using scatterplots, and were statistically evaluated using Pearson’s correlation and partial correlation coefficient. Following the visual inspection of the histograms and scatterplots, we tested the normality of the data with the Shapiro–Wilk test and the homogeneity of variance–covariance matrices using the Box’s M test (0.01 and 0.05 level of significance, respectively). We identified the parameters for differentiating the OA group from the NO group by conducting the linear discriminant analysis (LDA). In addition, a confusion matrix was calculated allowing better representation of the performance of the LDA. We then evaluated the capability of the predictive variables to discriminate the number of OA patients by constructing the receiver operating characteristic (ROC) curve and by calculating each area under the ROC curve (AUC). Statistical significance was set at p < 0.05 for each test. All of the statistical analyses were performed using the JMP Pro 14 software program (SAS Institute Japan Ltd, Tokyo, Japan) and MATLAB with statistical toolbox (MathWorks, Inc., Natick, Massachusetts, USA).
Results
There was no significant difference in the proportion of men and women between the two groups. However, there was a significant difference in the mean age between the two groups (p < 0.01; Table 1). In the comparisons between the hip NO and hip OA groups, significant differences were observed for all acetabular measurements (all p < 0.01; Table 2). Participants in the hip OA group showed values that were suggestive of DDH (Table 2). For the acetabular radiographic parameters, significant correlations were observed between all measurements in the NO group (all p < 0.01) (Figure 2).
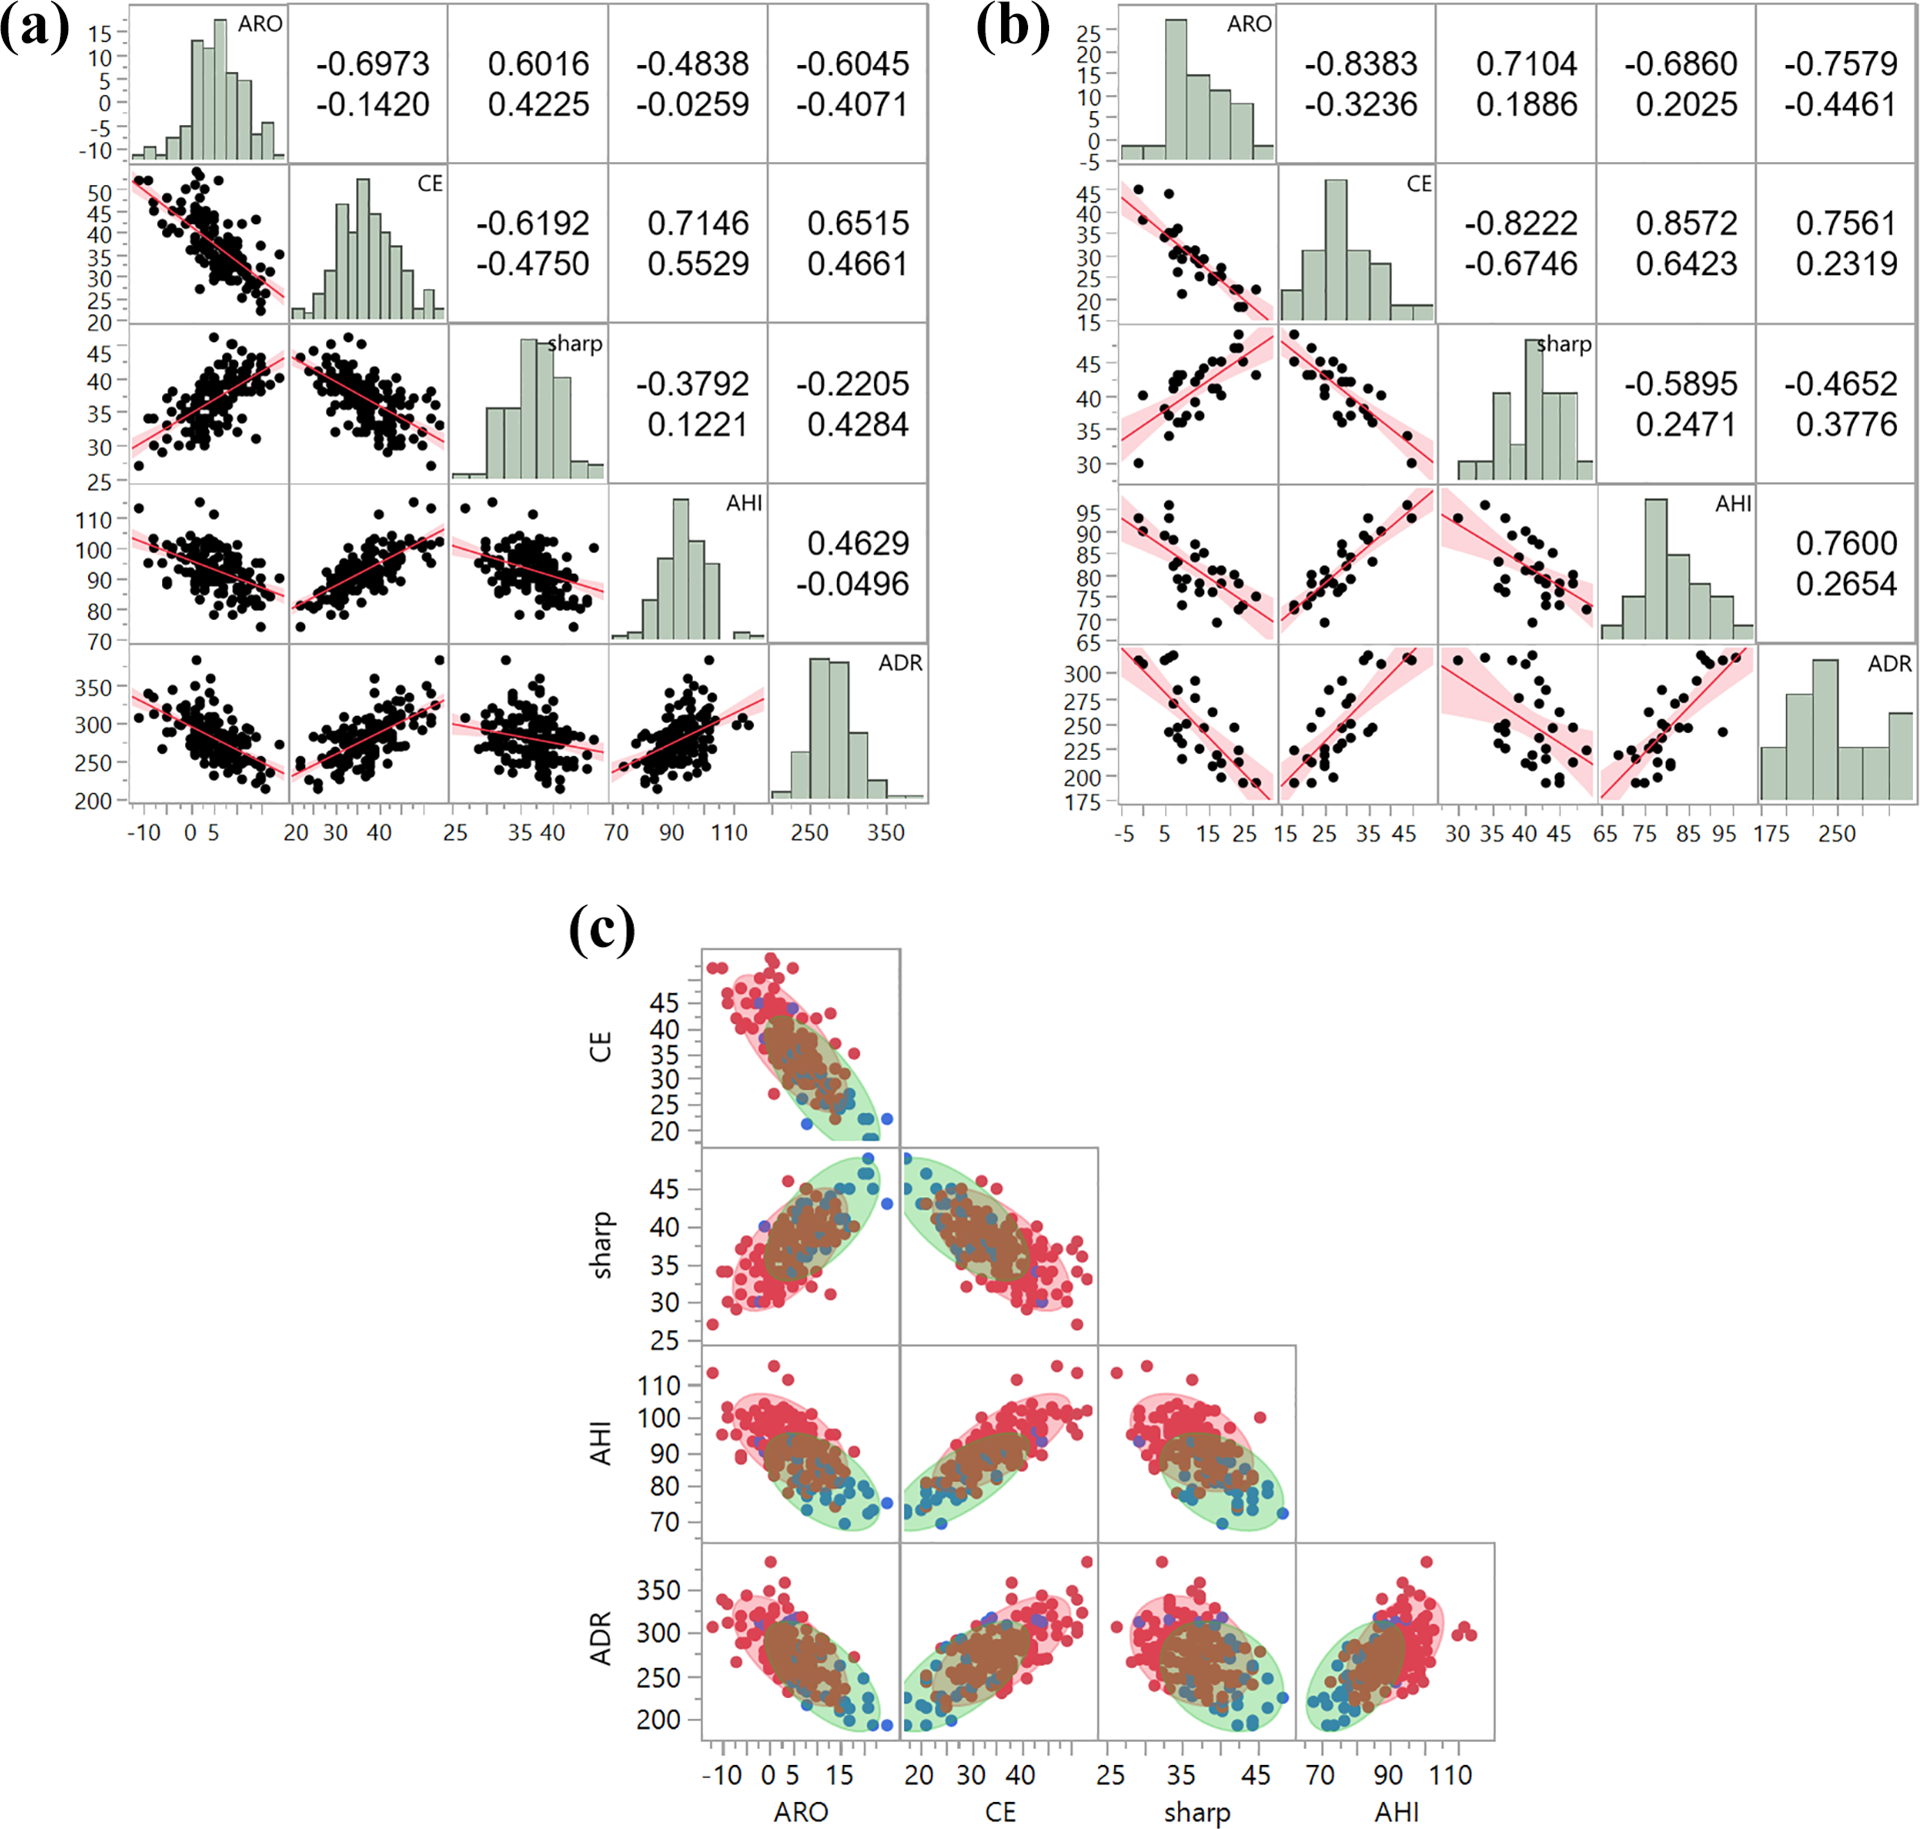
Relationships between radiographic measurement parameters. Scatterplot matrix and corresponding values of the correlation (upper) and partial correlation (lower) of (a) NO group, (b) OA group, and (c) overlapped distribution of NO (red) and OA (blue) groups. All correlations were statistically significant (p < 0.01). ARO: acetabular roof obliquity; CE: center-edge; AHI: acetabular head index; ADR: acetabular depth ratio; NO: no osteoarthritis; OA: osteoarthritis.
A scatterplot of all the Pearson’s correlation coefficient values showed strong (0.7 up to 0.8) or fair (0.4 up to 0.7) correlation, except for Sharp versus ADR in the NO group; all values were statistically significant (p < 0.01). By contrast, strong partial correlation was limited to only CE versus Sharp and CE versus AHI in the OA group. For this reason, we included all five parameters in the LDA as we confirmed evidence the stepwise feature selection protects against multicollinearity.
The assumption of normality was based on satisfactory acetabular radiographic parameters in each group (p > 0.1, Shapiro–Wilk test). The assumption test for homogeneity of variance–covariance matrices was not significantly different with a given significance level of 0.05 (p = 0.0506, Box’s M test); in short, their homogeneity was equal. The LDA using five different parameters revealed that the NO and the OA groups were distinguishable with a significant difference (p < 0.0001, Wilks’ lambda test) (Figure 3(a)). The standardized scoring coefficients were as follows: ARO, −0.23; CE, −0.43; Sharp, −0.29; AHI, 0.97; and ADR, 0.11. As a result, AHI was particularly noticeable in the NO group. In addition, CE was a relatively more common parameter in the OA group. The confusion matrix based on LDA showed an accuracy of 83.6% (Figure 3(b)). Figure 3(c) shows the ROC curve between the predicted and actual counts of the NO and OA groups. The AUC was 0.88 for each.

Classification of NO and OA. (a) A canonical plot resulting by a discriminant analysis based on ARO, CE, Sharp, AHI, and ADR. The NO and OA groups are shown in red and blue circles as distinct zones, respectively. The inner circle indicates the 95% confidence interval for each group mean, and the outer circle indicates the contour estimated to contain 50% of the population of each group. The relative length of a biplot ray parallel to the x-axis shows the degree of the variable represented by this ray for the respective group. (b) Confusion matrix for classification distinguishing OA from NO group. (c) ROC curve between predicted and actual counts of the OA group (blue line) and the NO group (red line). ARO: acetabular roof obliquity; CE: center-edge; AHI: acetabular head index; ADR: acetabular depth ratio; NO: no osteoarthritis; OA: osteoarthritis; ROC: receiver operating characteristic.
Comparison of the radiographic parameters in the two groups.
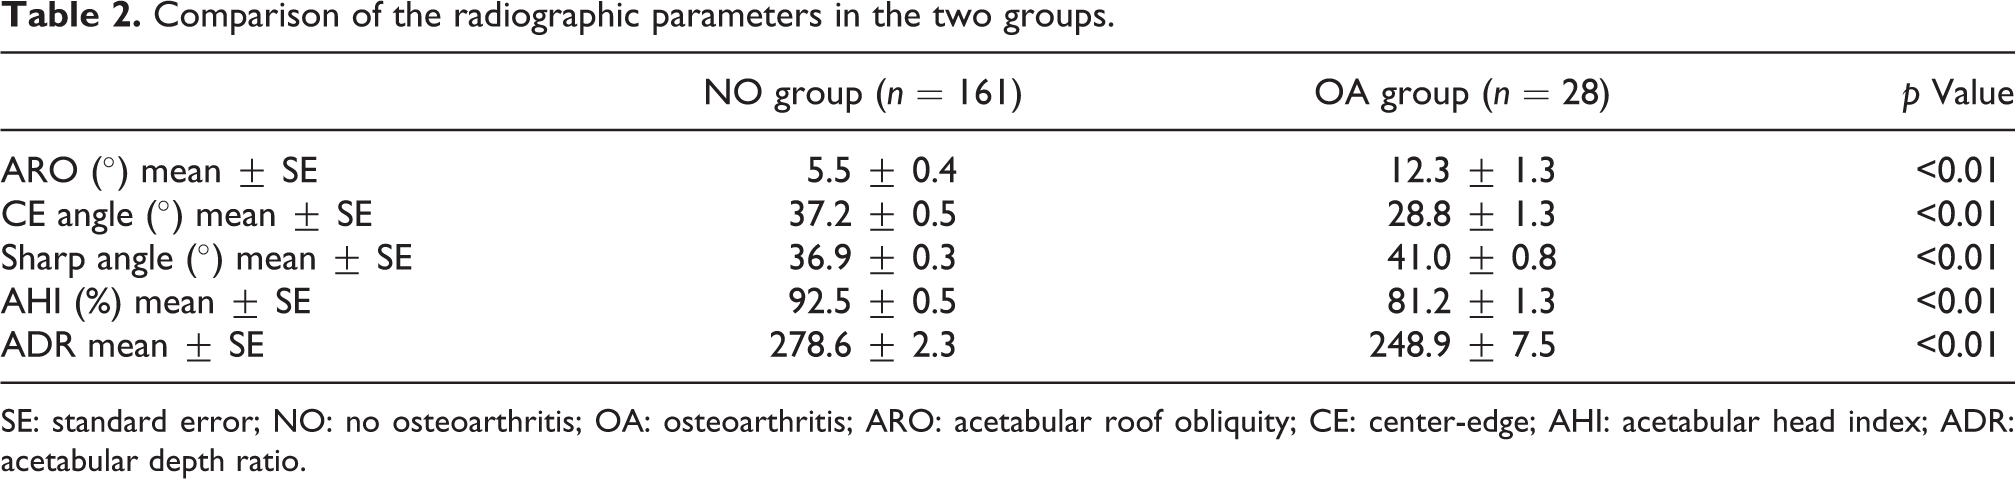
SE: standard error; NO: no osteoarthritis; OA: osteoarthritis; ARO: acetabular roof obliquity; CE: center-edge; AHI: acetabular head index; ADR: acetabular depth ratio.
Discussion
This is the first report to investigate the correlations between common acetabular measurements, and highlight the importance of each measurement in DDH.
The main cause of hip OA in the Japanese population is acetabular dysplasia. 1,2 Therefore, various types of acetabular osteotomies have been developed to improve coverage of the femoral head. 3 –5
Various parameters are used to diagnose DDH and to set the target form in periacetabular osteotomy. 4 –7,9 Hip pain was significantly correlated with CE, ADR, and AHI in an epidemiological survey among the Japanese population. 11 However, the roentgenogram measurements of significance in acetabular dysplasia are still unclear.
Several radiographic parameters have been described. In particular, the CE angle is widely used as a diagnostic parameter for DDH. 12 Additionally, in an epidemiological survey, the CE angle was used as an essential diagnostic measurement for DDH. 11,13 –15 However, some reports found no significant correlation between hip OA and DDH diagnosed using the CE angle. 14,15 One study suggested that periacetabular osteotomy for DDH should be performed with emphasis on improvement in not only the CE angle but also the ARO; however, the impact of ARO improvement on the postoperative clinical or radiographic results was not reported. 9
The normal values of the acetabular parameters are calculated from the epidemiological average value, and the diagnostic cutoff for DDH is defined by the dissociation from the average value. Therefore, pathophysiologically, the parameters as well as their values which present a risk for progression to hip OA are unclear. In this study, there were significant differences between the NO group and the hip OA group for all acetabulum parameters. So, it is possible that all parameters may play a role in the risk of developing secondary hip OA. However, based on the between-group comparisons alone, it is not clear which parameters have the strongest influence on the onset of secondary hip OA due to DDH.
Long-term prospective cohort studies can provide more reliable data on which parameters are important, but these are very difficult to conduct. There are no reports to date from such studies, and therefore, we investigated the priority of various parameters using the LDA.
For LDA, it has to be assumed that each data (1) have a normal distribution and (2) are with the same covariance matrix in each group. 16 Therefore, LDA has a higher limitation than logistic regression, support vector machine, and other similar kinds of classification methods. On the contrary, LDA is a simple and intuitive classifier technique. Canonical plots support the distribution of each group and the relationship of the contribution among the parameters. Moreover, the assumptions of multivariate normality and the same covariance are fulfilled, and in general, LDA shows a better performance. 17,18 For these reasons, we chose the LDA to discriminate between the NO and OA groups. Note that LDA is not the best way to work as the detection/diagnostic method because it cannot guarantee robustness to new patient data. 19 Therefore, further data accumulation and a method based on machine learning are considered to be more appropriate for the development of auxiliary methods for DDH diagnosis.
Our results show that the AHI in the NO group was most dissociated from the OA group in the LDA. This finding may be important when hip surgeons perform periacetabular osteotomy for patients with DDH.
There are several limitations associated with the current study. First, the study group was relatively small. However, this is a limitation of our selection criterion, because the population of NO individuals is small. Despite this limitation, this study provides critical preliminary data suggesting the importance of the AHI measurement compared to the other parameters. Second, the radiographs used were taken while the patient was in a supine position, because they were obtained from preoperative patients with proximal femoral fractures. Especially in elderly individuals, these radiographic parameters could be influenced by posterior inclination of the pelvis. However, perioperative radiographs for pelvic osteotomy are also usually taken with the patient in a supine position. A study of the differences in the angle between a standing and supine position is needed, particularly one that examines different age cohorts separately. Third, the risk parameters for hip OA due to DDH are multifaceted, and potential confounding parameters were not studied. Further investigation is needed to establish detailed risk parameters of hip OA due to DDH and the standard corrective value for periacetabular osteotomy in DDH.
In conclusion, we found significant correlations between the ARO, CE angle, Sharp angle, AHI, and ADR. However, the dissociation of the AHI in the OA group was significantly higher than that of the other parameters in the OA group compared to the parameters in the NO group. Therefore, a small AHI may be a risk parameter for hip OA due to DDH, and this finding could serve as the target in periacetabular osteotomy for DDH.
This finding may be important when hip surgeons perform periacetabular osteotomy for the patients with DDH.
Footnotes
Acknowledgment
The authors thank Dr T Hotokebuchi and Dr M Yoshida for their contributions to this study.
Declaration of conflicting interests
The author(s) declared no potential conflicts of interest with respect to the research, authorship, and/or publication of this article.
Funding
The author(s) received no financial support for the research, authorship, and/or publication of this article.