
Abstract
Purpose:
Rheumatoid arthritis (RA) patients with secondary osteoarthritis (OA) in a knee joint following a total knee arthroplasty (TKA) procedure have been increasing. Here, we investigated osteophyte formation in knee joints of RA patients and associated factors.
Methods:
We retrospectively examined findings of 35 knees in 30 RA patients (26 females, 4 males; mean age: 63.0 years; median disease duration: 15 years) who underwent TKA, including preoperative anteroposterior view radiographs of the knee joint. Using the ImageJ software package, osteophyte size in the medial femur (MF), medial tibia (MT), lateral femur (LF), and lateral tibia (LT) regions was also determined.
Results:
The mean femorotibial angle was 179°, while Larsen grade was 2 in 1, 3 in 12, 4 in 18, and 5 in 2 patients. Osteophyte sizes in the MF, MT, LF, and LT regions were 37.2, 17.0, 27.2, and 4.57 mm2, respectively, and significantly greater in the medial compartment (MC; MF+MT) than the lateral compartment (LC; LF+LT) (p < 0.001). In varus cases, osteophyte size in the MC was significantly larger than normal and valgus cases (p = 0.0016). Furthermore, osteophyte size in the MC was negatively correlated with the inflammatory markers C-reactive protein (r = −0.492, p = 0.0027) and erythrocyte sedimentation rate (r = −0.529, p = 0.0016), whereas that in the LC was negatively correlated with disease activity (r = −0.589, p = 0.0023).
Conclusion:
Our results suggest that alignment and disease activity influence osteophyte formation in RA patients, with secondary OA a more prominent symptom in RA patients with controlled inflammation.
Introduction
Rheumatoid arthritis (RA) is a chronic inflammatory autoimmune disease characterized by persistent synovitis and progressive destruction of cartilage and bones in multiple joints, which subsequently induces impairment of activities of daily living. Bone destruction is caused by an activation of osteoclasts by receptor activator of nuclear factor kappa-B ligand (RANKL), with erosion the most characteristic radiographic finding. Larsen classification, the most standard radiographic image classification method for RA, 1 classifies the degree of progress according to the presence and extent of bone erosion, or its absence, as well as bone atrophy, joint space narrowing, and bone deformity. Recently, the classification criteria for early diagnosis have been revised, 2 in which RA is diagnosed when atypical bone erosion is present. On the other hand, radiographic findings characteristic of osteoarthritis (OA) includes osteophyte formation, in addition to joint space narrowing and bone sclerosis. To distinguish OA from RA, it has been reported that the sensitivity of diagnosis can be improved by combining multiple findings, such as osteophyte formation and joint space narrowing. 3 Recent studies that used computed tomography (CT) images of fingers of RA patients have shown that osteophyte proliferation increases with age and disease duration as well as a correlation between bone erosion and osteophyte formation. 4 Those findings indicate that secondary OA progresses, the same as seen in RA.
Advancements in RA treatment in recent years with the development of disease-modifying anti-rheumatic drugs (DMARDs) have been remarkable, and symptoms of arthritis nearly disappear in treated patients due to the strong anti-inflammatory action of the drugs, with remission achieved in many. As a result, the need for RA-related surgery has shown annual decreases, 5,6 especially knee surgery and synovectomy 7 procedures, because synovitis in the knee joint of RA patients can now be treated with drugs. On the other hand, it has also been reported that the incidence of joint replacement surgery has not decreased, 8 which could be due to secondary OA in the knee joint of RA patients.
In the present study, we aimed to confirm secondary OA progression in knee joints of RA patients by quantitative evaluations of osteophyte size, considered to be a characteristic finding in OA, using images obtained just prior to undergoing total knee arthroplasty (TKA) surgery. We also examined the relationship between osteophyte size and patient background factors, disease activity, and degree of inflammation.
Patients and methods
Patients
We retrospectively examined radiographs of 35 knees in 30 consecutive patients with RA who underwent TKA from January 2013 to December 2016 and were recruited from the RA Outpatients Unit at Shiga University of Medical Science Hospital. All patients fulfilled the American College of Rheumatology (ACR) 1987 revised criteria 9 for diagnosis of RA or ACR/European League Against Rheumatism criteria 2010. 2 Written informed consent for data collection was obtained from each in accordance with the Declaration of Helsinki. This study was approved by the Shiga University Ethics Committee (number 26-136).
Demographic and disease-related data
Patient demographic and clinical characteristics, including age, gender, disease duration, Steinbrocker criteria, glucocorticoid dose, use of methotrexate (MTX) or biological DMARDs, serum C-reactive protein (CRP) concentration, erythrocyte sedimentation rate (ESR), simplified disease activity index (SDAI), and modified Health Assessment Questionnaire score, were obtained from the medical records (Table 1).
Characteristics of subjects.

SD: standard deviation; RF: rheumatoid factor; ACPA: anti-citrullinated protein antibody; MTX: methotrexate; GC: glucocorticoid; IFX: infliximab; ETN: etanercept; CZP: certolizumab pegol; TOF: tofacitinib; CRP: C-reactive protein; ESR: erythrocyte sedimentation rate; SDAI: simplified disease activity index.
Radiographic assessment and osteophyte analysis
Standard anteroposterior (AP) radiographs of the knees with a calibration ball and standing-view of the lower legs were taken preoperatively in all patients. Structural damage was assessed according to the method described by Larsen et al. 1 For osteophyte score, we used baseline AP radiograph images and graded each marginal osteophyte on a scale of 0–3 according to the Osteoarthritis Research Society International (OARSI) atlas. 10 For each knee, the following four sites were scored: medial tibia (MT), medial femur (MF), lateral tibia (LT), and lateral femur (LF). Larsen and OARSI grading were determined by two of the authors (NO, KK), who were blinded to subject IDs and background information. OARSI grading was nearly matched (weighted kappa values in MF, MT, LF, and LT: 0.956, 0.968, 0.971, and 0.981, respectively), and instances of disagreement were resolved by consensus.
Osteophyte areas were quantified by three of the authors (NO, KK, TY), each of whom are specialized orthopedic surgeons. Freehand selections were made around osteophytes in the following four sites: MT, MF, LT, and LF (Image J, National Institutes of Health, Bethesda, MD) (Figure 1). Osteophyte size was calculated using the size of the calibration ball as a reference (diameter 25.4 mm). The mean measured values determined by the three observers were used for analysis. To investigate intra-observer reliability, osteophyte size was measured twice with a 2-week interval, with the observers blinded to the previous measurements as well as subject ID and background information. For interobserver reliability, each was blinded to the results obtained by the other observers. Since 2014, we have routinely examined CT images obtained prior to performing TKA. Using CT results of 27 cases obtained preoperatively, osteophyte size was compared between radiograph and CT coronal images, with the images enlarged so as to evaluate the accuracy of the measurements. The sizes of osteophytes in the medial and lateral compartment were determined as the sum of the osteophyte areas in the medial (MT+MF) and lateral (LT+LF) sites. Total size was determined as the sum of the measured sizes in each site.
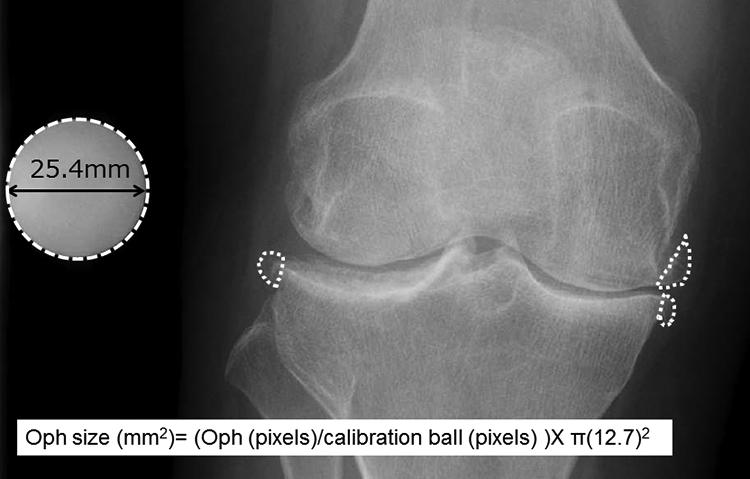
Measurement of Oph size using radiography findings. Osteophytes are shown encircled by white-dotted lines. Each osteophyte area was examined and the size calculated using the size of a calibration ball as a reference. Oph size (mm2) = (Oph (pixel)/calibration ball (pixel)) × π (12.7) 2 . Oph: osteophyte.
Statistical analysis
A Kolmogorov–Smirnov test was performed to examine the distribution of data, with values expressed as the mean ± SD or median (Inter Quartile Range: IQR), as indicated in the figure legends. All obtained data were evaluated using a Wilcoxon-signed rank test, Spearman’s rank correlation coefficient, Jonckheere–Terpstra test, Kruskal–Wallis test, Bonferroni test, and Mann–Whitney U test. The values of p < 0.05 were considered to indicate statistical significance. All statistical analyses were performed using EZR (Saitama Medical Center, Jichi Medical University, Saitama, Japan), a graphical user interface for R (The R Foundation for Statistical Computing, Vienna, Austria), which is a modified version of the R commander designed to add statistical functions frequently used for biostatistics. 11
Results
Study population characteristics
Mean patient age at the time of the operation was 63.0 ± 9.80 years, and median disease duration was 15 years (range 12–25.5 years), while the rates of MTX, glucocorticoid, and DMARDs usage were 57.1%, 51.4%, and 37.1%, respectively. Preoperative Larsen grade was 2, 3, 4, and 5 in 1, 12, 18, and 2 patients, respectively, and the mean range of motion of the knee joint was 118° for flexion and −10° for extension. The mean femorotibial angle (FTA) was 178 ± 13.6°, with varus (FTA > 180°, n = 14) more frequent than valgus (FTA < 170°, n = 7) cases (Figure 2).
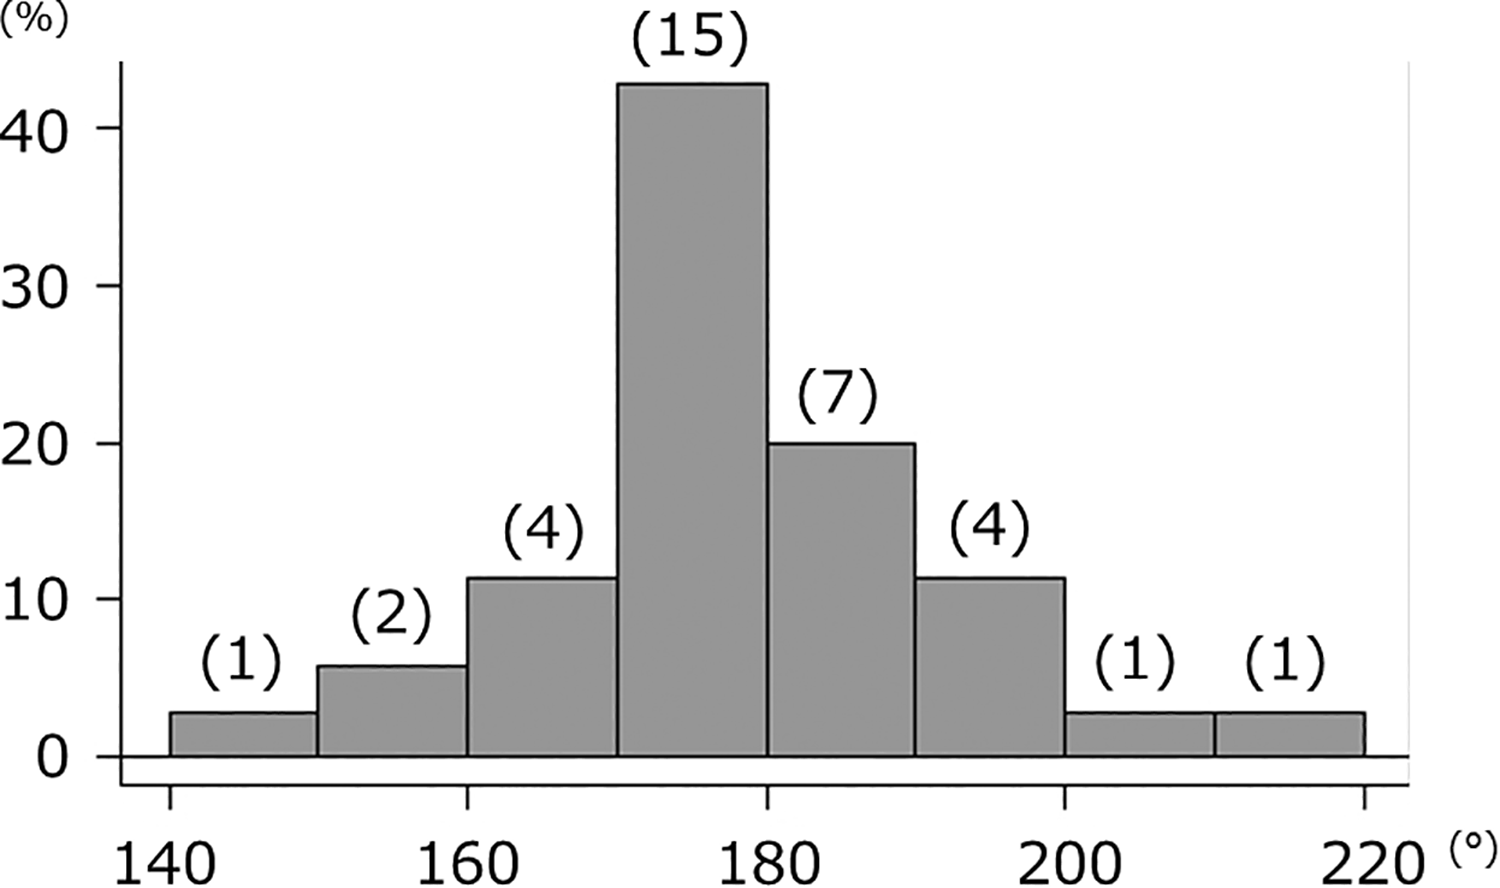
Histogram showing frequency of FTA. Normal alignment (170° < FTA < 180°) was most common in the present patients, though there were more varus alignment than valgus alignment cases. FTA: femora-tibial angle.
Inter- and intra-observer reliability, and comparison of CT images and OARSI grading
Table 2 presents the results regarding inter- and intra-observer reliability for the measurement method. In each region, ICC was >0.70, and thus, we concluded that the method used was reliable. Osteophyte size was largest in the MF region (37.2, 26.3–62.1 mm2), followed in order by the LF (27.2, 10.7–41.1 mm2), MT (17.0, 9.12–35.9 mm2), and LT (4.57, 0.66–19.1 mm2) regions. Furthermore, osteophyte size was significantly larger in the medial than the lateral compartment (60.8 (34.6–104.6) vs. 30.6 (13.0–68.6) mm2; Wilcoxon-signed rank test, p < 0.001). In the CT images (n = 27), a strong correlation was observed for each region (MF: r = 0.756, p < 0.001; MT: r = 0.804, p < 0.001; LF: r = 0.711, p < 0.001; LT: r = 0.816, p < 0.001; Spearman’s rank correlation coefficient) (Figure 3), which indicated that osteophyte size could be accurately measured by the present method using radiograph images. In comparison with OARSI grade, each region showed a significant increasing tendency by grade (Jonckheere–Terpstra test; all sites, p < 0.001) (Figure 4), again confirming that osteophyte size could be accurately quantified by use of this method.
Inter- and intra-observer reliability for each region.

ICC: intra-class correlation coefficient; CI: confidence interval; MF: medial femur; MT: medial tibia; LF: lateral femur; LT: lateral tibia.
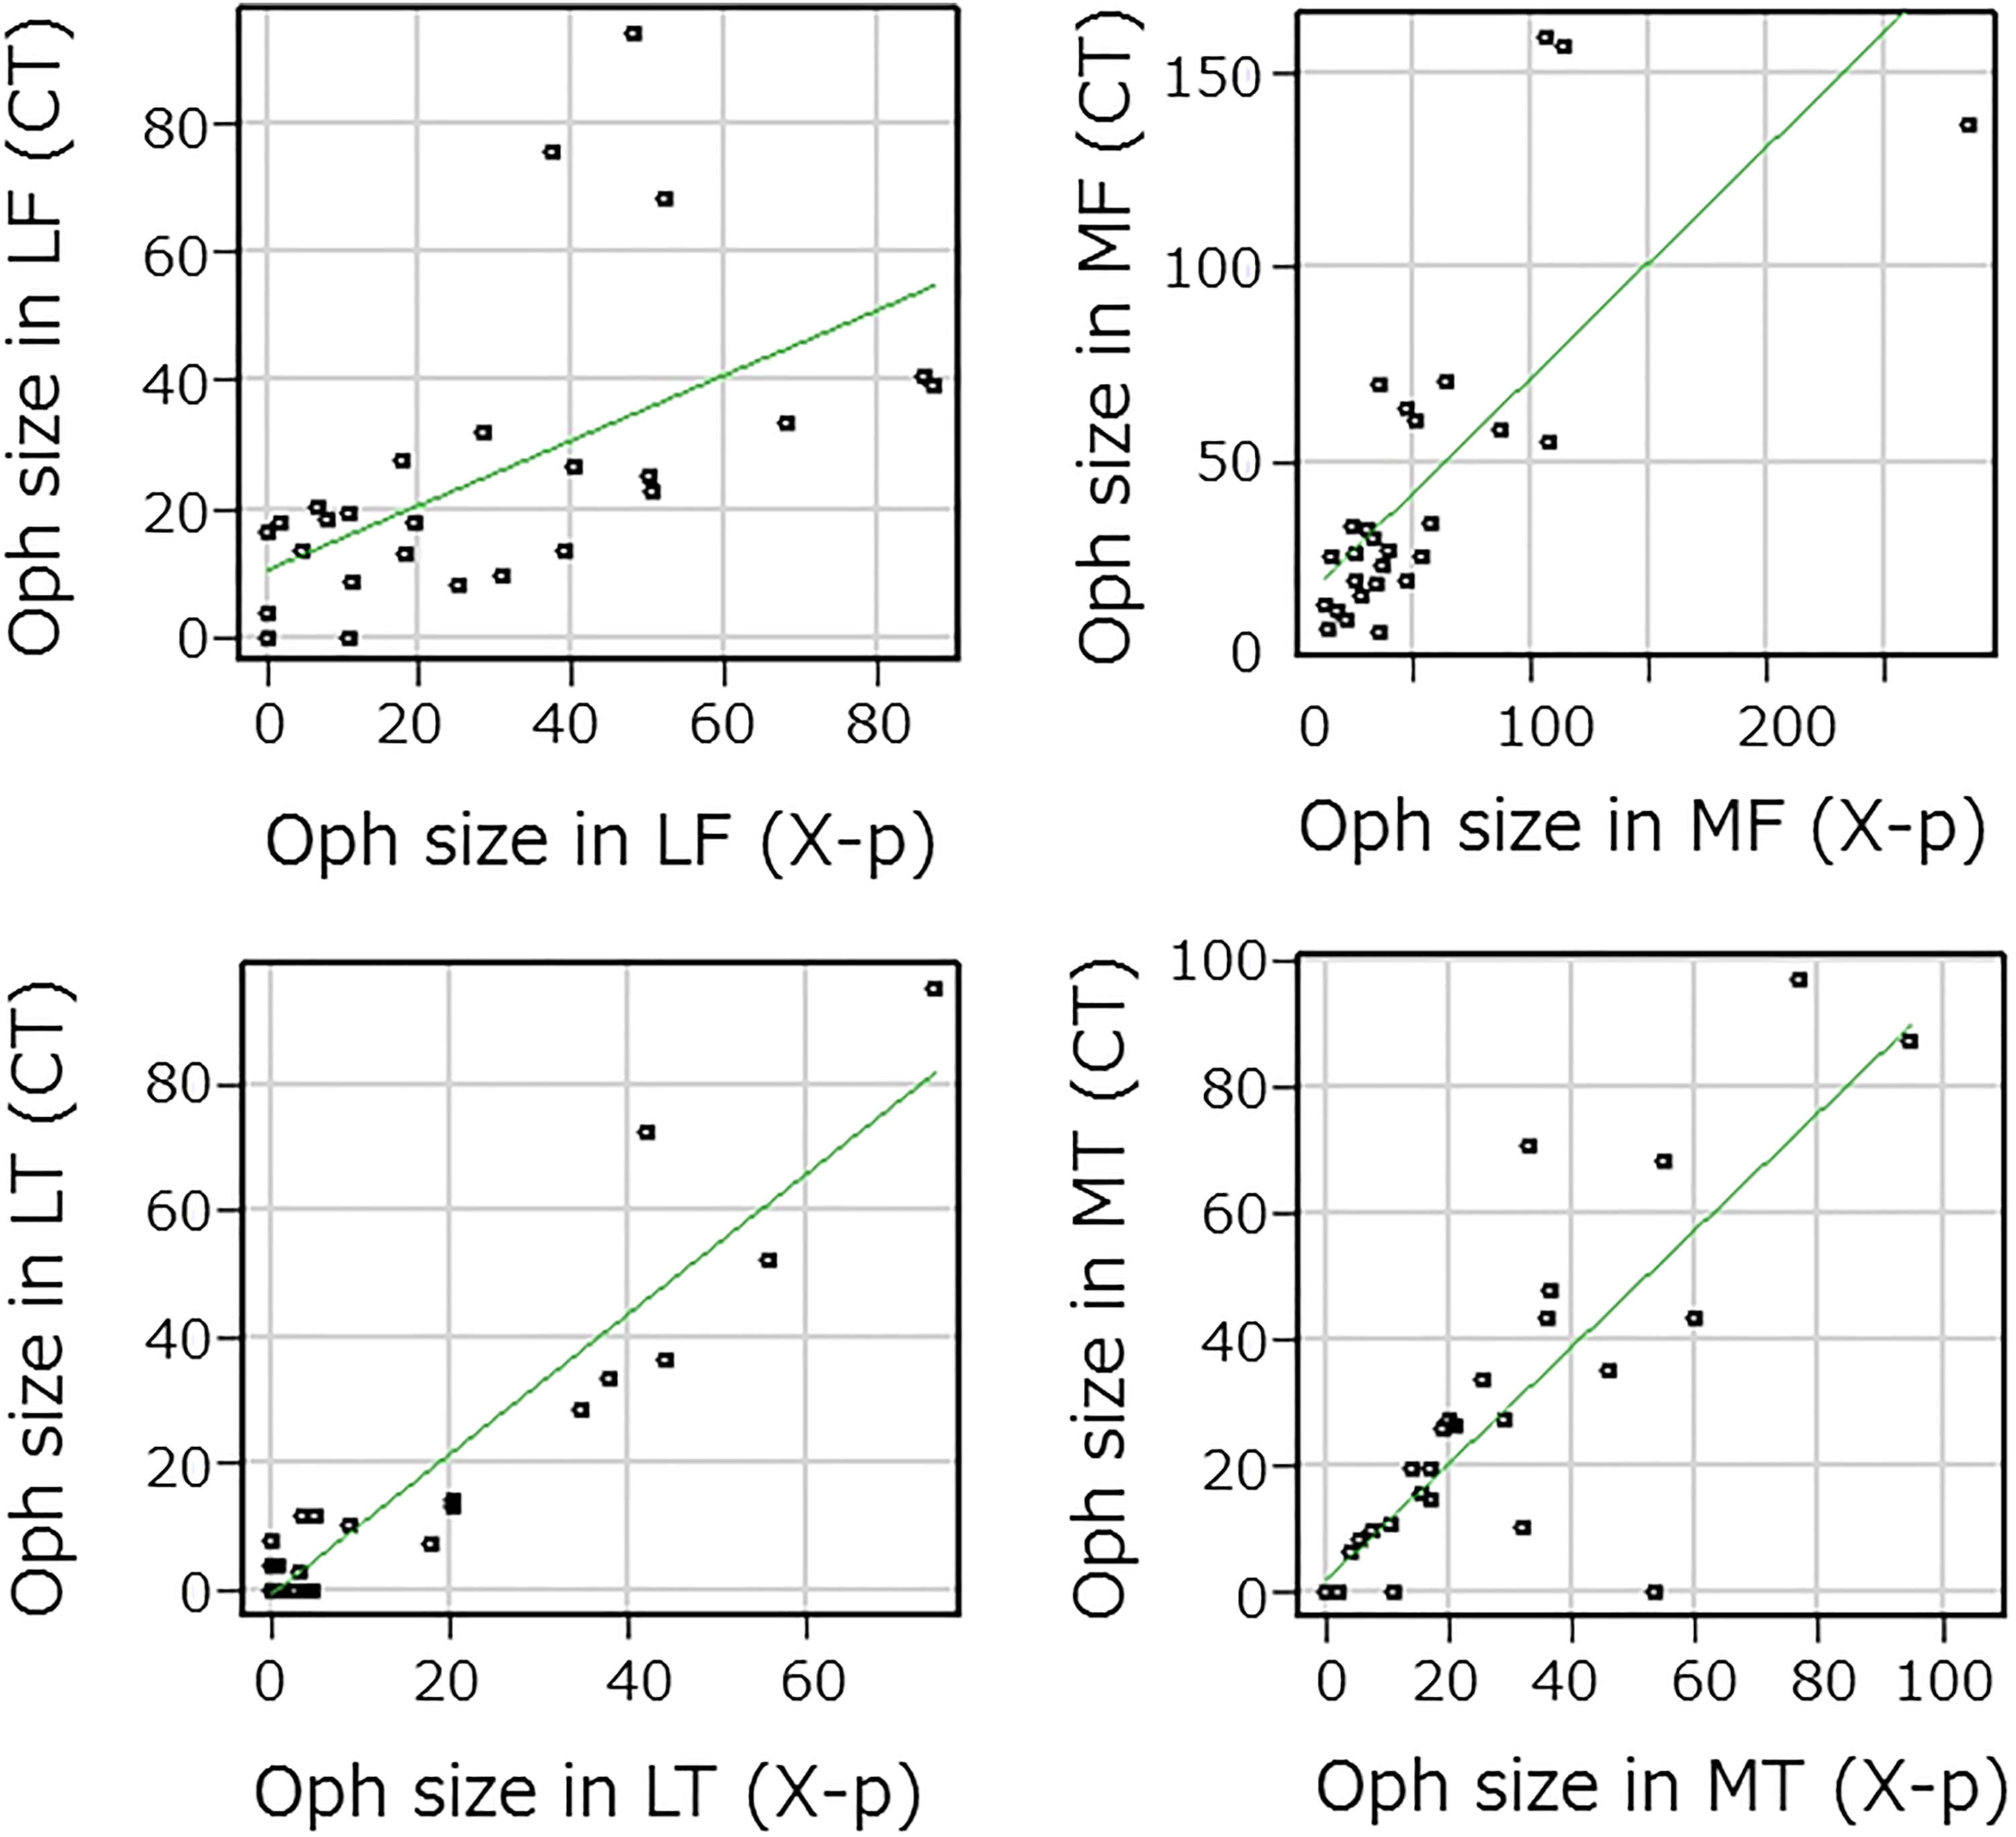
Scatter plot showing correlation of Oph size with CT and radiography (X-p) findings in each site. In all sites, osteophyte size was strongly correlated with both CT and X-p (LF: r = 0.711, p < 0.001; LT: r = 0.816, p < 0.001; MF: r = 0.757, p < 0.001; and MT: r = 0.804, p < 0.001). Oph: osteophyte; CT: computed tomography; LF: lateral femur; LT: lateral tibia; MF: medial femur; MT: medial tibia.

Box plot showing relationship between Oph size and OARSI grade in each site. Median values are presented. Oph: osteophyte; OARSI: Osteoarthritis Research Society International; MF: medial femur; MT: medial tibia; LF: lateral femur; LT: lateral tibia.
Correlation between osteophyte size and various factors
There was no significant correlation of osteophyte size with age, gender, disease duration, or range of motion. Given that FTA was correlated with osteophyte size in the medial compartment (Spearman’s correlation coefficient, r = 0.493, p = 0.0026), and FTA was found to have effects on osteophyte size and region, we divided the present cohort into varus (FTA ≥ 180°), normal (FTA 170°–180°), and valgus (FTA < 170°) groups. In the varus group, osteophyte size in the medial compartment was significantly greater than the normal and valgus groups (Kruskal–Wallis test, p = 0.0016; Bonferroni test, p = 0.375, p = 0.0019). On the other hand, osteophyte size in the lateral compartment was not significantly different in terms of alignment among the three groups (p = 0.13) (Figure 5). Osteophyte size in the medial compartment (especially MF) was negatively correlated with inflammatory markers, such as CRP and ESR (Spearman’s rank correlation coefficient; CRP: r = −0.492, p = 0.0027; ESR: r = −0.529, p = 0.0016), whereas that size in the lateral compartment was negatively correlated with disease activity (Spearman’s rank correlation coefficient; r = −0.589, p = 0.0023) (Table 3). As for administered drugs, there was no significant difference regarding use of MTX or glucocorticoids, whereas total osteophyte size was significantly dominant (Mann–Whitney U test, p = 0.0067) in patients who received biological DMARDs for more than 1 year (n = 11, Tumor Necrosis Factor (TNF)-alpha inhibitors in all) (Table 4).

Box plot showing relationship between FTA and Oph size in medial (a) and lateral (b) compartments. Osteophyte size in the medial compartment was significantly larger in varus alignment cases, while there was no difference in osteophyte size in the lateral compartment. FTA: femora-tibial angle; Oph: osteophyte.
Correlation of osteophyte size with inflammation markers and disease activity.a

CRP: C-reactive protein; ESR: erythrocyte sedimentation rate; SDAI: simplified disease activity index; MF: medial femur; MT: medial tibia; LF: lateral femur; LT: lateral tibia.
a Spearman’s correlation coefficients with p-values. Strongly correlated areas are shown in bold.
Total Oph size and effects of drugs.a

Oph: osteophyte; MTX: methotrexate; GCs: glucocorticoids; DMARDs: disease-modifying anti-rheumatic drugs.
a There was a significant difference in total osteophyte size when biological DMARDs were used for more than 1 year. Median values (IQR) are presented.
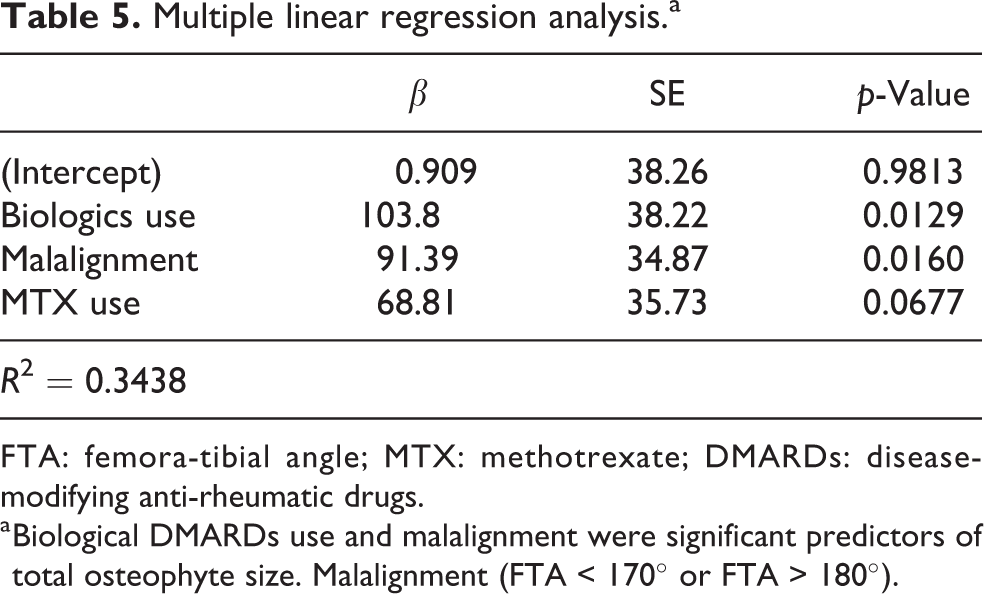
Multiple linear regression analysis was performed to reveal the relationship of total osteophyte size with age (over 60 years), malalignment (FTA < 170° or FTA > 180°), high inflammation (CRP > 0.5), disease duration (over 20 years), and moderate disease activity (SDAI >11), as well as biological DMARD (>1 year, n = 11), MTX (n = 20), and glucocorticoid (n = 18) usage. Those results showed that both biological DMARDs use and malalignment had a significant association with total osteophyte size (Table 5).
Multiple linear regression analysis.a
FTA: femora-tibial angle; MTX: methotrexate; DMARDs: disease-modifying anti-rheumatic drugs.
a Biological DMARDs use and malalignment were significant predictors of total osteophyte size. Malalignment (FTA < 170° or FTA > 180°).
Discussion
We attempted to quantify osteophyte size using radiography results and also examined the relationship with RA pathology. Osteophyte size determined according to the present measurement method was strongly correlated with CT image results, while that has also previously been shown to be significantly correlated with a semi-quantification method based on the OARSI score, a conventional methodology. Based on our findings, we consider that osteophyte size can be accurately determined using the present measurement method. In addition, our analysis of quantified size showed that osteophytes occurring in the medial compartment were large in varus alignment cases, indicating that disease activity and DMARDs have effects on osteophyte size.
Osteophyte formation in the medial compartment has been reported to worsen varus alignment in knees with OA. 12 In the present cohort, osteophyte size in the medial compartment was significantly greater in knees with varus alignment than to normal knees and those with valgus alignment, suggesting that secondary OA progresses in the knees of RA patients. Since the introduction of DMARDs, including biologics, findings have shown dramatic suppression of bone destruction progress in treated RA patients. 13 However, it is difficult to completely prevent the progress of joint destruction in a loading joint with a high Larsen grade, even when biological DMARDs treatment is used, 14 resulting in no repair of cartilage destruction due to acute phase arthritis, leading to secondary OA progression. Based on the present findings showing that inflammatory markers and osteophyte size in the medial compartment had a negative correlation, we consider that secondary OA progression occurs only in RA knees with RA with sufficiently controlled inflammation.
In the lateral compartment, a significantly negative correlation was seen between osteophyte size and disease activity. Osteophyte formation in that compartment, which is often observed in lateral OA but relatively rarely in medial OA cases, is thought to react to traction. 12 Cartilage destruction in RA knees is accompanied by synovitis and occurs relatively evenly on the medial and lateral sides, and thus, alignment is maintained or slightly valgus in many cases, while valgus deformity tends to progress as Larsen grade increases. 15 When disease activity is not controlled in cases with valgus deformity, osteophyte formation does not occur, similar to lateral OA cases, whereas osteophyte formation in the lateral compartment occurs due to traction in cases with varus alignment. Therefore, osteophyte size in the lateral compartment was not found to be correlated with alignment or inflammatory markers.
Treatments with biological DMARDs and MTX have influence on osteophyte size, possibly due to sufficient control of synovitis. On the other hand, the use of glucocorticoids did not influence osteophyte formation in the present cases. Thus, the effects of glucocorticoids on bone resorption, such as osteoporotic and bone density lowering effects, 16 are stronger than the arthritis suppression effects. Bone destruction in RA is associated with activation of osteoclasts by RANKL, 17 and MTX and biological DMARDs prevent progression of bone destruction by normalizing osteoclast activation by inflammatory cytokines. These findings suggest that osteoclast activity is affected by osteophyte formation in RA and osteophyte formation is expected to progress in cases where bone resorption is suppressed. In addition, the significantly greater osteophyte size shown in the group using TNF-alpha inhibitors may reflect a direct effect of TNF-alpha on bone formation. Since TNF-alpha has an inhibitory effect on osteogenesis through Dkk-1, which inhibits Wnt signaling, it is possible that osteogenesis can be promoted by decreasing TNF-alpha by use of a TNF-alpha inhibitor. 18
Osteophyte formation leads to joint stability, which alleviates pain and improves activities of daily living. On the other hand, such formation in the knee has been reported to increase pain and the rate of incidence of TKA surgery. 19 It is anticipated that the number of patients using biological DMARDs will substantially increase in the future. Considering that the incidence of joint replacement surgery has not decreased since introduction of biological DMARDs, 20 it is a possible that RA patients undergoing joint replacement surgery for secondary OA will continue to increase.
Our study has several limitations. The design was not prospective, and radiography findings were not evaluated at the start of treatment; thus, results showing the influence of administered drugs on osteophyte formation may be limited. In addition, some of the present patients had elderly onset RA, and the possibility that preexisting primary OA in the knees of these patients before the onset of RA cannot be denied.
Conclusion
In summary, osteophyte size in RA-TKA cases was quantified using radiography results and the morphology analyzed. In knees with varus alignment, osteophyte size in the medial compartment was large, indicating that secondary OA is more prominent in patients with controlled inflammation. Disease activity associated with RA was also shown to have an effect on osteophyte size and that could also be influenced by the type of administered drugs received, including the possibility that osteophyte size is affected by DMARDs rather than glucocorticoids.
Footnotes
Declaration of conflicting interests
The author(s) declared no potential conflicts of interest with respect to the research, authorship, and/or publication of this article.
Funding
The author(s) received no financial support for the research, authorship, and/or publication of this article.