
Abstract
Background:
This prospective clinical–radiological study was conducted to determine whether the dynamic mobility stress radiographs can predict the postoperative vertebral height restoration, kyphosis correction, and cement volume injected after vertebroplasty.
Methods:
Patients included had the diagnosis of significant back pain caused by osteoporotic vertebral compression fracture secondary to trivial injury. All the patients underwent routine preoperative sitting lateral spine radiograph, supine stress lateral spine radiograph, and supine anteroposterior spine radiograph. The radiological parameters recorded were anterior vertebral height (AVH), middle vertebral height (MVH), posterior vertebral height (PVH), MVH level below, wedge endplate angle (WEPA), and regional kyphotic angle (RKA). The supine stress versus sitting difference (SSD) for all the above parameters were calculated.
Results:
A total of 28 patients (4 males; 24 females) with the mean age of 75.6 ± 7.7 years were recruited into this study. The mean cement volume injected was 5.5 ± 1.8 ml. There was no difference between supine stress and postoperative radiographs for AVH (p = 0.507), PVH (p = 0.913) and WEPA (p = 0.379). The MVH (p = 0.026) and RKA (p = 0.005) were significantly less in the supine stress radiographs compared to postoperative radiographs. There was significant correlation (p < 0.05) between supine stress and postoperative AVH, MVH, PVH, WEPA, and RKA. The SSD for AVH, PVH, WEPA, and RKA did not have significant correlation with the cement volume (p > 0.05). Only the SSD-MVH had significant correlation with cement volume, but the correlation was weak (r = 0.39, p = 0.04).
Conclusions:
Dynamic mobility stress radiographs can predict the postoperative vertebral height restoration and kyphosis correction after vertebroplasty for thoracolumbar osteoporotic fracture with intravertebral clefts. However, it did not reliably predict the amount of cement volume injected as it was affected by other factors.
Keywords
Introduction
Spinal vertebral fractures are the most common fragility fractures among the elderly population. 1,2 If not treated early and adequately, it can lead to significant morbidity and mortality. 3 When occurred in the thoracolumbar junction, it had been reported that up to one-third of the vertebral fractures may undergo avascular necrosis leading to nonunion. 4 This will develop with an intravertebral cleft formation in the vertebra presenting with a classical “vacuum” sign on plain radiograph. 5 –12
Several authors had documented the usage of dynamic mobility radiographs with or without stress using a bolster to diagnose intravertebral cleft in osteoporotic vertebral fractures. 7,11,13 –16 They noted that the vacuum cleft in a collapsed vertebral body helped to avoid confusion with the diagnosis of malignancy and infection. 7 Changes in the vertebral wedging difference between supine and erect was associated with the amount of back pain typically complained by patients. 16 The dynamic radiographs were said to be highly sensitive to diagnose the painful vertebra in vertebral compression fractures. 15 When vertebroplasty procedures were done for the osteoporotic vertebral fractures, the cement-filling pattern for fractures with intravertebral cleft were noted to be different compared to fractures without clefts. 11
McKiernan et al. 13 had noted that the dynamic mobility stress radiographs were able to predict postoperative vertebral height restoration. They found that the average sum of preoperative dynamic mobility was not different from final postoperative vertebral height restoration (p > 0.4). However, this study was a retrospective case series of 14 patients and only looked into one measurable parameter which was the anterior vertebral height difference to derive the preoperative dynamic mobility and postoperative vertebral height correction. No other studies in the literature had looked into this feature of the dynamic mobility radiographs to predict the postoperative corrections.
Therefore, we conducted this prospective study to determine whether the dynamic mobility stress radiographs can predict the postoperative vertebral height restoration, kyphosis correction, and cement volume injected after vertebroplasty for osteoporotic thoracolumbar vertebral fractures with intravertebral cleft.
Methods
This was a prospective clinical–radiological study carried out from July 2014 to June 2017. Ethical approval from institutional review board was obtained. Inclusion criteria for this study were patients diagnosed with back pain caused by osteoporotic vertebral compression fracture with intravertebral cleft secondary to trivial injury. Patients with neurological deficits or pathological fracture due to other pathologies (malignancies, infection, high velocity trauma, fall from height) were excluded. Patients with an ankylosed spine due to ankylosing spondylitis, diffuse idiopathic skeletal hyperostosis, or other ankylosing causes were also excluded.
All the patients underwent routine preoperative imaging: sitting lateral spine radiograph, supine stress lateral spine radiograph (Figure 1), supine anteroposterior spine radiograph, magnetic resonance imaging (MRI), and computed tomography (CT). The supine stress lateral radiograph was done carefully and gently, allowing the patient to relax and slowly lower to lie down on the bolster. The amount of hyperlordosis was standardized using a bolster with the diameter of about 13.0 cm. MRI was done to rule out possible pathological fracture. CT scan was done to rule out ankylosed spine. Additionally, blood investigations were done to rule out pathological causes mentioned above. One day after operation, postoperative anterior–posterior and lateral radiographs were obtained.
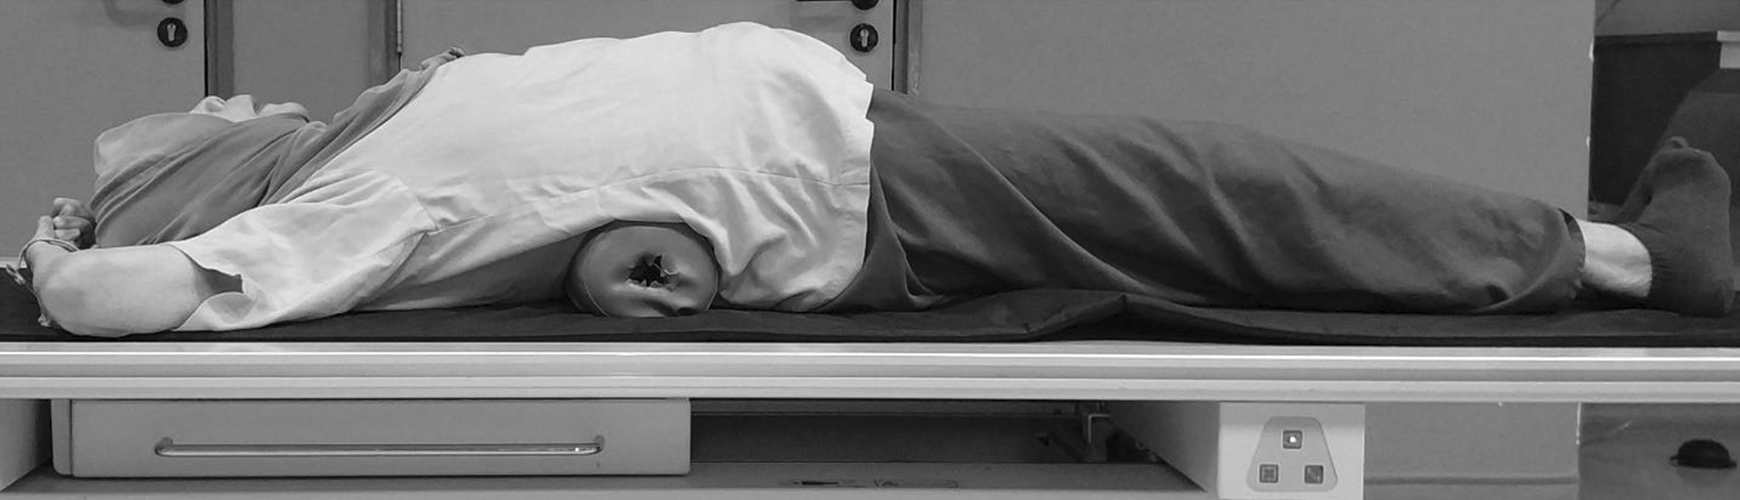
Supine stress radiographs of the thoracolumbar spine.
The patient demographics and radiological parameters recorded were age, gender, level of fracture, cement volume injected, anterior vertebral height (AVH), middle vertebral height (MVH), posterior vertebral height (PVH), middle vertebral height level below, wedge endplate angle (WEPA), and regional kyphotic angle (RKA). The supine stress versus sitting difference (SSD) for all the above parameters were calculated. All measurements were measured digitally with software (Centricity PACS, version 5.0, GE Healthcare; Figures 2 and 3).
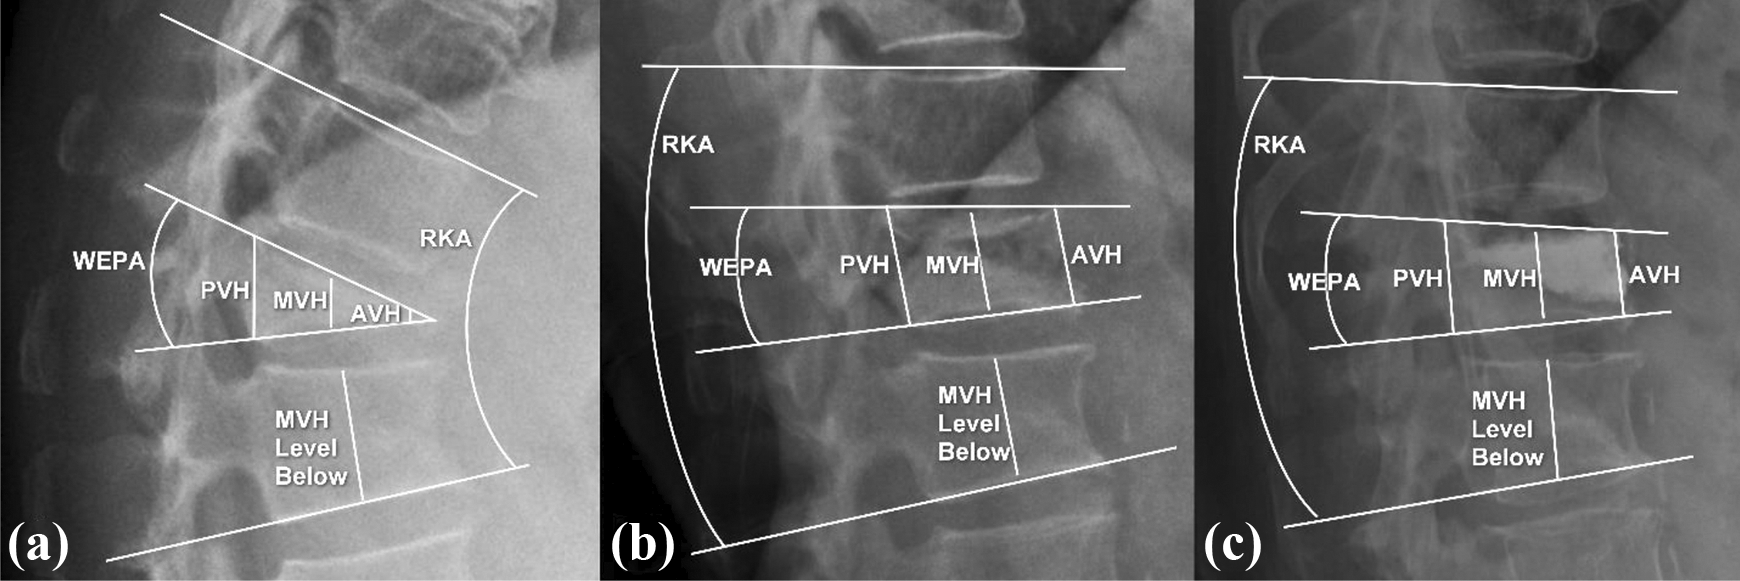
Measurements on (a) sitting radiographs, (b) supine stress radiographs, and (c) postoperative radiograph. AVH: anterior vertebral height; MVH: middle vertebral height; PVH: posterior vertebral height; WEPA: wedge endplate angle; RKA: regional kyphotic angle.
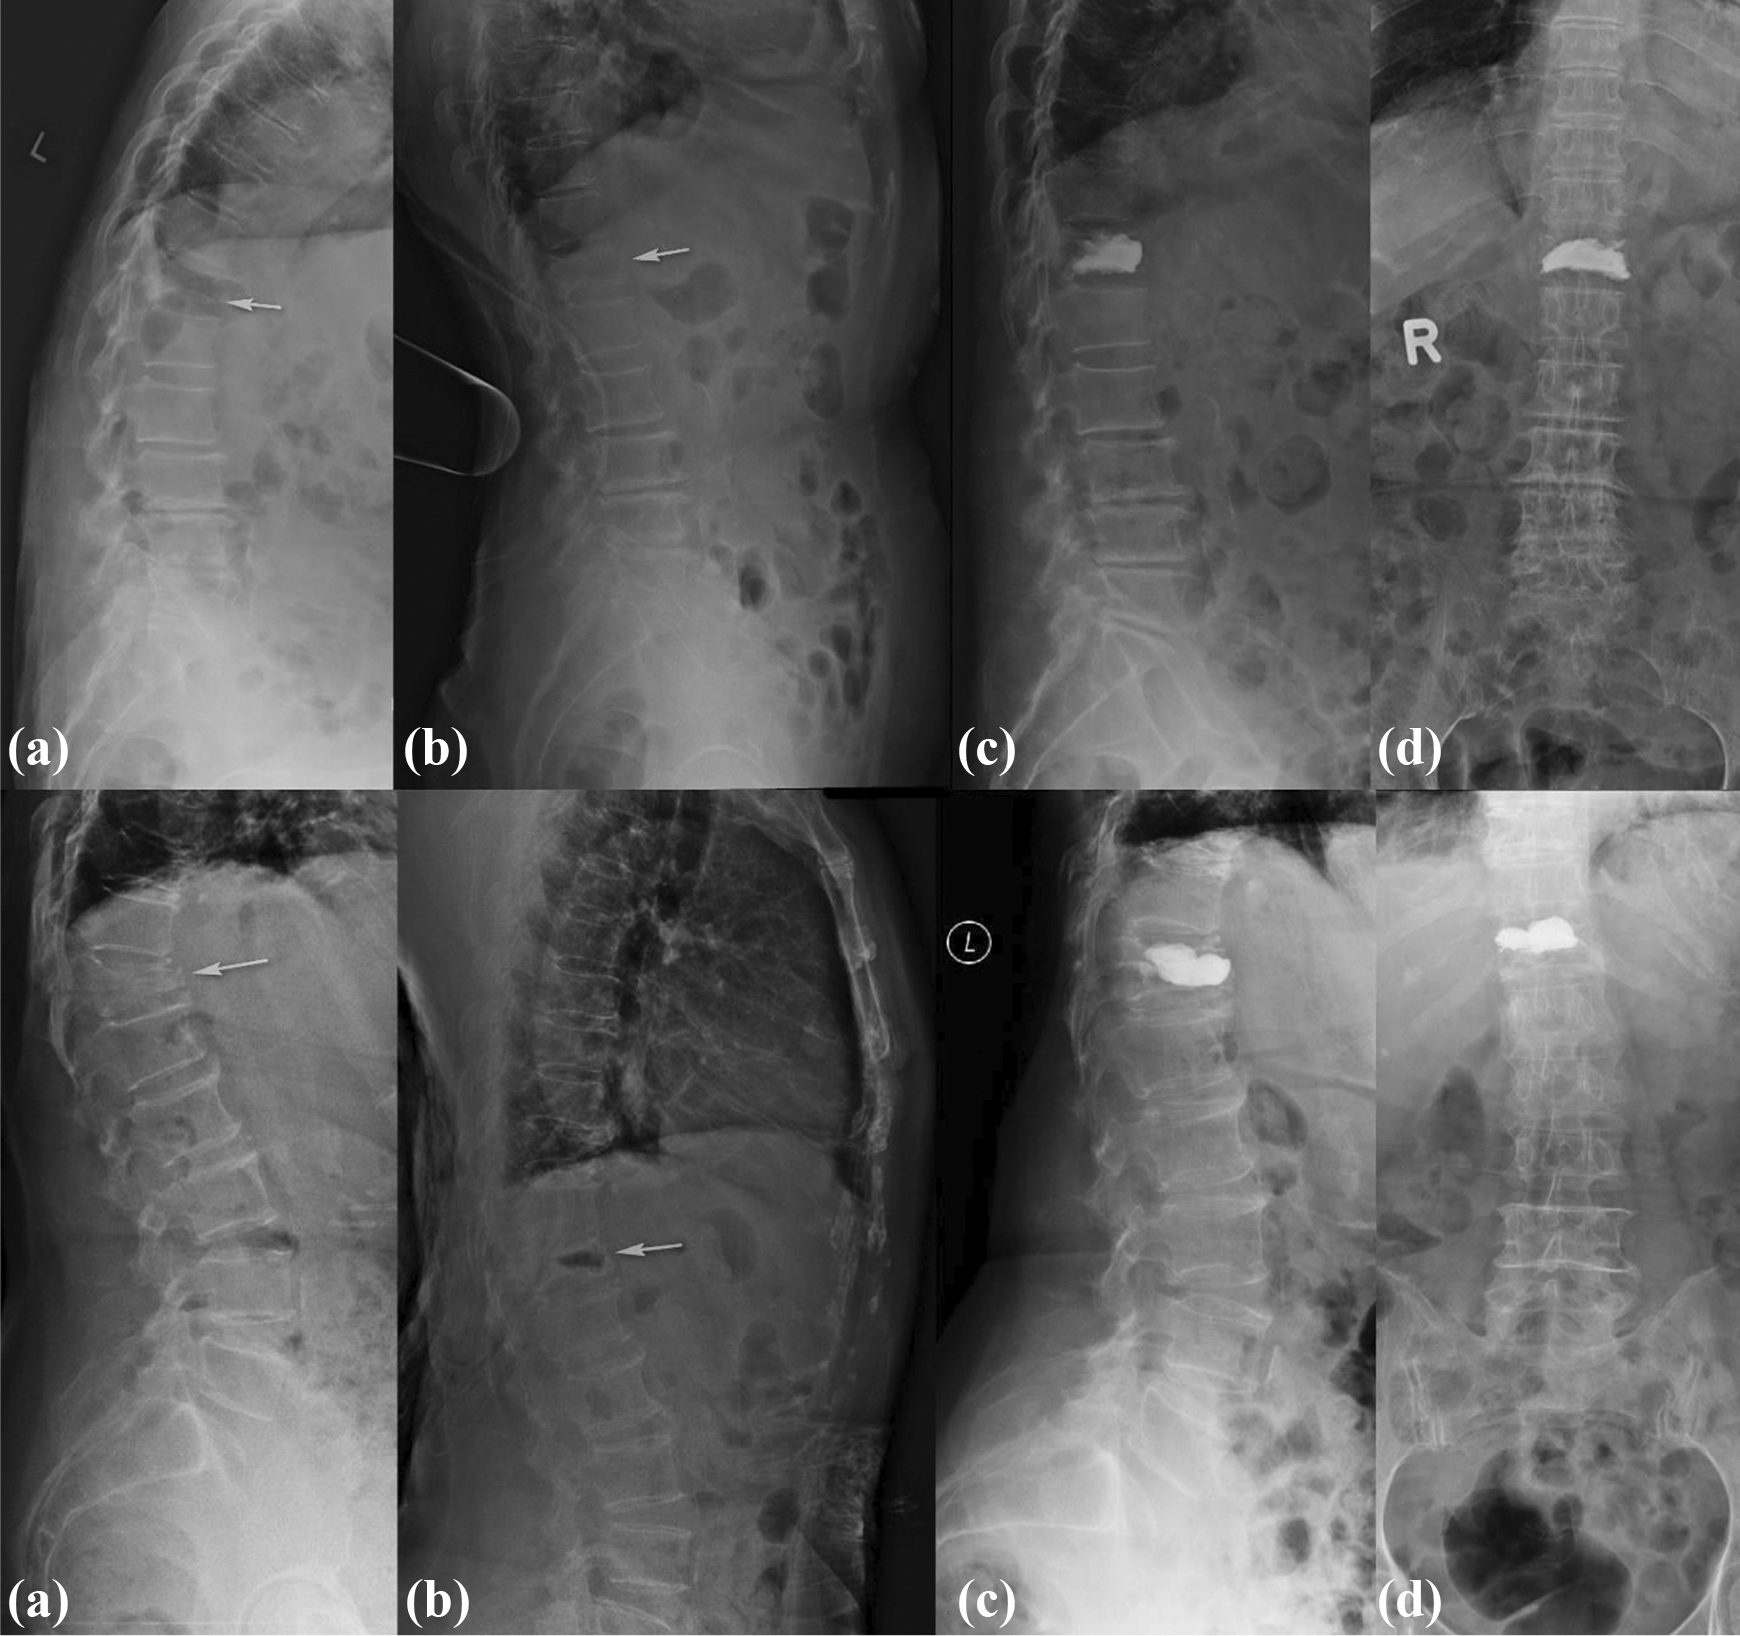
Radiograph of an 86-year-old lady (above) and 68-year-old lady (below) who sustained T12 fractures with intravertebral clefts. They both underwent the vertebroplasty procedure. (a) Sitting radiographs, (b) supine stress radiographs, (c) postoperative lateral radiographs, and (d) postoperative anterior–posterior radiographs.
Definitions of parameters recorded and calculated are as follows:
Anterior vertebral height (AVH) (mm): Distance measured between the anterior superior vertebral endplate and anterior inferior vertebral endplate of the fractured vertebra.
Middle vertebral height (MVH) (mm): Distance measured between the middle superior vertebral endplate and middle inferior vertebral endplate of the fractured vertebra.
Posterior vertebral height (PVH) (mm): Distance measured between the posterior superior vertebral endplate and posterior inferior vertebral endplate of the fractured vertebra.
Middle vertebral height level below (mm): Distance measured between the middle superior vertebral endplate and middle inferior vertebral endplate of the vertebra below the fracture.
Wedge endplate angle (WEPA) (°): Angle between the superior endplate and inferior endplate of the fractured vertebra.
Regional kyphotic angle (RKA) (°): Angle between the superior endplate of the vertebra above the fracture and inferior endplate of the vertebra below the fracture.
Supine stress versus sitting difference (SSD): The difference in height or angle between supine stress radiographs and sitting radiographs.
Vertebroplasty
All patients underwent vertebroplasty under sedation and local anesthesia. Patients were positioned prone in hyperlordotic position. Two Jamshidi trocars were used, one on the right and the other on the left. The trocar was inserted and advanced with the guidance of the image intensifier until the depth of about 50–75% to the vertebral body. Normal saline was flushed into one needle to achieve a backflow out of the opposite needle. If no backflow achieved, the trocars were readjusted. After a good backflow was achieved, a water-soluble radiopaque agent was injected into one of the trocars and filling or leakage was checked using the image intensifier. Polymethyl methacrylate bone cement was mixed and injected into one of the trocars. The cement was injected until adequate filling was noted on the image intensifier or backflow of cement through the opposite trocar.
Sample size analysis
By considering 5% marginal error and 80% power of study with an effect size of 0.5, statistical power analysis indicated that a minimum sample size of 26 subjects was needed to determine the mean difference of outcome variables. The sample size calculation was performed using G*Power software (version 3.1.9.2).
Statistical analysis
Data were entered and analyzed using SPSS v.23 statistical software (SPSS, Chicago, Illinois, USA). Paired t-test was used to determine the differences for AVH, MVH, PVH, MVH level below, WEPA, and RKA between each group. Correlation strength was assessed between supine stress AVH and postoperative AVH, supine stress MVH and postoperative MVH, supine stress PVH and postoperative PVH, supine stress WEPA and postoperative WEPA, supine stress RKA and postoperative RKA using Pearson correlation coefficient. Correlation strength was assessed between cement volume and SSD-AVH, SSD-MVH, SSD-PVH, SSD-WEPA, and SSD-RKA. The α level was set at 0.05 to declare significance.
Results
A total of 28 patients were recruited into this study with 4 (14.3%) males and 24 (85.7%) females. The mean age was 75.6 ± 7.7 years. Two (7.1%) patients had the fracture at T11, 12 (42.9%) patients had fracture at T12, 8 (28.6%) patients had fracture at L1, and 6 (21.4%) patients had fracture at L2. The mean cement volume injected was 5.5 ± 1.8 ml.
The AVH (16.5 ± 4.1 mm), MVH (15.2 ± 4.0 mm), and PVH (25.9 ± 2.9 mm) for supine stress radiographs were significantly higher than the AVH (9.4 ± 4.8 mm), MVH (10.6 ± 4.4 mm), and PVH (24.2 ± 2.7 mm) for sitting radiographs (p < 0.001). The AVH (9.4 ± 4.8 mm), MVH (10.6 ± 4.4 mm), and PVH (24.2 ± 2.7 mm) of sitting radiographs were significantly less than the AVH (16.9 ± 3.7 mm), MVH (16.9 ± 3.6 mm), and PVH (26.0 ± 2.9 mm) for postoperative radiographs (p < 0.001). However, there was no difference between supine stress and postoperative radiographs for AVH (16.5 ± 4.1 mm vs. 16.9 ± 3.7 mm) (p = 0.507) and PVH (25.9 ± 2.9 mm vs. 26.0 ± 2.9 mm) (p = 0.913). The MVH was significantly less in the supine stress radiographs (15.2 ± 4.0 mm) compared to postoperative radiographs (16.9 ± 3.6 mm) (p = 0.026). There was no significant difference for the MVH level below between sitting, supine stress, and postoperative radiographs (p > 0.05). However, all the sitting, supine stress, and postoperative MVH were significantly less than the MVH level below (p < 0.05). The WEPA for sitting radiographs (21.6° ± 8.6°) was significantly more kyphotic than supine stress radiographs (10.5° ± 5.7°) (p < 0.001) and the postoperative radiographs (10.5° ± 5.8°) (p < 0.001). However, there were no difference between supine stress and postoperative radiographs (p = 0.379). The RKA for sitting radiographs (33.2° ± 13.7°) was significantly more kyphotic than the supine stress radiographs (13.9° ± 9.3°) (p < 0.001) and postoperative radiographs (17.5 ± 8.6) (p < 0.001). However, the supine stress radiographs (13.9° ± 9.3°) were significantly less kyphotic than the postoperative radiographs (17.5 ± 8.6) (p = 0.005) (Table 1).
Radiographic parameters for all levels (T11 to L2), thoracic levels (T11 and T12), and lumbar levels (L1 and L2).

AVH: anterior vertebral height; MVH: middle vertebral height; PVH: posterior vertebral height; WEPA: wedge endplate angle; RKA: regional kyphotic angle.
When the levels were subdivided into T11 and T12, the pattern of distribution was similar except for supine stress MVH (17.2 ± 3.6 mm,) and postoperative MVH (18.0 ± 3.1 mm) (p = 0.245) and supine stress RKA (11.8° ± 9.2°) and postoperative RKA (15.0° ± 10.3°) (p = 0.049). When the levels were subdivided into L1 and L2, the pattern of distribution was similar except for supine stress MVH (13.2 ± 3.3 mm) and postoperative MVH (15.7 ± 3.9 mm) (p = 0.061).
There was significant strong correlation (r = 0.61, p = 0.001) between supine stress AVH and postoperative AVH when the whole cohort was analyzed. There was significant but moderate correlation (r = 0.52, p = 0.005) between supine stress MVH and postoperative MVH when the whole cohort was analyzed. There was significant strong correlation (r = 0.77, p < 0.001) between supine stress PVH and postoperative PVH when the whole cohort was analyzed. There was significant but moderate correlation (r = 0.50, p = 0.007) between supine stress WEPA and postoperative WEPA when the whole cohort was analyzed. There was significant strong correlation (r = 0.76, p < 0.001) between supine stress RKA and postoperative RKA when the whole cohort was analyzed (Figure 4).
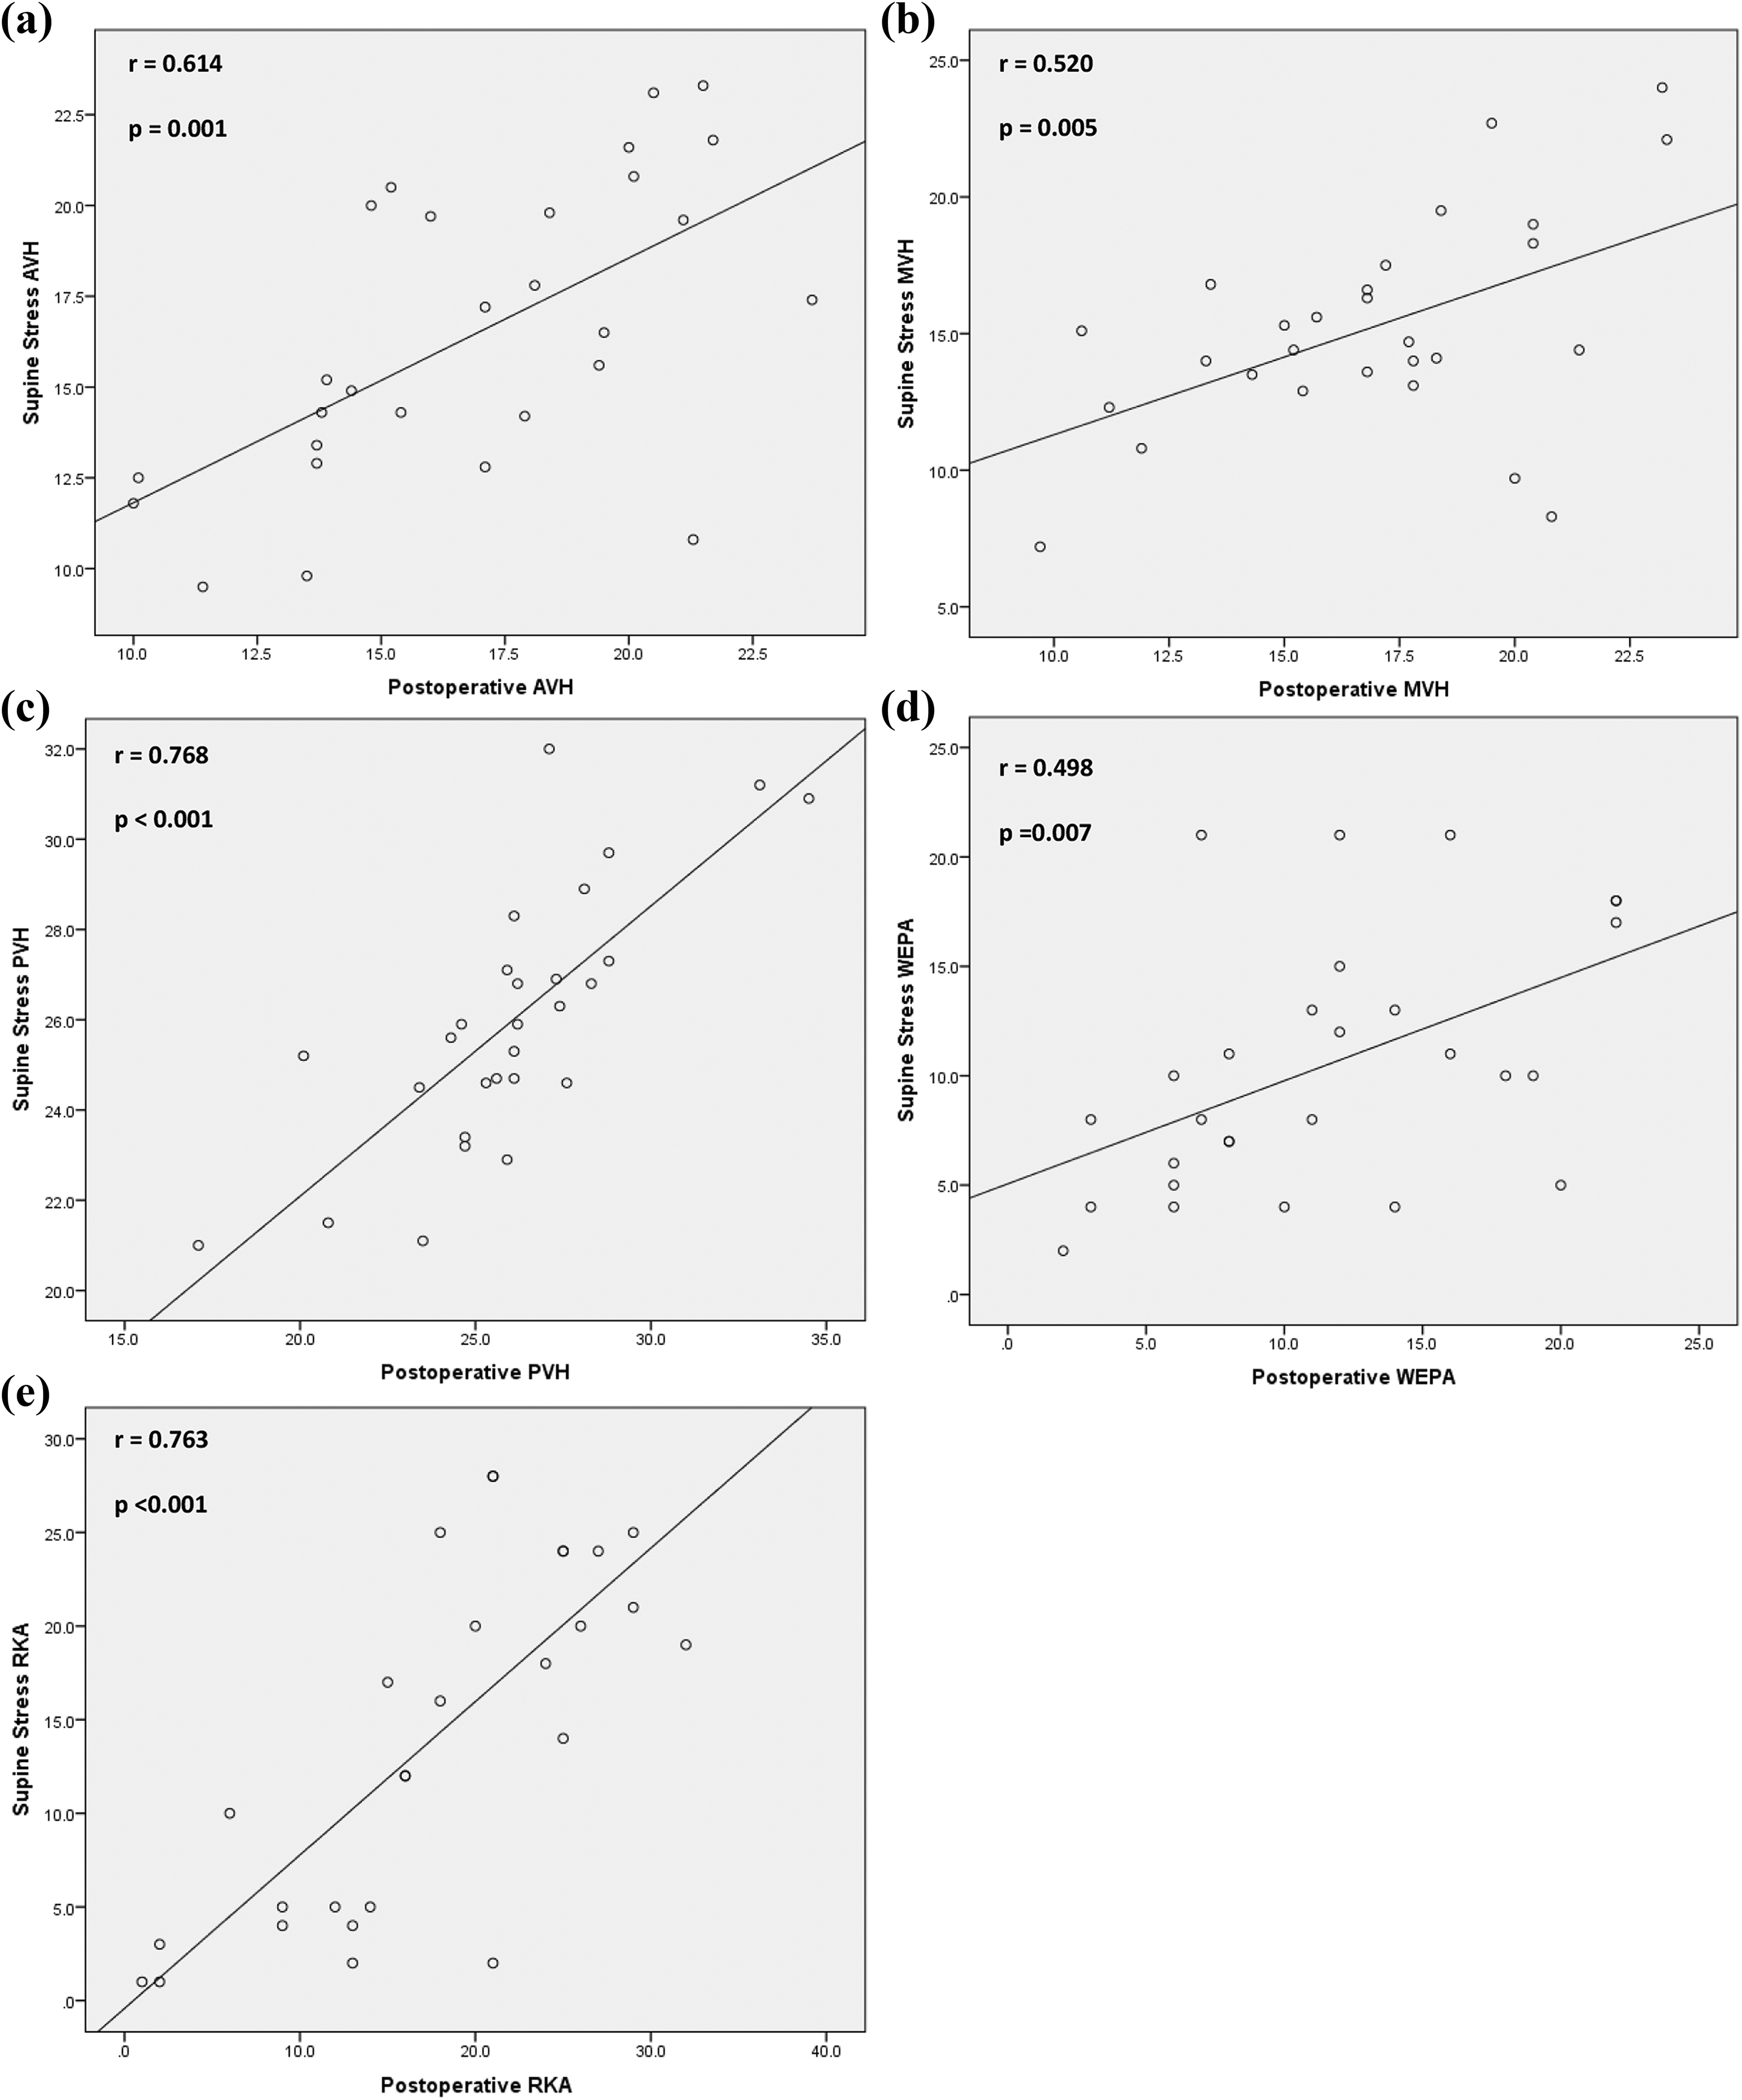
Correlation between supine stress and (a) postoperative AVH, (b) postoperative MVH, (c) postoperative PVH, (d) postoperative WEPA, and (e) postoperative RKA. AVH: anterior vertebral height; MVH: middle vertebral height; PVH: posterior vertebral height; WEPA: wedge endplate angle; RKA: regional kyphotic angle.
The SSD for AVH, MVH, PVH, WEPA, and RKA are illustrated in Table 2. The SSD-AVH, SSD-PVH, SSD-WEPA, and SSD-RKA did not have significant correlation with the cement volume (p > 0.05). Only the SSD-MVH had significant correlation with cement volume, but the correlation was weak (r = 0.39, p = 0.04).
The SSD for all the radiographic parameters and their correlation with cement volume.a

SSD: supine stress vs. sitting difference; AVH: anterior vertebral height; MVH: middle vertebral height; PVH: posterior vertebral height; WEPA: wedge endplate angle; RKA: regional kyphotic angle.
a SSD is the difference in height or angle between supine stress radiographs and sitting radiographs.
b Between cement volume and SSD.
Discussion
The formation of intravertebral vacuum cleft was initially described by Maldague et al. 5 through their observation of flexion and extension radiographs. Malghem et al. 7 examined sequential radiographs and MRI of patients and found that a cleft with a gas-like pattern on radiographs was formed during the initial adoption of the supine position with extension of the spine, which later disappeared on radiographs and a fluid-like high signal intensity pattern subsequently appeared on T2-weighted MRI, suggesting a slow fluid inflow into the intravertebral cleft. This intravertebral cleft is due to the persistent dynamic instability of the fractured vertebra leading to severe back pain among patients. 14,16 Usually these patients do not respond well with conservative measures such as bed rest, medications or orthosis, and, therefore, surgical treatment is usually recommended. 17,18
There had been several surgical methods that had been described to improve the symptoms of patient with osteoporotic vertebral fractures with intravertebral clefts such as percutaneous vertebroplasty, 17 –22 balloon kyphoplasty 23,24 intracorporeal bone grafting. 25 These procedures were found to be suitable as they are minimally invasive and effective in providing pain relief and adequate stabilization. 18 Cement leakages were found to be less in fractures with intravertebral clefts when compared with those without clefts. 17,20 Kyphosis correction was also found to be more in fracture with intravertebral clefts. 17,20,25 Despite balloon kyphoplasty had been reported to have the ability to restore the vertebral body height, 26,27 this capability remains controversial. There were many clinical studies that reported vertebroplasty to produce similar capability of vertebral body height restoration. 14,15,28 –30
The usage of dynamic mobility radiographs with or without stress using a bolster to diagnose intravertebral cleft in osteoporotic vertebral fractures had been well described. 7,11,13 –16 However, only one previous study described the usefulness of dynamic mobility stress radiographs to predict the postoperative vertebral height restoration after vertebroplasty. 13 We therefore looked comprehensively into whether the dynamic mobility stress radiographs can predict the postoperative vertebral height restoration, kyphosis correction, and cement volume injected after vertebroplasty for osteoporotic thoracolumbar vertebral fractures with intravertebral cleft.
Our findings revealed that supine stress radiographs correlated well with postoperative radiographs. All the supine stress radiograph parameters (AVH, MVH, PVH, WEPA, and RKA) had significant moderate-to-strong correlation with postoperative parameters (Figure 4). The mean values of supine stress radiographs significantly approximated the mean values of the postoperative radiographs except for MVH (Table 1). The supine stress radiographs therefore can predict the postoperative reduction after vertebroplasty for fractures of the thoracolumbar junction with intravertebral clefts. This is useful for preoperative planning prior to surgery. In addition, it can predict the kyphosis reduction and can be used to predict whether vertebroplasty alone can be used alone to restore the deformity caused by the fracture.
The supine stress and sitting difference (SSD) for the measured radiological parameters did not correlate well with the amount of cement volume used during the vertebroplasty procedure. The SSD-AVH, SSD-PVH, SSD-WEPA, and SSD-RKA all did not show any significant correlation with the cement volume injected. The SSD-MVH had significant (p = 0.04) correlation, but it was weak (r = 0.39) (Table 2). This may be due to several factors. First, the difference in all the parameters above did not reflect a three-dimensional measurement but only two-dimensional values. Therefore, the volume injection that largely depended on the three-dimensional measurement will not correlate with the difference in these radiological parameters. Second, the cement injected also depended on the discretion of the surgeon during the vertebroplasty procedure, and the amount of cement injected may be less if the surgeon deemed further injection may risk leakage. Third, some amount of cement leakage to the paravertebral space or disk space not directly related to restoration of the vertebral height may account to more cement injected.
There were several limitations to this study. The radiographs were done with the assumption that the patient was fully relaxed and no muscle spasm was present, which may alter the alignment of the spine. This study only looked into whether the dynamic mobility stress radiographs predicted the postoperative vertebral height restoration, kyphosis correction, and the amount of cement volume injected after vertebroplasty. It did not assess the long-term outcome of the vertebroplasty procedure. It also did not look into the incidence of subsequent adjacent vertebral body fracture after vertebroplasty. 31,32 All patients underwent vertebroplasty under “sedation and local anesthesia” and not general anesthesia because this procedure does not require a long duration, patients are elderly, and may have multiple comorbidities that pose higher risk under general anesthesia and intermittent neurological check can be done by asking the patient to move both his/her lower limbs. 33 However, general anesthesia can allow complete relaxation of musculature leading to a more sufficient fracture reduction in prone hyperlordotic position.
In conclusion, we found that the dynamic mobility stress radiographs can predict the postoperative vertebral height restoration and kyphosis correction after vertebroplasty for thoracolumbar osteoporotic fracture with intravertebral clefts. However, it did not reliably predict the amount of cement volume injected as it was affected by other factors.
Footnotes
Declaration of conflicting interests
The author(s) declared no potential conflicts of interest with respect to the research, authorship, and/or publication of this article.
Funding
The author(s) received no financial support for the research, authorship, and/or publication of this article.