
Abstract
Purpose:
To detect early osteoarthritis (OA) in a canine Pond–Nuki model 3 weeks after anterior cruciate ligament (ACL) transection surgery, both topographically over the medial tibial surface and depth-dependently over the cartilage thickness.
Methods:
Four topographical locations on each OA and contralateral medial tibia were imaged individually by magnetic resonance imaging (MRI) at 17.6 µm transverse resolution. The quantitative MRI T2 relaxation data were correlated with the biomechanical stress-relaxation measurements from adjacent locations.
Results:
OA cartilage was thinner than the contralateral tissue and had a lower modulus compared to the contralateral cartilage for the exterior, interior, and central medial tibia locations. Depth-dependent and topographical variations were detected in OA cartilage by a number of parameters (compressive modulus, glycosaminoglycan concentration, bulk and zonal thicknesses, T2 at 0° and 55° specimen orientations in the magnet). T2 demonstrated significant differences at varying depths between OA and contralateral cartilage.
Conclusion:
ACL transection caused a number of changes in the tibial cartilage at 3 weeks after the surgery. The characteristics of these changes, which are topographic and depth-dependent, likely reflect the complex degradation in this canine model of OA at the early developmental stage.
Keywords
Introduction
Cartilage degradation leads to osteoarthritis (OA), which is the most common cause of disability in the developed countries. 1,2 Despite consistent research effort, the early onset of cartilage degradation is still difficult to detect clinically, which is due to many factors including the avascular and aneural nature of the tissue, the complex motional and structural hierarchy of cartilage, and the influence of other related tissues in joints. 3,4 Morphologically, articular cartilage has a number of depth-dependent variations in its molecular concentration and structural organization, including water, proteoglycan (covalently attached glycosaminoglycan (GAG) chains), type-II collagen, chondrocyte, and biomechanical properties. 3,5 –7 These depth-dependent variations are commonly subdivided, based on the collagen architecture along the cartilage thickness (depth), into three structural zones: the superficial zone (SZ), the transitional zone (TZ), and the radial zone (RZ).
Since water is the predominant molecule in the extracellular matrix (ECM) of cartilage, magnetic resonance imaging (MRI) is a perfect tool for clinical diagnostics of OA because of its noninvasiveness. 8 –10 In MRI, the transverse relaxation time (T2) is particularly useful since it is highly sensitive to the motion of water molecules. 11,12 A unique feature of T2 relaxation in articular cartilage is its depth-dependent anisotropy, which is modulated by the collagen orientation. 13 A homogeneous appearance of cartilage in MRI can be found when the normal axis of the articular surface of a cartilage specimen is oriented at 55° with respect to the main magnetic field B0. 11,14 When the axis normal to the cartilage surface is oriented at 0° with respect to B0, the tissue exhibits an anisotropic laminar appearance. This depth-dependent and anisotropic characteristic of T2 relaxation has been used to noninvasively subdivide the cartilage depth into multiple structural zones in MRI, which have been proven to be equivalent to the zonal thicknesses defined histologically by polarized light microscopy. 6,15 –17
Among the commonly used animal models of OA, the Pond–Nuki model uses a surgical procedure that transects the anterior cruciate ligament (ACL) which creates an instability in the joint motion. In canines, the Pond–Nuki model has shown to have pathologic and radiographic similarities with human OA. 18 –21 The degradation occurs topographically over the articular cartilage; the medial tibia cartilage is one of the prominent locations for the onset of OA. 15,22 –24 In this study, microscopic MRI (µMRI) T2 relaxation was used to investigate the early topographic changes in the medial tibiae of canines merely 3 weeks after ACL transection, which initiated OA progression. In addition, the µMRI measurements were correlated with the compressive modulus measured by indentation stress-relaxation experiments. The high spatial resolution in imaging allows the localization of cartilage degradation, both topographically and depth-dependently. Since µMRI shares the same physics principles and engineering architecture with the clinical MRI, it offers a unique translational pathway between the high-resolution animal studies and human diagnostics of early OA.
Methods and materials
Cartilage specimens
This study used four canines, which were from a single source, had known birth dates, were at least 18 months or older (hence skeletally mature), and weighed between 20.0 kg and 20.5 kg. An ACL transection with a blade cut was used to create joint instability that leads to tissue degradation. 25 –27 Three weeks after ACL transection on one randomly chosen knee of an animal, the medial articular cartilage was harvested from both the ACL-transected (OA) and unoperated (contralateral) stifles of four canines. The procedures were approved by the Institutional Animal Care and Use Committees. (Note that a sham incision was not carried out on the contralateral knee, which was consistent with our previous practice when using this identical model.) On each of the medial tibiae, four cartilage–bone blocks were harvested using a low-speed diamond saw from four topographical locations: exterior (exterior medial tibia (EMT)), central (central medial tibia (CMT)), interior (interior medial tibia (IMT)), and posterior (posterior medial tibia (PMT)), as shown in Figure 1. Each block was approximately 3 × 5 mm2 and included the full-thickness cartilage that was still attached to the underlying bone. The specimens were equilibrated in a physiologic saline solution with the addition of 1% protease inhibitor (Sigma, St. Louis, Missouri, USA) and stored at 4°C until experimentation (never frozen). A total of 32 specimens were prepared from eight knee joints for this study.

A visible image of a medial tibia with the topographical locations of the four blocks that were sectioned for the EMT (exterior), PMT (posterior), CMT (central), and IMT (interior) specimens for µMRI (i) and biomechanical (ii) experiments. EMT: exterior medial tibia; PMT: posterior medial tibia; CMT: central medial tibia; IMT: interior medial tibia.
μMRI experimentation
The μMRI experiments were carried out on a Bruker micro-MRI scanner that had a vertical bore superconducting magnet (7T/89 mm) and a micro-imaging attachment (Bruker Instrument, Billerica, Massachusetts, USA). Each cartilage specimen was placed in a precision glass tube and imaged with the cartilage surface oriented at 0° and 55° with respect to B0 (two independent imaging experiments for each specimen), which were termed as “T2-0°” and “T2-55°,” respectively. The imaging protocols remained consistent for all experiments: the field of view 0.45 × 0.45 cm, imaging matrix 256 × 128 pixels reconstructed to 256 × 256 pixels, the pixel size in the cartilage depth 17.6 μm, and the slice thickness 1.0 mm. Additional experimental details can be obtained from our previous studies. 11,28
For every specimen, a pilot image at the sagittal orientation was first performed to ensure the articular surface was horizontal in the imaging plane to minimize the partial volume effect at the surface. A second pilot image at the coronal orientation was performed to position the sample at either 0° or 55° with respect to B0. To reduce the experimental time so that all fresh specimens could be imaged as soon as possible, all cartilage blocks (n = 32) were equilibrated in the saline solution that contained 1 mM Gadolinium diethylene triamine pentaacetic acid (Gd-DTPA2-) (Magnevist; Bayer HealthCare, Berlex, New Jersey, USA) 29 for no less than 8 h. A T2 magnetization-prepared imaging sequence 11 was used to image all specimens at both 0° and 55°, which used a repetition time of 0.5 s, the echo times of 2, 8, 20, 40, and 70 ms for the 0° orientation and 2, 18, 40, 70, and 100 ms for the 55° orientation. 30 Five T2-weighted images were obtained for each specimen from each echo time. Together, there were 320 independent MRI imaging experiments.
Image analysis
To calculate one quantitative two-dimensional (2-D) T2 image, the five T2-weighted images were fit pixel-by-pixel using a mono-exponential function using a custom code in MATLAB (MathWorks, Natick, Massachusetts, USA). After all T2 images were calculated (n = 64, 2 for each specimen), a region of interest (ROI) was identified in each quantitative image by the open-source image analysis software ImageJ (the National Institutes of Health, Bethesda, Maryland, USA). Quantitative T2 values from 10 adjacent columns were extracted from the ROI and averaged to obtain one 1-D depth-dependent profile for the entire thickness of cartilage. Since the 10-column averaging occurred in the direction perpendicular to the cartilage depth, the resolution of the cartilage depth remained 17.6 µm.
The full thickness of each cartilage specimen was measured using the T2-55° images in MRI. The three sub-tissue zones in cartilage were determined from the T2-0° profiles using the full-width-half-maximum method as previously described. 6,16 The RZs were further divided into two halves and labeled as “RZ1” (upper RZ) and “RZ2” (lower RZ) for this study.
Biomechanical experimentation
The indentation stress-relaxation experiments were performed using an EnduraTec ELF 3200 system (TA Instruments, Eden Prairie, Minnesota, USA) to measure the compressive modulus at each topographical location, using the small block “ii” which was adjacent to the MRI block “i” shown in Figure 1. These specimens were the same cartilage blocks used for the separate biochemical GAG measurements in another study. 24 A stress-relaxation test had an indentation rate of 1 µm/s and included six consecutive steps using a flat cylindrical indenter with a diameter of 300 µm. After each step, approximately 5 min was allowed for cartilage relaxation. The modulus (E) of the specimens was calculated using the equation in the literature, 31,32 where the Poisson’s ratio was assumed to be 0.1 for all samples. 33
Statistical analysis
All statistical analyses were performed using a commercial software Kaleidagraph (Synergy, Reading, Pennsylvania, USA). The mean ± standard deviation was calculated for the total thickness, 1-D T2 profiles, and the zonal averages from all cartilage. Analysis of variance with Fisher’s least significant difference post hoc test was performed to identify significant differences between each OA and contralateral location for thickness, T2 bulk, and zonal averages for all specimens. Statistical significance was demonstrated when p < 0.05.
Results
Visual and MRI examination of full-thickness cartilage
A varying degree of degradation was visible on the surface of the OA tibial cartilage and meniscus but less visible on the contralateral cartilage, at 3 weeks post ACL transection surgery. 34 Figure 2 shows the T2 images of the representative OA specimens from two topographical locations: the posterior (PMT) and interior (IMT) locations. The full-thickness cartilage from both OA and contralateral tibiae was found to be the thinnest in the exterior and posterior locations that are covered by the meniscus, and the thickest in the interior and central locations that are largely not covered by the meniscus, as summarized in Table 1.
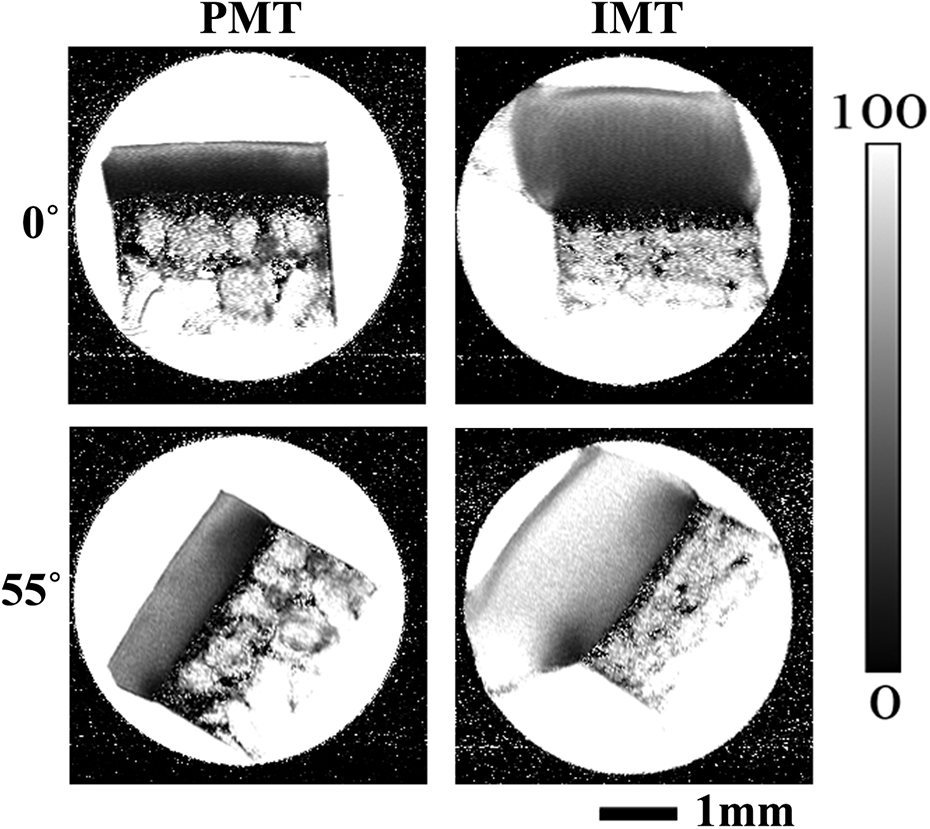
Representative µMRI T2 images from OA cartilage are shown for the PMT and IMT locations, at both 0° and 55° orientations. OA: osteoarthritis; PMT: posterior medial tibia; IMT: interior medial tibia.
Bulk (full-thickness) values of all cartilage specimens, where the thickness and T2 values were from the MRI measurement, and modulus values were from the indentation stress-relaxation measurement of adjacent tissue blocks.

EMT: exterior medial tibia; PMT: posterior medial tibia; CMT: central medial tibia; IMT: interior medial tibia; OA: osteoarthritis.
a The GAG values were obtained by inductively coupled plasma optical emission spectrometry, which have been reported earlier. 24 The numbers in boldface indicate the significant statistical differences between the OA and contralateral cartilage (p < 0.05).
T2 profiles of cartilage
Figure 3 compares the depth-dependent T2 profiles between OA and contralateral cartilage at the posterior (PMT) and interior (IMT) locations, at both 0° and 55° orientations. It is evident that the depth-dependent T2 profiles from the posterior location (the left half of Figure 3) demonstrated little difference between the OA and contralateral cartilage, with only a slight increase in T2-0° values in the SZ for OA. In contrast, the same T2 profiles from the interior location (the right half of Figure 3) measured a marked increase in T2 for OA cartilage at both 0° and 55° orientations.
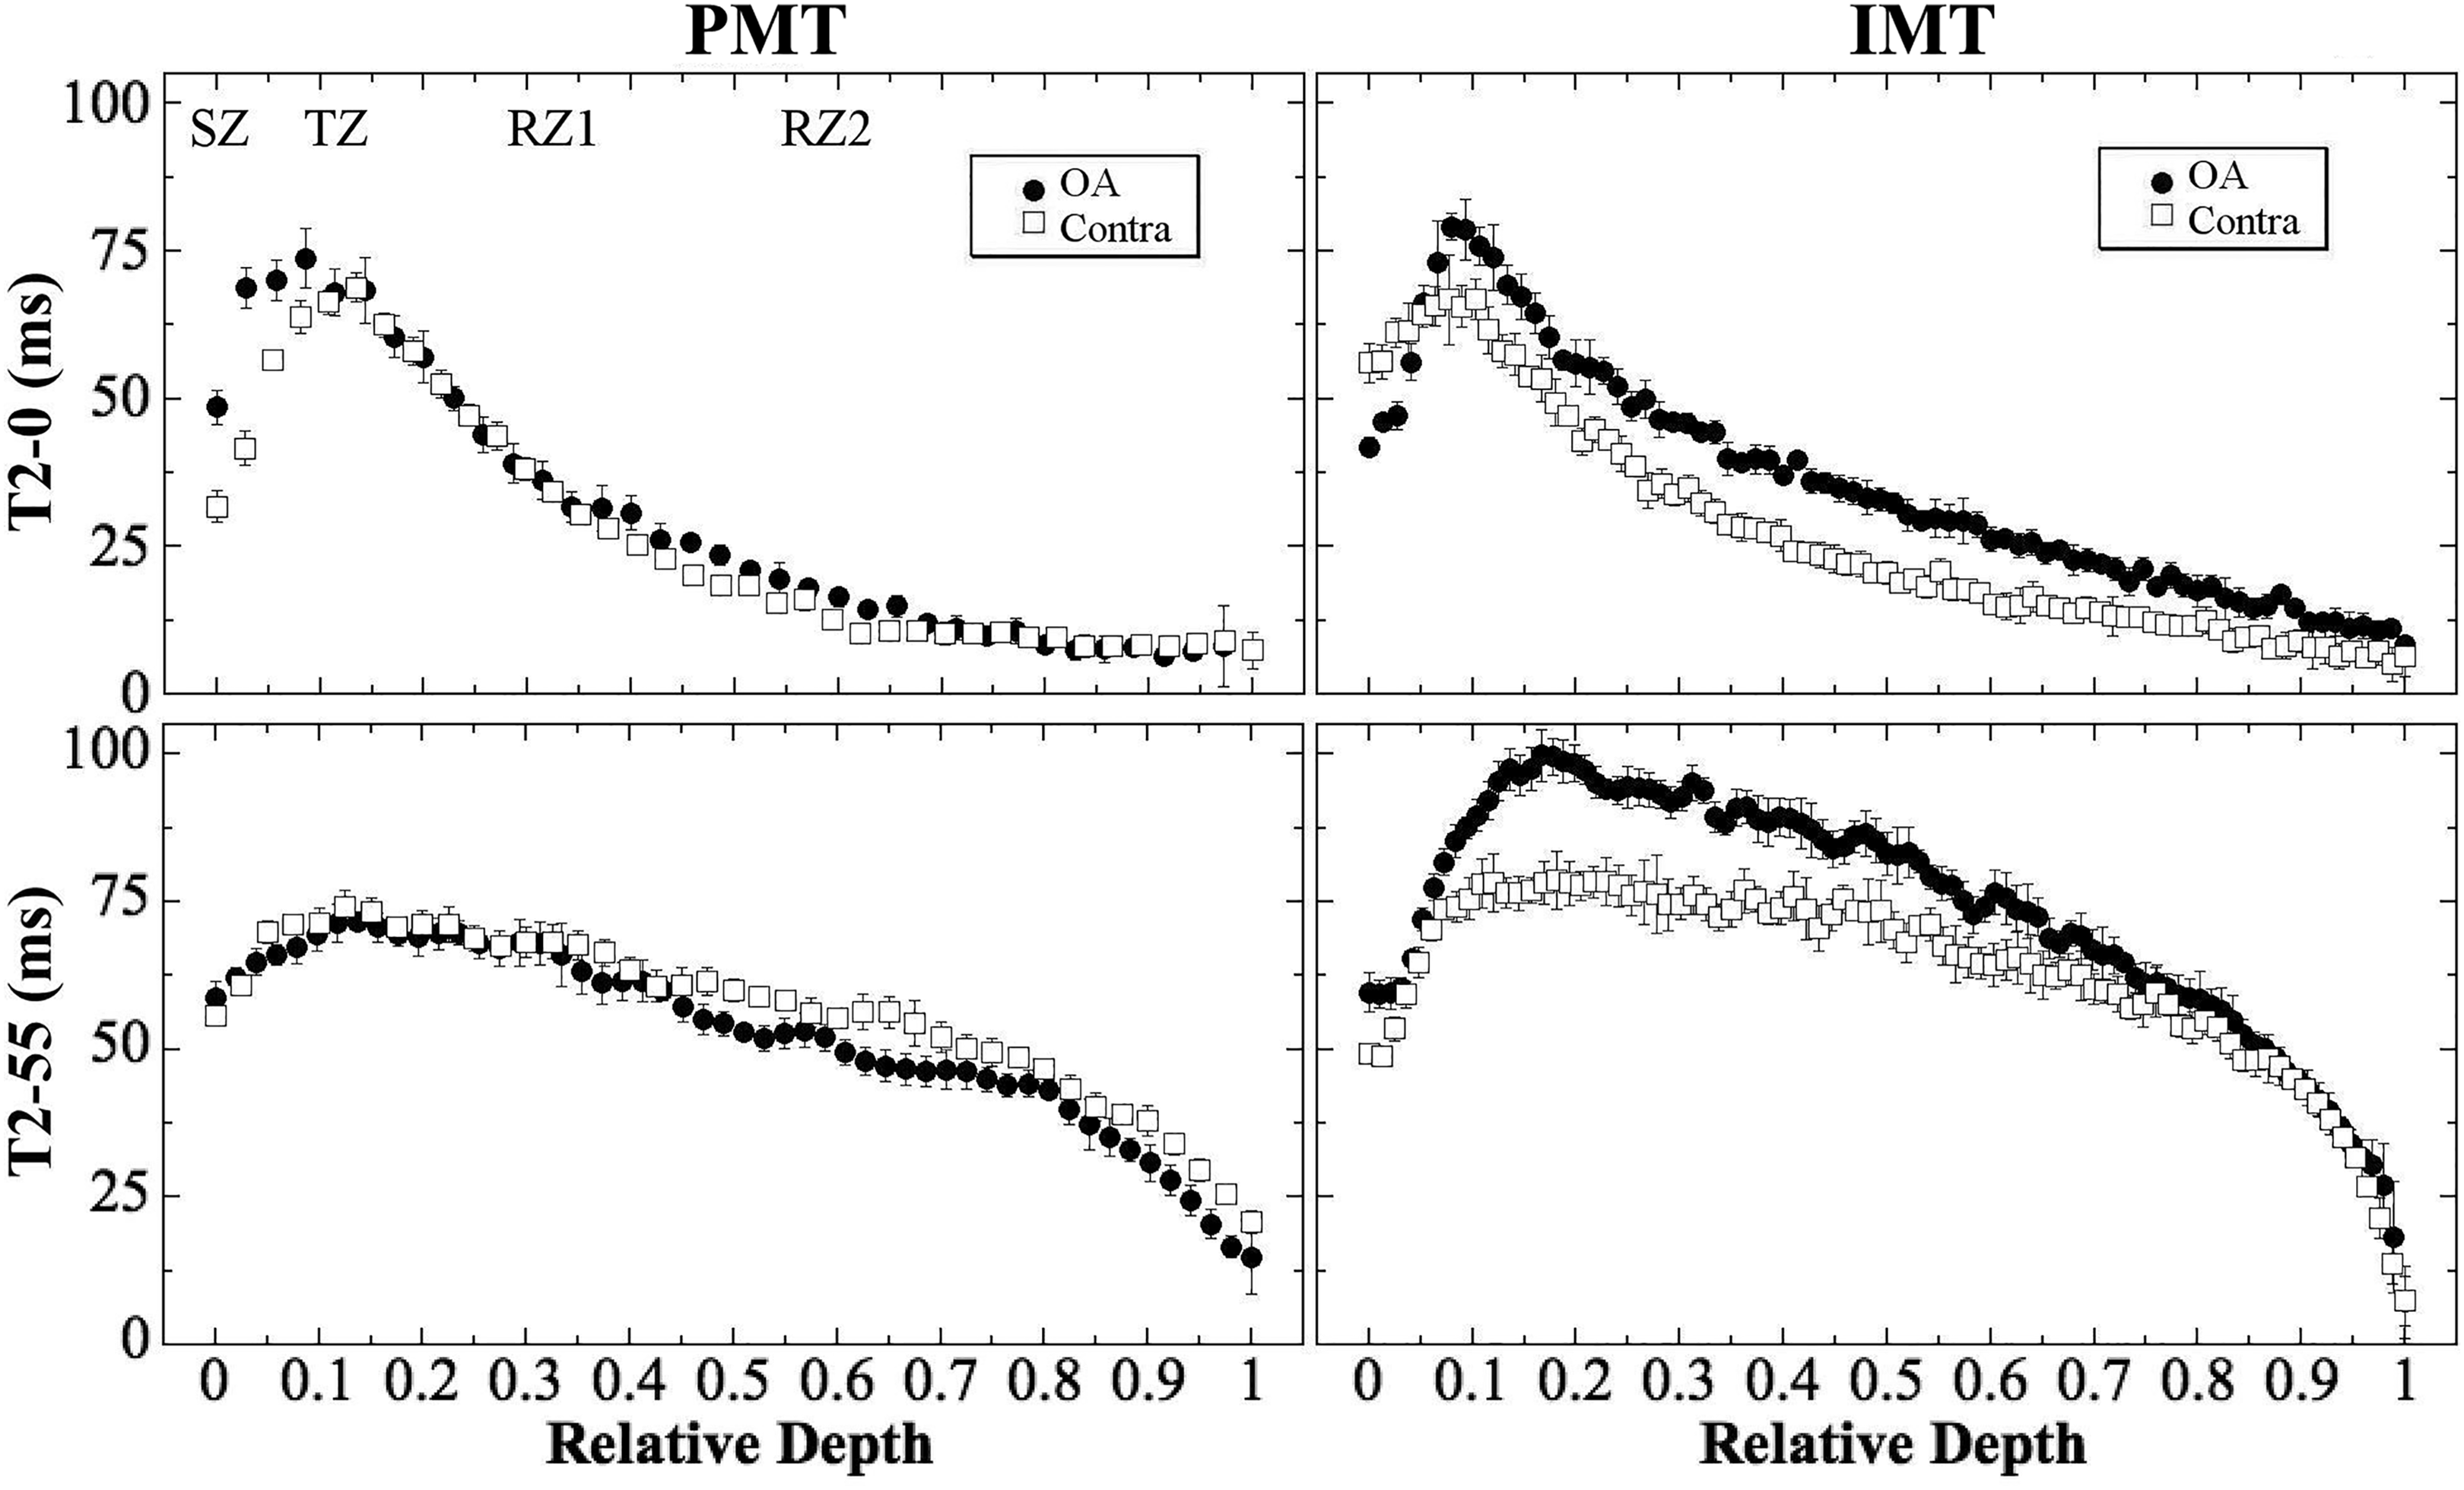
Representative T2 profiles from the OA and contralateral cartilage shown in Figure 2. The labels in the first plot illustrate the locations of the sub-tissue zones: SZ, TZ, RZ1, and RZ2. OA: osteoarthritis; SZ: superficial zone; TZ: transitional zone; RZ1: upper half radial zone; RZ2: lower half of radial zone.
Full-thickness properties of cartilage
Table 1 summarizes the bulk (i.e. whole thickness) measurements of all specimens, including the total thickness by MRI, the MRI T2-0° and T2-55° average values, the modulus from the indentation stress-relaxation experiments, and the GAG values measured by inductively coupled plasma optical emission spectrometry from the adjacent tissues on the same joints (the ii blocks shown in Figure 1),
24
at all medial tibial locations (EMT, PMT, CMT, and IMT) and from both OA and contralateral cartilage. Several trends between the OA and contralateral cartilage could be identified from Table 1. The average total thickness of OA cartilage by MRI was consistently thinner at every location when compared to its respective contralateral tibia location. The differences between OA and contralateral cartilage averaged over the entire joint surface, however, were not significant statistically. The differences in the full-tissue averaged T2-0° and T2-55° values between OA and contralateral cartilages were mostly not significant statistically, except T2-0° at IMT and T2-55° at EMT. The modulus measurement from all specimens showed statistically significant differences between OA and contralateral cartilage at three topographical locations: EMT, CMT, and IMT. At these locations, the OA cartilages were consistently much softer than the contralateral cartilage (about 58–78% smaller in modulus), which are shown graphically in Figure 4. The modulus result agreed well with the bulk GAG concentration measurements from the adjacent tissues on the same joints, where the GAG concentration in OA cartilage was found to be significantly lower at the same topographical location (about 24–35% lower in GAG concentration).

The average modulus measured from the OA and contralateral cartilage from the stress-relaxation biomechanical experiments at all locations. *p < 0.05: statistical significance between the OA and contralateral cartilage at the same location. OA: osteoarthritis.
Zonal averaged properties of cartilage
Based on the previously verified criteria,
6,16
the whole thickness of the T2-55° profiles was divided into four sub-tissue zones, and the four zonal thicknesses at the four topographical locations are summarized in Table 2. The values of T2-0° and T2-55° for all specimens were then averaged within each sub-tissue zone based on the division of the zones. The zonal averaged T2 values at all locations (EMT, PMT, CMT, and IMT) and from both OA and contralateral cartilage are summarized in Table 2. Two trends between the OA and contralateral cartilage could be identified from Table 2. The zonal T2-0° measurements showed the statistical significances between the OA and contralateral cartilage only in the RZ1 and RZ2 at the IMT location. These differences reflect the significant difference in the bulk averages of T2-0° values at the same topographical location in Table 1. The zonal T2-55° measurements showed the statistical significances between the OA and contralateral cartilage in all four sub-tissue zones (SZ, TZ, RZ1, and RZ2) at the EMT location, where all zonal T2-55° values decreased in the OA cartilage. In addition, the zonal T2-55° measurements showed the statistical significances between the OA and contralateral cartilage in TZ and RZ1 at the IMT location, where the zonal T2-55° values increased in the OA cartilage.
Summary of MRI zonal measurements of cartilage.a

EMT: exterior medial tibia; PMT: posterior medial tibia; CMT: central medial tibia; IMT: interior medial tibia; SZ: superficial zone; TZ: transitional zone; RZ1: upper radial zone; RZ2: lower radial zone; OA: osteoarthritis; MRI: magnetic resonance imaging.
a The numbers in boldface indicate statistical differences between the OA and contralateral cartilage (p < 0.05).
Discussion
We have previously carried out a number of studies on the early detection of cartilage degradation induced by the ACL transection in the canine model using multidisciplinary techniques, including the first correlation study between quantitative MRI and polarized light microscopy, 15 and the topographical and zonal mapping of MRI properties under external loading. 23,35,36 These previous studies benefited from an early but more developed OA model (8–12 weeks following transection surgery). This study was challenging, since it aimed to detect a much earlier degradation, at merely 3 weeks past the transection surgery. Both biomechanical and biochemical measurements based on the whole-thickness tissue have successfully detected the degradation of cartilage at three of the four topographical sites (EMT, CMT, and IMT). MRI measurements at high resolution revealed small changes in the bulk thickness; however, the quantitative T2 revealed subtler and more complex patterns for the differences between the OA and contralateral medial tibiae.
Bulk measurements
The high compressive stiffness of healthy cartilage can be attributed to the high concentration of the proteoglycans in the tissue, 37,38 which have a high density of negative charges due to the abundant GAG side chains. In this project, the indentation stress-relaxation measurements found significantly reduced bulk moduli at three of the four topographical locations when comparing OA and contralateral cartilage. More importantly, these modulus results were highly consistent with the GAG concentration measurements from the adjacent tissue at nearly the same topographical locations. 24 These bulk data collectively carry two pieces of information. First, at 3 weeks after the ACL transection surgery, not all tibia locations developed the same degree of OA. This topographical variation of the OA development over the medial tibia surface likely reflects the differences in the particular instability and irregularity of the joint motion and degradation after the ACL transection. Second, the topographical data among the thickness, /modulus, and /GAG measurement in cartilage illustrate a disassociation between the total thickness and the modulus/GAG, that is, the total cartilage thickness cannot be used to accurately judge the tissue stiffness or the amount of GAG depletion in cartilage. Further experiments are warranted to investigate the implication of these observations.
The significant differences in OA and contralateral data in the biomechanical and biochemical measurements, however, did not translate to similar differences in the bulk MRI measurements. For example, the whole-tissue averaged T2 values only had significant differences in one location per orientation. Given the same tissue thickness (approximately a constant tissue volume), the depletion of GAG at the three locations (EMT, CMT, and IMT) would imply an associated increase of water content in the ECM of cartilage at the exterior, central, and interior locations. This additional amount of water should in principle increase the value of T2, which was only observed in the IMT location at the 0° orientation. These observations illustrate the challenges in using MRI T2 to detect a very early OA, which confirm that MRI T2 measurements are influenced not only by the amount of water in the tissue, but also collectively by several other factors, including the architecture of the collagen matrix 30,39,40 as well as the orientation of the cartilage specimen in the MRI magnet. 10,13,41
Zonal measurements of T2 relaxation
The zonal analysis is much more challenging in high-resolution MRI of articular cartilage, since the measurements are influenced not only by the disease and tissue architecture but also by the experimental sensitivities at microscopic resolution. 10,42 –44 In this study, the most significant differences in T2 between OA and contralateral cartilage were found in the exterior (EMT) and interior (IMT) locations, which are consistent with the bulk data in mechanical modulus and GAG concentration (Table 1). The inability of the zone-averaged T2 to detect the changes in most of the topographical locations in the earliest stages of OA reveals the complexity of using the zonal T2 analysis and the common 2-D imaging to detect cartilage degradation, which was observed in other animal models of OA. 15,45
Since T2 is least influenced by the dipolar interaction at 55° (the magic angle in MRI), T2-55° should be more sensitive to the OA degradation than T2-0°. For the zonal averaged T2-55° data at different topographical locations (Table 2), both increase and decrease of T2 were found in the tissue. These variations and inconsistencies at a very early stage of OA could not only have biological origins but also illustrate experimental difficulties in detecting subtle changes between contralateral and OA zonal-wise. For example, T2-55° data of the SZ could be influenced by the cartilage orientation as well as the partial volume effect. In contrast, the sample orientation or partial volume effect would not contribute considerably to the measurements for any internal voxels in TZ and RZ1. The deepest subzone RZ2 could be influenced by the subchondral bone and the presence of minerals. Further studies are needed to differentiate the influences of different factors (disease related vs. experimentally related) to the sensitivities of quantitative measurements in MRI at high resolution.
MRI detection of early degradation in OA
MRI T2 relaxation times in cartilage are sensitive to the motional dynamics of water molecules in the tissue ECM, which are modulated by the interactions between water and the macromolecules (proteoglycans and collagens) in cartilage. Depending upon the event that initiates a cartilage degradation, several distinctly different changes can occur in the tissue and differently at different stages of the disease development. 46 For the ACL transection-induced OA, the instability of the joint can biomechanically damage the articular surface of cartilage, the fibrillation of which will reduce its constraint to the GAG and allow for greater permeability and diffusion between the ECM and synovial fluid. The reduction of GAG in cartilage will allow additional influx of water into the tissue, as well as change the local architecture of the collagen matrix. 12 These two consequences of GAG reduction will have different roles on the MRI T2 relaxation measurement. The increase of water in a degraded cartilage will result in an increase in the T2 relaxation time in cartilage, which has been observed in many MRI studies. 9,12,15,47,48 The change of the local architecture of the collagen matrix in degraded cartilage, however, can have different influence on the MRI T2 measurement, depending on the precise disorganization as well as the orientation of this deformed structure in the magnetic field. 11,49,50
In this study of OA cartilage at 3 weeks after ACL transection surgery, we found a reduced compressive modulus in OA cartilage at three of the four topographical locations when compared to the contralateral cartilage. This localized softening correlates well with the site-dependent loss of GAG in the tissue (Table 1), which supports the previous established relationship between the GAG content and the stiffness of cartilage. 51 We also found in this study a well-maintained T2 characteristics in both OA and contralateral cartilage, with a strong magic angle effect (Figure 3). 13 This suggests that the initial cartilage degradation in this animal model begins with a GAG depletion which softens the tissue biomechanically, without changing the overall collagen architecture—except some minor surface fibrillation. 34
Conclusion
To the best of our knowledge, this is the first quantitative study of canine OA only 3 weeks after an ACL transection surgery by µMRI and biomechanical measurement on the medial tibial surface both topographically and depth-dependently. We show a number of significant changes in the OA cartilage, different for each parameter measured (compressive modulus, GAG concentration, bulk and zonal thicknesses, and T2 relaxation times at 0° and 55° specimen orientations). The characteristics of these topographic and depth-dependent changes in OA cartilage are likely associated with the very early changes in this canine model of OA. In particular, there are site-dependent variations in cartilage degradation across the medial tibia plateau. These findings illustrate the need for high-resolution and multisite inspection in clinical diagnostics of early OA in human: high resolution for the identification of small-size or partial-depth lesion, and multisite inspection for the identification of topographically distributed lesion sites, different in different individuals. Since µMRI and clinical MRI share the same physics principles and engineering architecture, 52 the ability of MRI to topographically, depth-dependently, and noninvasively characterize the early degradation in cartilage would allow for an improved understanding of different developmental stages of cartilage degradation shortly after the disease initiation in human diagnostics.
Footnotes
Acknowledgments
The authors are grateful to the National Institutes of Health (NIH) for supporting this project. The authors thank Dr John Matyas (University of Calgary, Canada) for providing the specimen, Dr Nian Wang (currently at Duke University) for MRI expertise, Farid Badar (Oakland University) and Dr Ji-Hyun Lee (currently at Uniformed Services University of the Health Sciences) for their help in planning the MRI experiments. Critical comment and editing on the final manuscript from Farid Badar are acknowledged.
Author contributions
YX received funding, designed the experimental protocols, participated in the data analysis, and revised the manuscript. DM performed all MRI experiments and data analyses and drafted the manuscript. DK performed biomechanical experiments and analyses. All authors edited and approved the manuscript.
Declaration of conflicting interests
The authors declared no potential conflicts of interest with respect to the research, authorship, and/or publication of this article.
Funding
The author(s) disclosed receipt of the following financial support for the research, authorship, and/or publication of this article: This work was supported by the National Institutes of Health (NIH) through the R01 grants (AR052353, AR069047; PI: YX)