
Abstract
Introduction:
We conducted a study to elucidate the correlation between the anatomy of the shoulder joint with the development of rotator cuff tear (RCT) and glenohumeral osteoarthritis (GHOA) by using acromioglenoid angle (AGA).
Materials and Methods:
The AGA is a new measured angle formed between the line from midglenoid to lateral end of the acromion with the line parallel to the glenoid surface. The AGA was measured in a group of 85 shoulders with RCT, 49 with GHOA and 103 non-RCT/GHOA control shoulders. The AGA was compared with other radiological parameters, such as, the critical shoulder angle (CSA), the acromion index (AI) and the acromiohumeral interval (AHI). Correlational and regression analysis were performed using SPSS 20.
Results:
The mean AGA was 50.9° (45.2–56.5°) in the control group, 53.3° (47.6–59.1°) in RCT group and 45.5° (37.7–53.2°) in OA group. Among patients with AGA > 51.5°, 61% were in the RCT group and among patients with AGA < 44.5°, 56% were in OA group. Pearson correlation analysis had shown significant correlation between AGA and CSA (r = 0.925, p < 0.001). It was also significant of AHI in RCT group with mean 6.6 mm (4.7–8.5 mm) and significant AI in OA group with mean 0.68 (0.57–0.78) with p value < 0.001 respectively.
Conclusion:
The AGA method of measurement is an excellent predictive parameter for diagnosing RCT and GHOA.
Background
Rotator cuff disease is a common cause of shoulder pain and disability and, in severe cases, may affect activities of daily living. It is also one of the most common diseases among patients who have shoulder disorders. Painful rotator cuff arthropathy affects the independence of the elderly 1 by altering the biomechanics 2 and bony structure of the glenohumeral joint. 3,4 The seriousness of the disease is evaluated by clinical and radiological assessment. 5 It is treated conservatively with analgesics and regular physiotherapy. Surgical treatment is indicated when conservative management has failed or if there is a rotator cuff tendon tear.
Several factors have been suggested as pathogenesis for rotator cuff tear (RCT); however, it is still not entirely understood. Many studies have been conducted to determine the correlation between anatomy of the shoulder joint with the development of RCT and glenohumeral osteoarthritis (GHOA). Bigliani et al. 6 studied the morphology of acromion and its correlation with incidence of impingement and RCT.
Nyffeler et al., 7 who invented the acromion index (AI), investigated the correlation between the large lateral extension of acromion with RCTs. They concluded that the vertical force vector produced by the middle fibres of the deltoid are influenced by the lateral extension of the acromion. The resultant force causes ascending migration of the humeral head, leading to an increased subacromial friction, predisposing to degenerative wear and RCT.
Osteoarthritis of the shoulder joint occurs due to biochemical breakdown of the articular cartilage including the bone and joint capsule. 8 This results in narrowing of the joint space and thereby producing friction with the humeral head leading to formation of subchondral sclerosis and osteophytes.
Sintzoff et al. 9 studied the normal interval or distance between the lowest point of the acromion and the highest point of humeral head (acromiohumeral interval (AHI)) and found that the reduction of distance is associated with tear of the rotator cuff. Another study by Nove-Josserand et al. 10 reported that a reduction of the AHI indicates a full thickness RCT.
A more recent study reported in 2013, by Gerber et al., 11 introduced a critical shoulder angle (CSA) to look at the association between the anatomy of the scapula with the development of RCT and GHOA.
Similarly, the present study is to determine the correlation between the anatomical morphology of the scapula and the incidence of RCT and GHOA. However, we applied a new radiological measuring angle, using the midglenoid as a reference bony point instead. We also measured its significance by comparing it with established measurements and indices as mentioned above.
Objectives
The purpose of this prospective study is to evaluate and determine the statistical significant value between the incidence of RCT and GHOA in relation to the radiologically measured bony indices and angles.
Hypothesis
Changes in acromioglenoid angle (AGA) is associated with high prevalence of RCT and GHOA. The AGA can be utilized as a predictor of patients with RCT and GHOA.
Methodology
This study was conducted within a duration of 2 years from August 2013 to July 2015. All patients were seen in our hospital after approved by the ethical committee. Patients were seen for various shoulder symptoms with the most common complaint being painful shoulder. Patients were screened by history, thorough clinical examination, and were subjected to a bilateral shoulder X-ray (true anteroposterior view; Figure 1).

True anteroposterior view (rotate affected shoulder 30–40° and the beam aimed perpendicular to plate) – to get glenoid in a line.
This X-ray was done as a routine baseline radiological investigation of the disease. The true anteroposterior view on X-ray allows a more accurate study of the bony details. In this particular study, we utilized the standardized true anteroposterior view where the affected shoulder was rotated to 30 degrees and the beam aimed perpendicular to the plate as to get the glenoid in a line. This method ensured the humeral head position to be standardized in similar position, thus eliminating the effect of humeral head position. The angles and indices of the shoulder joint were studied and measured by an observer, and later compared to determine significance using statistical significance programmes.
Narrowing the shoulder joint space, the presence of osteophytes and subchondral sclerosis was observed, which is the diagnosis of GHO
Based on investigations done, we divided the patients into three groups: a group of patients with RCT confirmed by MRI, a group with GHOA evident by X-ray and a control group with a normal rotator cuff without any arthritic changes of the shoulder.
The roentgenogram of all three groups was reviewed and analysed using our new radiological parameter, the AGA as well as the other traditional measurements, such as, the AHI, AI and the CSA as reference to support our data.
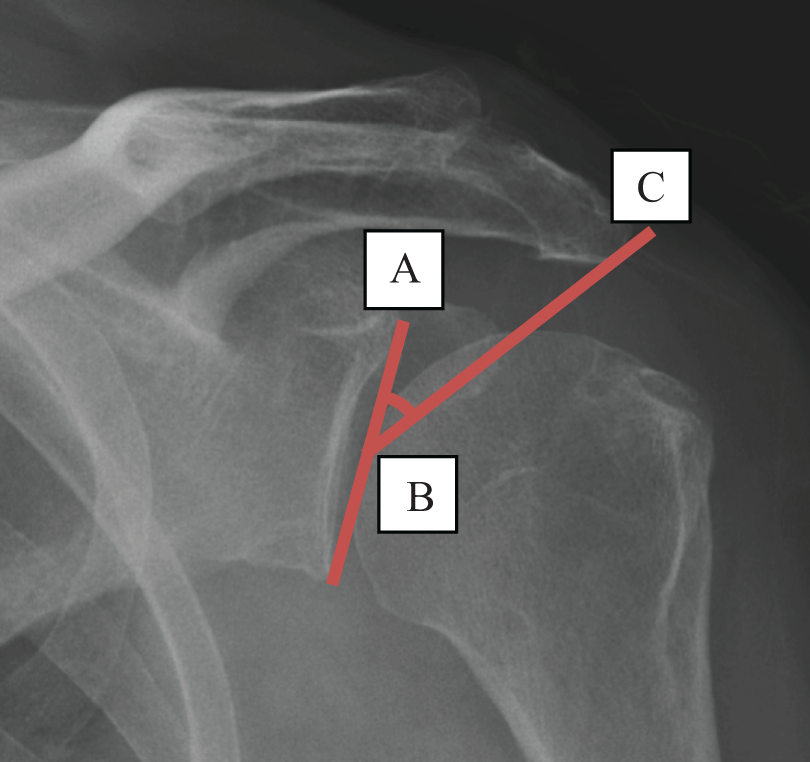
These parameters were measured as follows: AHI was measured between the most inferior point of the acromion and the most superior point of the humeral head (Figure 2). AI was a result of proportion between a line best fitting the direction of the glenoid with the most lateral point of the acromion and a line best fitting the direction of the glenoid with the most lateral point of the humeral head (Figure 3). CSA was measured between the lowest point of the glenoid following its inclination and the most lateral point of the acromion (Figure 4). AGA was determined between the midpoint of the glenoid following its inclination and the most lateral point of the acromion (Figure 5).

Acromiohumeral interval 10 (between the most inferior point of the acromion and the most superior point of the humeral head).
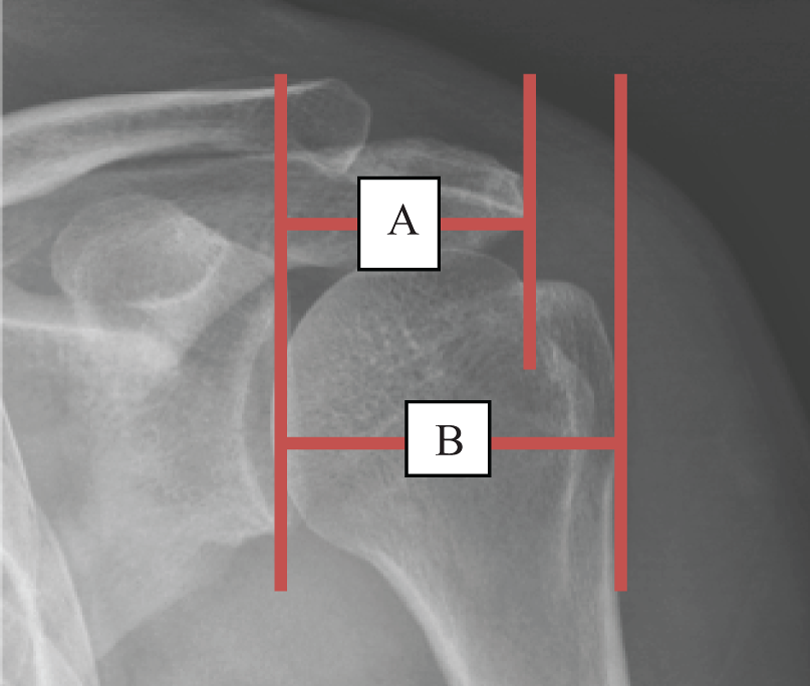
Acromion index 7 (proportion between a line best fitting the direction of the glenoid and the most lateral point of the acromion, A, and a line best fitting the direction of the glenoid and the most lateral point of the humeral head, B).

Critical shoulder angle 11 (measured between the lowest point of the glenoid of a line best fitting the direction of the glenoid and the most lateral point of the acromion, ∠ABC).
Acromioglenoid angle (between the midpoint of the glenoid of a line best fitting the direction of the glenoid and the most lateral point of the acromion, ∠ABC).
A 2 years’ worth of data was collected and analysed using the latest version of SPSS 20 with statistical analysis performed by our statistician. The cut-off point for CSA and AGA values in diagnosing RCT and GHOA was determined using the receiver operating characteristics (ROC) curve by identifying the area under curve (AUC), sensitivity and specificity. The Bland–Altman analysis was also used to assess the level of agreement between the two methods (AGA and CSA), comparing the new measurement with the established one. Correlational and regression analysis were performed.
Results
At the end of this prospective study, we analysed 103 shoulders in the control group, 85 shoulders in the RCT group and 49 shoulders in the GHOA group. We found that the mean AGA was 50.9° (45.2–56.5°) in the control group, 53.3° (47.6–59.1°) in the RCT group and 45.5° (37.7–53.2°) in the GHOA group (Table 1). Based on the cut-off points, AGA was determined as >51.5° for RCT (AUC = 0.65, sensitivity = 61.4%, specificity = 64.1%), there were 61% of RCT group been assigned (AUC = 0.66, sensitivity = 81.2%, specificity = 48.5%) and AGA < 44.5° (AUC = 0.74, sensitivity = 63.3%, specificity = 99.9%), 56% were in GHOA group (Table 2).
Mean degree of AGA and CSA in relation to RCT and OA.

AGA: acromioglenoid angle; CSA: critical shoulder angle; RCT: rotator cuff tear; OA: osteoarthritis; SD: standard deviation.
AGA and CSA cut-off determinants for RCT and OA.
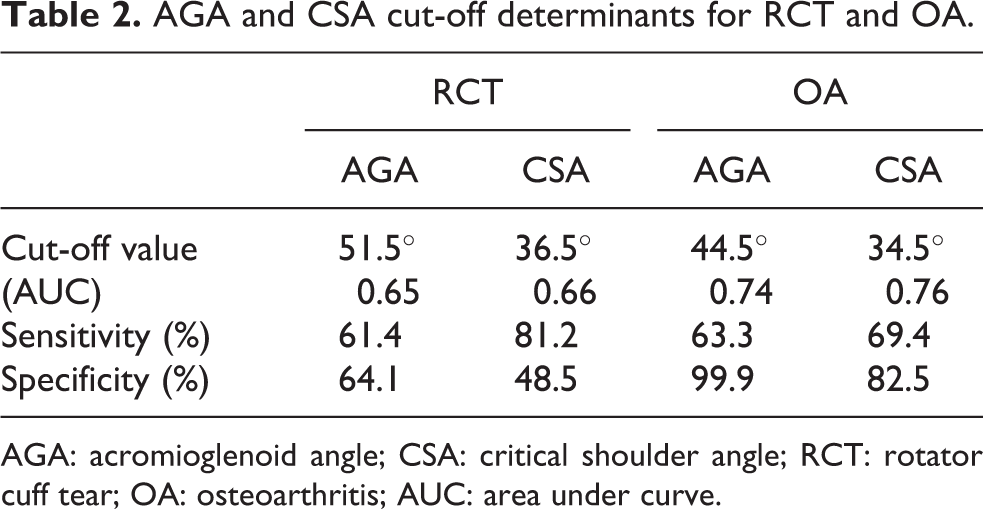
AGA: acromioglenoid angle; CSA: critical shoulder angle; RCT: rotator cuff tear; OA: osteoarthritis; AUC: area under curve.
The mean CSA was found to be 37.4° (33.7–41.1°) in the control group, 39.4° (35.0–43.8°) in the RCT group and 33.0° (27.4–38.6°) in the GHOA group. Eighty-one percentage of patients with CSA > 36.5° were in the RCT group (AUC = 0.66, sensitivity = 81.2%, specificity = 48.5%) and 68% of patients with CSA < 34.5° were in the GHOA group (AUC = 0.76, sensitivity = 69.4%, specificity = 82.5). Pearson correlation analysis had shown significantly strong correlations between AGA and CSA (r = 0.925, p < 0.001; Figure 6). The Bland–Altman analysis indicates 95.4% of points were within the ±2 standard deviation mean difference.

Pearson correlation analysis graph.
The AHI also reveals significant value in the RCT group with a mean of 6.6 mm (4.7–8.5 mm), while the AI in the GHOA group proved significance with mean of 0.68 (0.57–0.78) and p value < 0.001 (Figure 7).

Bland–Altman analysis graph.
Discussion
Many theories regarding the cause of RCT exist. When the arm is elevated, the supraspinatus tendon passes under the anterior edge of acromion. 12 The critical area for wear on the humeral side is centred on the supraspinatus tendon and may involve the long head of biceps. 12 Since 95% of RCTs are caused by impingement, anterior acromioplasty is routinely performed in conjunction with a repair for a torn rotator cuff. 13
Bigliani described a higher prevalence of RCTs in patients with a hooked (type III) acromion than with a curved (type II) or flat (type I) acromion. 6 Hence, the morphological shape of the acromion was found to be the cause of the disease and played a major role in consideration for acromioplasty. However, in the last 10 years, new theories have surfaced, such as the AI in 2006 and proved its association of statistical value with prevalence of the disease, which challenges the old concept of Neer and Bigliani on disease cause.
Another morphological factor is a large lateral extension of the acromion which appears to be associated with full thickness tear of the rotator cuff. 7 The average AI and its standard deviation in full thickness RCT (0.73 ± 0.06) were higher than those in osteoarthritis (0.60 ± 0.08) but AI of asymptomatic shoulder with intact rotator cuff was in between (0.64 ± 0.06). 7
The mean AHI or distance (AHD) is 10.5 mm 9 with a range of 6–14 mm 14 or 7–13 mm. 15 AHD less than or equal to 7 mm indicates RCT with 75% specificity. 16 Gerber et al. 11 found that the lateral extension of the acromion gives various degrees of angle if measured from the inferior point of glenoid in the line best fitting the direction of the glenoid.
They determined the (CSA and found that the CSA is greater in the RCT group (38.0° with CSA > 35°, 84% in RCT group) and lesser in the GHOA group (28.1° with CSA < 30°, 93% in OA group) compared to the asymptomatic shoulder and intact rotator cuff group (33.1°). 11
The mean of CSA by Geber et al. was supported by this study. Our study showed the mean AGA was 50.9° (45.2–56.5°) in the control group, 53.3° (47.6–59.1°) in RCT group and 45.5° (37.7–53.2°) in GHOA group.
In comparison to the CSA, AGA produced a larger angle as result of measurement from the midglenoid point. We chose that particular point because the glenohumeral joint force reaction is centred at the midglenoid and the humeral head is held most stable by the rotator cuff muscles at the centre of the glenoid during elevation of the arm. 17,18
A torn rotator cuff tendon creates a space underlying the acromion, which is prone to collapse due to superior migration of the humeral head. Therefore, a shorter AHI is an indicative of RCT. Our study supports this theory with a mean AHI of 6.6 mm (<7 mm) 16 in the RCT group and a 9-mm AHI in the GHOA group.
The GHOA occurs when there is progressive softening and disintegration of the articular cartilage of the humeral head and glenoid. As the articular surfaces wear off, friction within the joint increases, causing progressive loss of the normal load-bearing surfaces resulting in pain and disability. 8 Reduction of the distance between the most lateral aspect of proximal humerus to the midglenoid plane increases the AI. There was also an association between a short acromion and GHOA. 11 Therefore, it is possible that the small mean of AI is associated with susceptibility to the development of GHOA. 7 A small AI favours the development of GHOA. 7 We found AI to be more significant in the OA group with a mean of 0.68 compared to 0.77 in the RCT group. We also concur that a high AI from a larger lateral extension of the acromion has a higher prevalence of RCT.
Conclusion
We concluded that our AGA method of measurement is an excellent predictive parameter for diagnosing RCT and GHOA, supported by its strong correlation with CSA, AHI and AI.
Footnotes
Declaration of conflicting interests
The author(s) declared no potential conflicts of interest with respect to the research, authorship, and/or publication of this article.
Funding
The author(s) received no financial support for the research, authorship, and/or publication of this article.