
Abstract
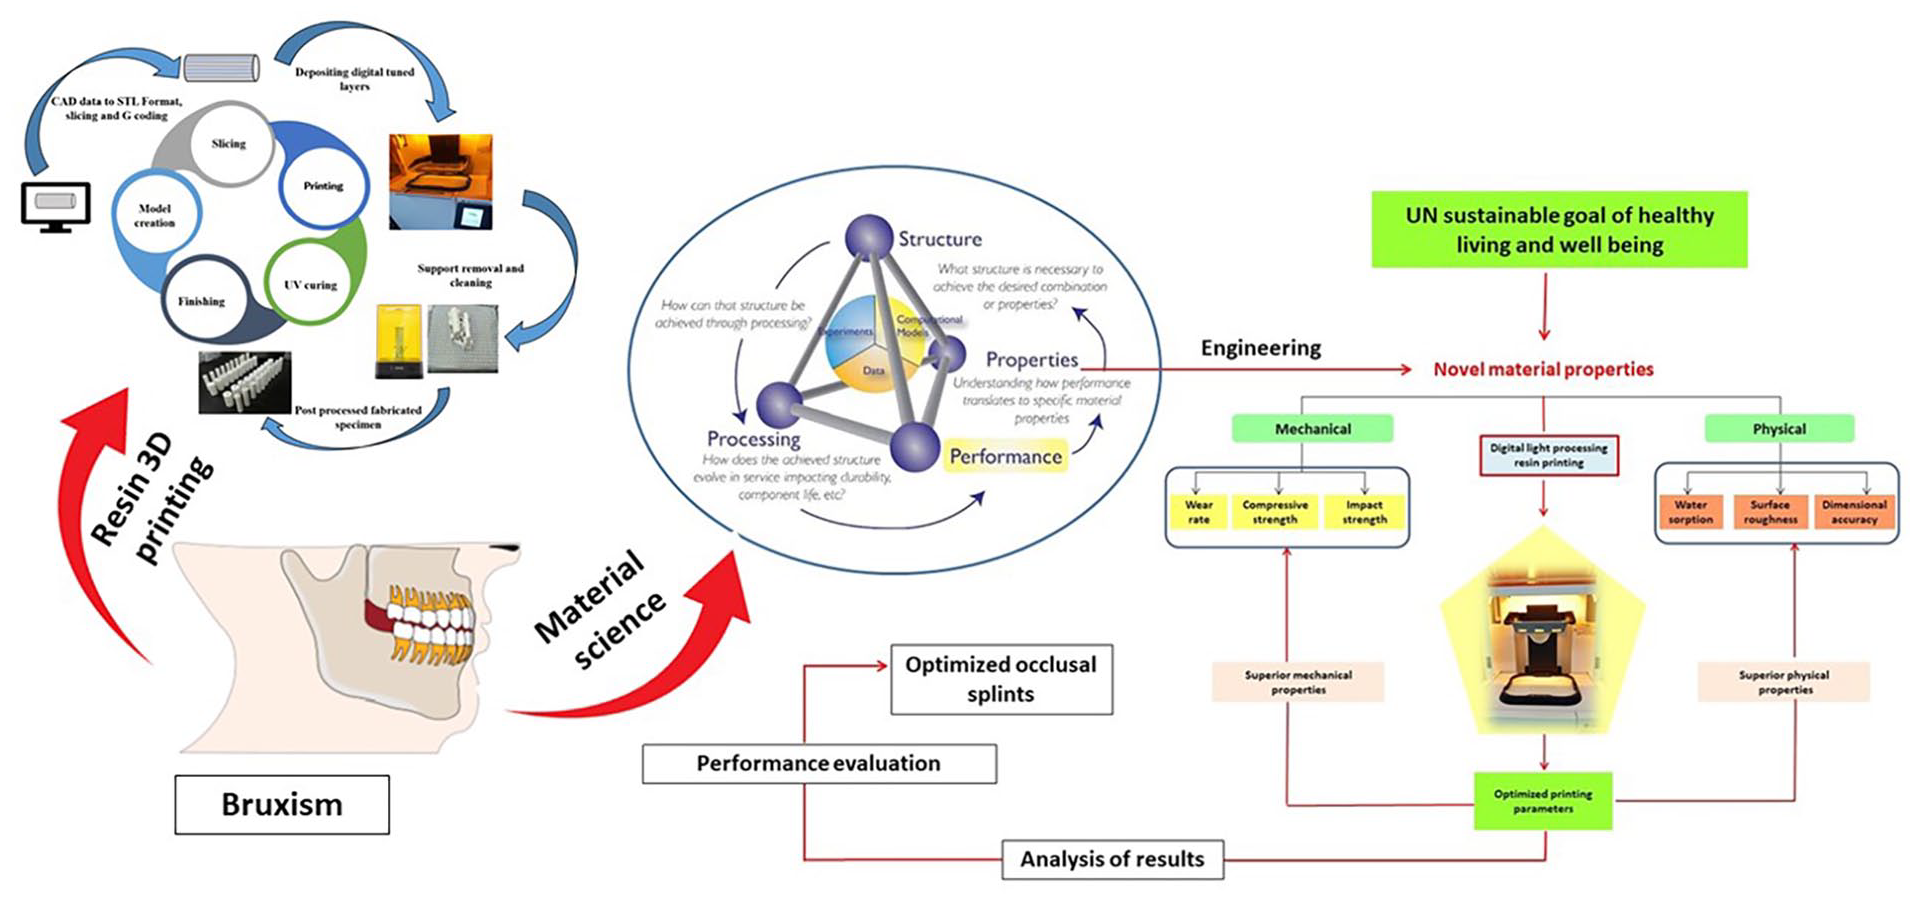
Bruxism affects millions worldwide, leading to dental damage like worn teeth and tooth loss. Resin 3D printing presents a promising method for creating intricate, comfortable, and durable occlusal splints. This study examines how printing parameters—layer thickness, orientation angle, and curing time—affect the mechanical (compressive strength, wear rate, impact strength) and physical (water sorption, surface roughness, dimensional accuracy) properties of occlusal splints made from a methacrylate-based resin. A total of 120 specimens were produced according to American Society for Testing and Materials (ASTM) standards using different parametric combinations. The response surface methodology (RSM) was applied to optimize key parameters. The optimum printing parameters for compressive strength include a layer height of 16.5 mm, curing time of 93.6 min, an orientation angle of 12.8º, yielding a compressive strength of 9.05 MPa, wear rate of 159 mm3/min, and impact strength of 71.58 J/m. Similarly, the optimum results for minimum surface roughness (8.013 microns), maximum dimensional accuracy (97.67 and minimum water sorption (0.386%) are achieved at a layer thickness of 16 mm, curing time of 93 min, and orientation angle of 12º. Results show that optimizing resin 3D printing parameters for occlusal splints significantly reduces production costs, particularly in regions with limited access to dental care, while promoting sustainable dental solutions by minimizing the environmental impact of traditional manufacturing methods and enhancing the efficiency of splint production.
Keywords
Introduction
Occlusal splints play a crucial role in dentistry, aiding in diagnosing and treating various dental conditions. With the advent of 3D printing technology, the fabrication of these devices has become increasingly accessible and efficient. However, fabricating splints with optimum mechanical properties using resin printing remains challenging for researchers and engineers working in the same area.1–3 The mechanical characteristics directly affect the performance and longevity of occlusal splints. Occlusal splints, which have been used in dentistry for the treatment of temporomandibular joint disorders (TMD) and bruxism, necessitate adequate compressive strength to endure the stresses applied during chewing and abnormal habits.4,5 The importance of the process factors for assessing the mechanical and physical properties of 3D printed resins cannot be overstated. 3D-printed polymers that are biocompatible and biodegradable provide dental splints that are customized and environmentally friendly. Some of the benefits are accurate customization, less waste, and the possibility of drug delivery. Challenges include choosing materials, finding a balance between biodegradability and strength, and obtaining regulatory permission. More research and clinical trials will lead to more acceptance. Process parameters consist of several variables such as layer thickness, printing speed, exposure duration, resin formulation, and post-curing procedures.6–9 Each of these parameters has a significant impact on the material characteristics and structural integrity of printed products. To optimize the manufacturing process and improve the effectiveness of 3D-printed occlusal splints it is necessary to understand the complex connection between process factors and mechanical properties. By carefully investigating the impact of each parameter on the output responses, researchers and practitioners can determine the ideal printing conditions that achieve a balance between mechanical strength and other desired attributes, such as surface smoothness, precision, and compatibility. Furthermore, the investigation of process factors extends beyond simply evaluating the properties of the material; it also involves optimizing the process and ensuring high quality.
Among the numerous factors that can influence the quality of Digital Light Processing (DLP)-printed parts, layer thickness, build angle, and exposure time are of utmost consideration. Mirkhalaf and Zreiqat 9 investigated the effect of various DLP printer parameters on surface topography, accuracy and mechanical strength using polyurethane photopolymer resins and found that increased build angles improved part accuracy, while decreased print speed resulted in greater part strength. When selecting layer times and post-curing temperatures, they reported that higher temperatures produced parts with a greater elastic modulus, but lower print speeds resulted in higher values of tensile strength. In addition, they found that shorter exposure times produced parts with a better surface finish, but longer curing times allowed for increased tensile strength values. 10 Jiménez et al. 11 conducted a study focusing on three aspects: build orientation effects on maximum stress conditions, Ultraviolet (UV) intensity effects, and influence on shrinkage behavior by varying the exposure time during the curing step when using ABS photopolymer resin material in a DLP printer machine, as well as a Liquid Crystal Display (LCD) printer machine setup under different UV intensities while controlling other relevant printing parameters such as resolution or layer thicknesses. The study revealed that adjusting the UV intensity helped to reduce shrinkage levels, which can negatively affect the final part dimensions, leading to dimensional inconsistency between prints, but also cause stress-related issues due to warping tendencies, which can lead to failure during assembly stages in high-temperature environments, such as 100°C or more, depending on application requirement scenarios. In conclusion, optimizing DLP process parameters has been shown to have significant impacts on mechanical properties, including surface topography, accuracy, elastic modulus, tensile strength, and flexibility, amongst others, when utilizing various types of photopolymer resins materials like polyurethane, Acrylonitrile butadiene styrene (ABS), epoxy acrylate & Poly ether ketone (PEEK) are some example of studies discussed here although many more research efforts exist throughout additive manufacturing (AM) world today alike all offering potentially viable solutions according required optimization requirements set forth application scenarios accordingly. 12 In various studies, 3D-printable material incorporating bioactive glass has been developed for orthodontic aligners. It liberated calcium and phosphate ions, displayed favorable mechanical properties, and exhibited biocompatibility. The material’s performance fluctuated based on printing direction, with vertical printing producing superior strength. Few research studies have sought to produce a 3D printable material possessing bioactive characteristics for transparent removable orthodontic devices. Bioactive glasses were included into acrylic monomers to liberate calcium, phosphorus, silicon, and fluoride ions. The materials underwent 3D printing and were evaluated for mechanical characteristics, ion release, and biocompatibility. The findings indicated that the material released ions over a prolonged duration demonstrated favorable mechanical qualities and was biocompatible.13–17
The increasing focus on environmental stewardship in dentistry requires a thorough assessment of conventional fabrication techniques and the investigation of more sustainable options. Traditional splint manufacturing frequently results in considerable material waste, high energy usage, and potentially detrimental consequences. 3D printing, with a layer-by-layer additive manufacturing technique, offers a promising method for alleviating these environmental challenges. This study examines the sustainability implications of 3D-printed resin occlusal splints, focusing on the impact of printing settings on material utilization, waste production, and possible energy consumption. By optimizing these factors, we want to determine fabrication procedures that reduce environmental impact while preserving the necessary performance attributes of the splints. This study will investigate resin selection, the correlation between printing parameters and material efficiency, waste management measures throughout the printing process, and, if possible, an analysis of energy use. This study aims to assess the capacity of 3D printing to enhance sustainability in dentistry practices. Table 1 provides an overview of recent literature demonstrating recent advances in the field of dental resins.
An overview of recent advances in digital dentistry demonstrating the effect of printing parameters on the performance of resin occlusal splints for a sustainable dentistry.

The present research aimed to investigate the effects of 3D resin printing parameters, including layer height, exposure time, and post-curing time, on the mechanical properties (such as wear rate, impact strength, and compressive strength) and physical properties (such as surface roughness and water sorption) of an occlusal splint. Additionally, the study sought to optimize and identify the best feasible combination of process parameters to achieve optimal mechanical and physical properties of the occlusal splint. The primary research objectives of the proposed study is to:
(i) To investigate the effect of 3D resin printing parameters (layer height, exposure time, post curing time) on mechanical properties (wear rate, fracture resistance, compressive strength, etc.)
(ii) To investigate the effect of 3D resin printing parameters (layer height, exposure time, post curing time) physical properties (surface roughness, water sorption, etc.) of an occlusal splint.
(iii) To optimize and hence to obtain the best feasible combination of working levels of various process parameters for achieving the best mechanical and physical properties of the occlusal splint.
Experimental implementation and layout
ASTM Test samples composed of methacrylate-based 3D printable resins were fabricated using a digital light processing (DLP)-based resin 3D printer (3D Systems, Inc., Rock Hill, SC, USA). 18 ASTM International, previously referred to as the American Society for Testing and Materials, is a worldwide authority is an organization that formulates and disseminates technical standards for a diverse array of materials, products, systems, and services. These standards, encompassing test techniques, specifications, procedures, recommendations, and classifications, are formulated through a consensual process that include industry professionals, engineers, scientists, and consumers. ASTM standards are extensively utilized for quality assurance, safety, interoperability, and commerce. They ensure product and material quality and consistency, enhance safety by establishing design, manufacturing, and testing standards, promote interoperability through common standards for various products and systems, and facilitate trade by offering a unified language and set of standards for businesses. Although these standards are voluntary, they are frequently integrated into regulations and codes by governmental bodies and other entities, and numerous firms elect to implement them to showcase their dedication to quality and safety.
The model was created using AutoCAD and subsequently converted into a printable format, facilitating the optimization of the input configurations for the 3D printer.18,24 Twenty optimal input parameter combinations were identified by employing the custom-based optimal technique offered by Design of experiments (DoE). DoE (Stat-Ease, Inc. 1300 Godward Street Northeast, Suite 6400 Minneapolis, MN 55413, USA) is a statistical technique employed to methodically arrange trials and evaluate the influence of various factors on a response variable. Face-Centered Central Composite Design (FCCD) is a specialized kind of Design of Experiments (DoE) that effectively models quadratic response surfaces and investigates the influences of many variables. It is extensively utilized across multiple disciplines, including engineering, to enhance processes and augment product efficacy.
Figure 4® Rigid White material is a mixture used for printing test specimens which is primarily composed of several chemical constituents. The composition of the material was described in Table 2.
Composition of 3D printed resin material (Rigid White) used in the study.

Specimens with the dimensions for determining the mechanical and physical properties were fabricated. According to the manufacturer’s instructions, the samples were washed in 90% isopropyl alcohol for 5 min before polymerization with UV light from both sides at various times. Figure 1 outlines the entire experimental workflow of the proposed research, from the computer-aided design (CAD) model preparation to the final stage of post-processing of the printed specimens.
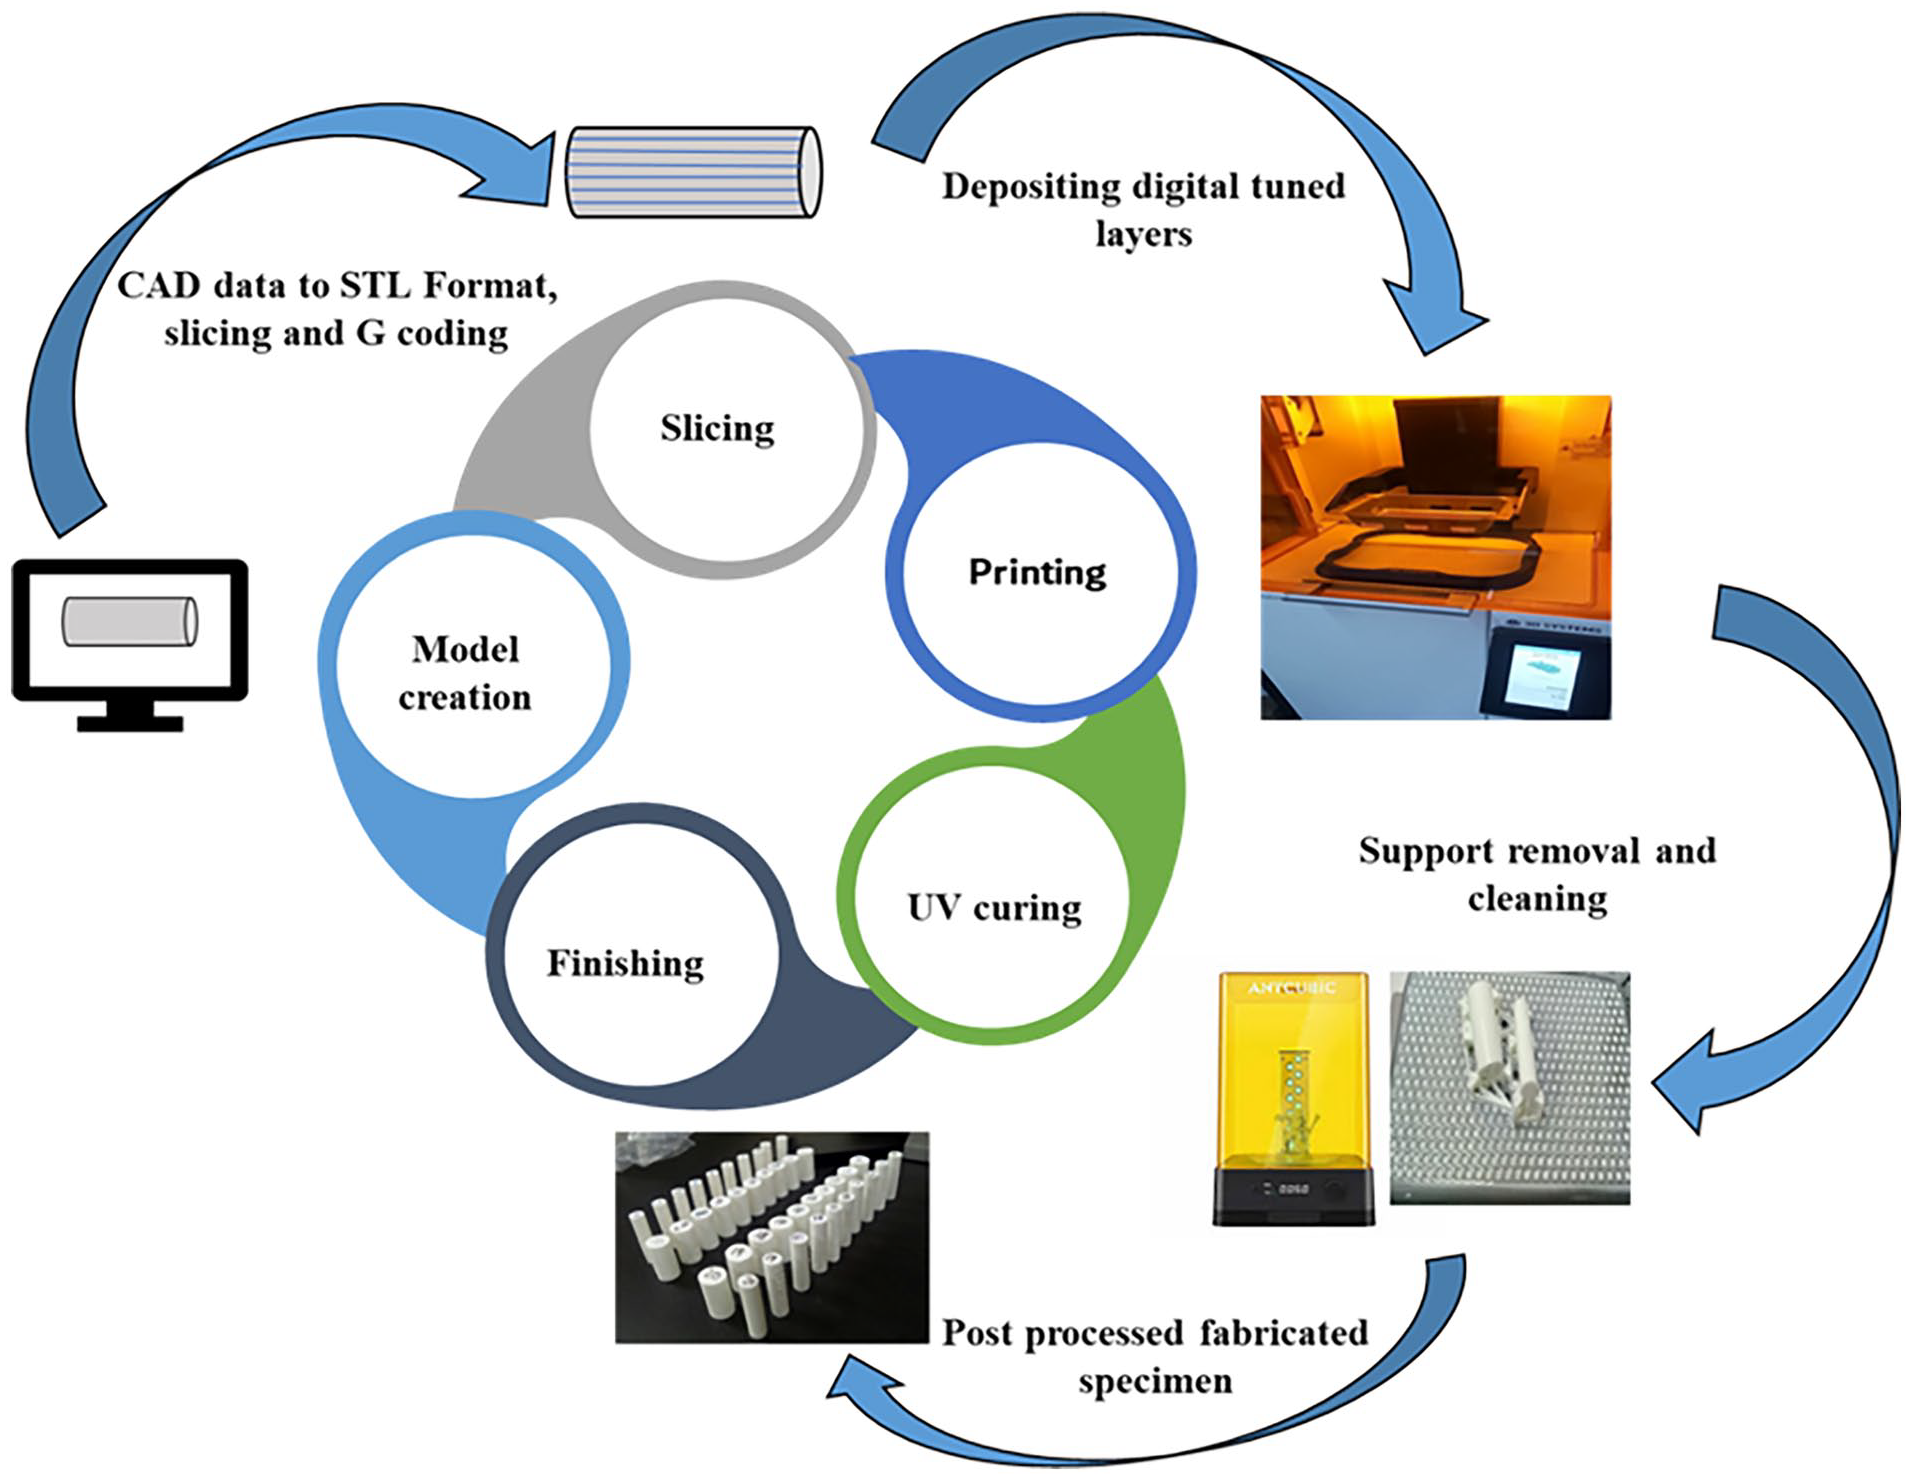
Workflow in developing the 3D model. 24
Universal testing machine
The Universal Testing Machine (UTM) was used in the present study to measure the compression strength of resin-printed specimens. The head movement is 10 mm/min during the crush test. Twenty specimens for each testing are fabricated and tested. Figure 2(a) shows the universal testing machine used in the present study.
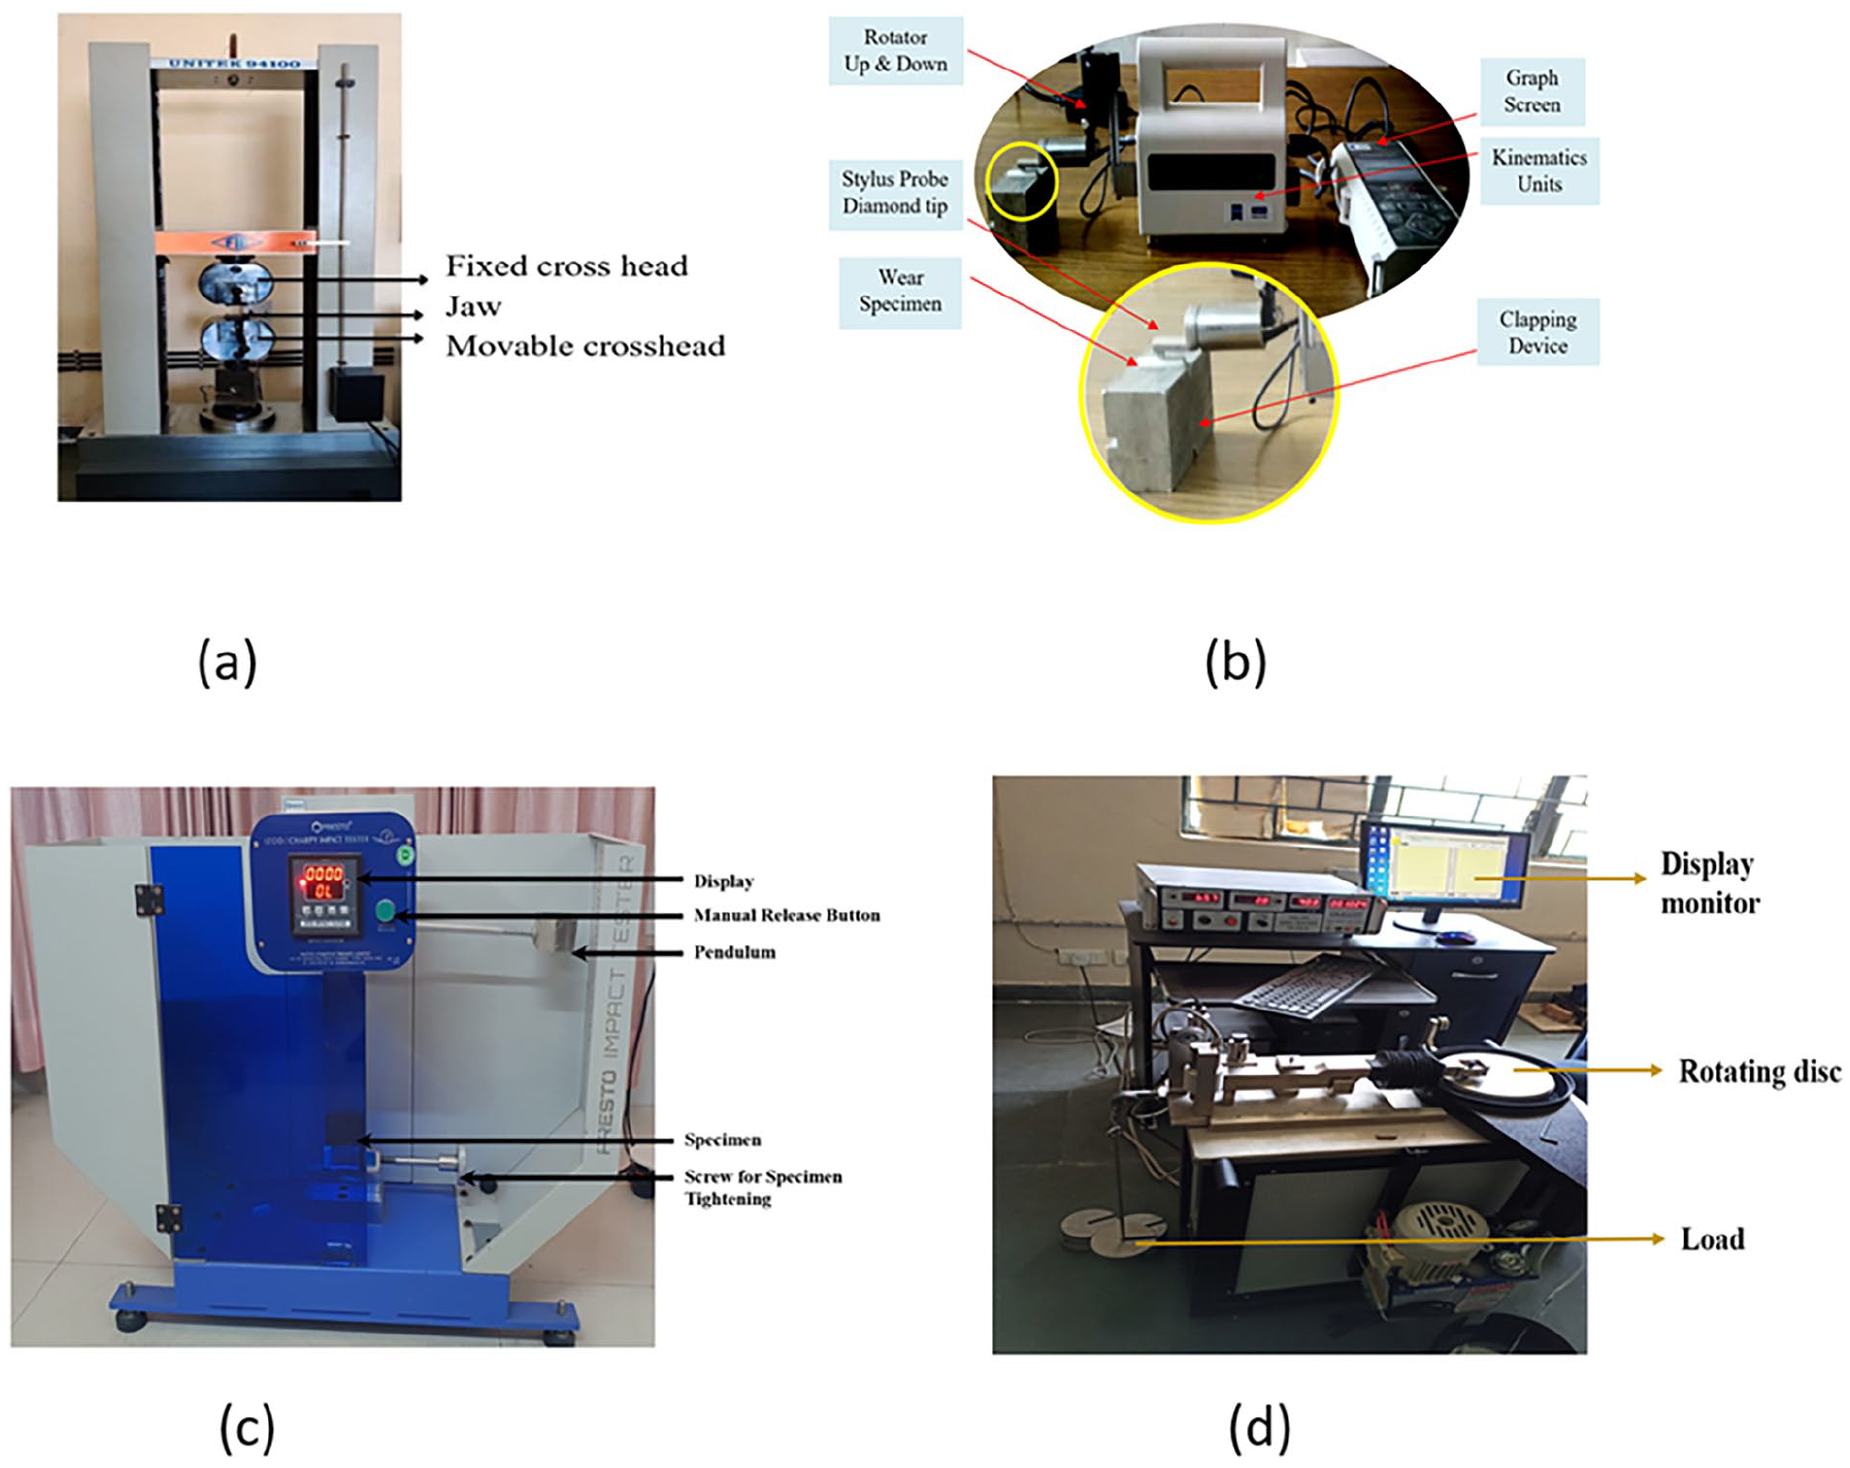
(a) Representation of FIE UNITEK 94100 universal testing machine, (b) surface roughness testing apparatus, (c) impact testing apparatus and (d) pin on disc setup for wear measurement.
Surface roughness tester
To measure the surface roughness of the 3D-printed specimen fabricated according to the ASTM D695 standard, a Surfcom S130A roughness meter (Tokyo Seimitsu Co., Ltd., Tokyo, Japan) was used, as shown in Figure 2(b). To accurately evaluate the surface roughness of a three-dimensional printed specimen utilizing a surface roughness tester, the first step was to securely mount the specimen on a solid surface. Therefore, it is imperative to perform this procedure to precisely quantify the surface roughness of the specimen. To establish a reference plane, a roughness tester equipped with a skidding probe was calibrated according to the manufacturer’s instructions. To provide precise and dependable data, the rate of measurement was set at a constant speed of 0.30 mm per second. To eliminate any undesired high-frequency noise, a Gaussian filter of the chosen type was employed, with a cutoff wavelength (c) set at 0.8 mm. This process aids in separating high-frequency from low-frequency elements. To obtain a representative sample of the entire specimen surface, the measuring length (L) was set to 10 mm. Once the measurement settings were properly adjusted, SurfcomS130A was used to contact the 3D-printed specimen. The probe was then dragged in a straight line across the entire specimen surface at a constant speed. The gadget records the surface profile data and then processes the readings to assess the surface roughness characteristics. This standardized experimental methodology facilitates the assessment of print quality and performance by guaranteeing accurate and dependable measurements of surface roughness for 3D printed objects.
Experimental setup for impact testing
The analysis of impact resistance was conducted using the Izod Impact Tester, an instrument produced by Presto Stantest Private Limited, as depicted in Figure 2(c). Rectangular samples measuring 63.5 mm × 12.7 mm × 12.7 mm (length × width × thickness) were created in accordance with ASTM D256 requirements, and their thickness and width were measured prior to performing the impact test. The samples were equipped with a V-shaped notch and positioned in the machine’s sample holder to ensure that the notch was precisely aligned beneath the striking edge. The sample size of 20 specimens was established by statistical power analysis to guarantee dependable results. Each individual specimen was subjected to an abrasion test for a duration of 5 min. A total of 20 specimens were tested on the machine to ensure statistical significance and to account for potential variations in material properties and manufacturing processes. This approach allowed us to obtain a reliable estimate of the material’s wear resistance and to identify any trends or outliers in the data. The pendulum of the machine was set to the desired initial height. When the pendulum was released, it swung downhill and hit the notched end of the specimen, resulting in its fracture. The Izod Impact testing equipment measures the energy that the specimen absorbs during impact, usually in joules per meter. Energy values were recorded meticulously and precisely.
Test setup for measuring wear rate
The DUCOM TR-20LE (Ducom Instruments (Asia) Bangalore, India)-on-disc wear-testing apparatus is a multifunctional device used to assess the tribological characteristics of materials in a controlled environment. The device functions by exposing a fixed pin to sliding contact with a revolving disc, replicating the circumstances of wear found in different applications. Specific working settings can be accurately replicated by precisely controlling key characteristics, such as load, speed, temperature, and atmosphere. The machine quantifies the wear volume, friction coefficient, and other pertinent data to offer insights into material performance and failure mechanisms. This equipment is extensively utilized in research and development, quality control, and failure analysis in several industries such as automotive, aerospace, and manufacturing.
ASTM G99 standard specimens were fabricated to evaluate the wear rate. A wear assessment was conducted on a load of 80 N revolving at a speed of 400 rpm, with a track diameter of 90 mm. Before any further steps, it was imperative to measure the initial mass of all the specimens. The initial weight of the printed specimens was recorded; accordingly, readings of the weight of printed specimens after testing were recorded. Figure 2(d) represents the pin on disc apparatus used for wear assessment.
Setup for measurement of water sorption
The water solubility and sorption (Table 3) experiments were performed in accordance with the International Organization for Standardization, ISO 20795-1:2013 standards. The diameter of the specimens was measured at three different sites, and the average of these measurements was recorded as the diameter of the specimen. The thickness of the specimen was determined at five locations: one at the center and four on the outlines. The specimens were stored in individual containers and immersed in water for 15 days. After extracting the specimens, they were subsequently exposed to the external environment for 60 min, after which their weight was measured again (m2). The water sorption value (µg/mm3) was calculated using the formula 25 :

Compression strength, impact strength, wear rate, surface roughness, and water sorption of printed specimens at different printing parameters obtained using DoE.

The entire process for the measurement of water sorption is shown in Figure 3, where Figure 3(a) represents the 3D design of the water sorption specimen, and Figure 3(b) depicts the resin-printed sorption specimen before processing. The post processed specimen are kept in isopropyl alcohol solution for approximately 10 min. In contrast, Figures 3(c) and (d) show the post-processed resin-printed water specimens and water sorption measurements using a weighing scale, respectively.

(a) 3D design of water sorption specimen, (b) resin printed water sorption specimen before processing, (c) post processed resin printed water specimens, and (d) water sorption measurement using a weighing scale.
Data modeling and optimization using response surface methodology
Response Surface Methodology (RSM) is a statistical method used to create models and optimize operations. This procedure entails devising studies to investigate the correlation between several input variables (process parameters) and a response variable (desired outcome). The RSM commonly uses a series of planned tests.26–28 First, a screening design, such as a factorial or fractional factorial design, was used to identify the important components that affected the response. Subsequently, a response surface design, such as a Central Composite Design, is used to create a polynomial model that relates the response to the process factors. Design-Expert software simplifies this procedure by creating experimental designs, fitting models, and displaying the response surfaces. Optimization is accomplished by identifying the set of process parameters that maximizes or reduces the response, typically via numerical optimization algorithms included in the program.29–31
Consequently, the extensive evaluation of the compression strength, impact strength, wear rate, surface roughness, and water sorption of resin 3D printed samples under different process parameters using the Design of Experiments (DoE) methodology has yielded valuable insights into the complex correlation between these properties and printing conditions. Table 3 provides the values of compression strength, impact strength, wear rate, surface roughness, and water sorption of the printed specimens at different printing parameters obtained using the DoE method, which provide a strong basis for optimizing the 3D printing process to obtain certain material properties. This study further aimed to enhance the mechanical and physical properties of printed parts using response surface methodology, contributing to the progress of additive manufacturing technologies and their prospective applications in various dental practices by identifying important process factors and their interacting effects.
Result and discussion
Influence of individual printing parameters on the output responses
The influence of particular printing parameters on every output response was studied using the constructed mathematical models. Design Expert 13 software was used to represent the plots that demonstrated the effects of individual printing parameters. The corresponding plot was drawn by adjusting the reference at the respective midpoint of the designed space and thereafter moving the particular printing parameters on either side of the reference enclosed in a specified range, keeping the remaining factors constant. A detailed discussion of the influence of several printing parameters on each output response is provided in the subsequent sections.
Influence of individual printing parameters on compressive strength
The perturbation plot in Figure 4(a) illustrates the individual impact of components A, B, and C on the compressive strength of the resin-printed specimens, where A, B, and C correspond to the layer thickness, curing time, and orientation, respectively. The plot revolves around a reference point, indicated by the black dot that symbolizes the ideal levels of all three components. The line representing factor A displays a slight curvature, suggesting a robust nonlinear correlation between A and the compressive strength. As the distance from the reference point increased in either direction, the compressive strength initially decreased, reached a minimum point, and then increased. 32 This indicates the presence of an ideal amount of factor A, which reduces the compression strength to a minimum. Factor B has a straight-line tendency, which represents a significant correlation between factor B and compression strength, indicating a strong positive association. As the magnitude of factor B increased, the compression strength also increased, and the line corresponding to factor C had a nearly horizontal profile, suggesting a negligible effect on the compression strength. As the distance from the reference point increased in either direction, the compression strength remained relatively constant. This indicates that changes in Factor C had a minimal impact on the response variable. Consequently, factor B seems to have the greatest influence on water absorption.

Perturbation plot for determining the influence of individual printing parameters on: (a) compressive strength, (b) wear rate, (c) impact strength, (d) surface roughness, (e) water sorption, and (f) dimensional accuracy.
Influence of individual printing parameters on wear rate
The perturbation plot in Figure 4(b) offers a comprehensive analysis of the individual and combined impacts of components A and B on the wear rate. The plot employs encoded units, with 0 serving as the baseline and positive and negative numbers denoting variations from this baseline. The perturbation plot for Factor A demonstrated a direct correlation with the wear rate. As factor A diverges from the reference point in all directions, the wear rate exhibits a consistent and gradual increase. 32 This indicates that Factor A exerts a substantial beneficial impact on the rate at which wear occurs, and this influence is consistent over the entire range that was examined. However, the perturbation plot for factor B demonstrated an intricate correlation with the wear rate. First, when the factor B increased from the reference position, the rate of wear decreased. Nevertheless, once a specific threshold was surpassed, additional increments in factor B resulted in a significant increase in the rate of wear. This indicated the most favorable configuration for factor B, resulting in the lowest wear rate. Overcoming this optimal point leads to a significant decline in the wear rate. Similarly, factor C, represented by a curvature in the perturbation plot, indicates that the wear rate first decreases at a certain point and then increases for a given range of parameters in the design space. A comprehensive understanding of these linkages is essential to optimize the process and reduce the rate of wear.
Influence of individual printing parameters on Izod impact strength
The perturbation plot in Figure 4(c) depicts a clear understanding of the individual influences of components A, B, and C on the Izod impact strength. The plot employs encoded units, with 0 serving as the baseline and positive and negative numbers denoting variations from this baseline. 33 The perturbation plot for factor A demonstrated a direct correlation with the Izod impact strength. As factor A varies from the reference point in any of the two directions, the Izod impact strength increases consistently. This indicates that factor A exerts a substantial and constant positive impact on the Izod impact strength throughout the entire range examined. The perturbation plot for factor B demonstrates a more intricate correlation with Izod impact strength. First, when factor B increased from the reference point, the Izod impact strength also increased. Nevertheless, once a specific threshold was reached, additional increments in factor B resulted in a decline in the Izod impact strength. This indicates the ideal configuration for factor B, where the Izod impact strength is optimized. Going over this optimal position led to a decline in Izod impact strength. The perturbation plot for factor C has a comparable pattern to factor B. An early rise in factor C results in an augmentation in the Izod impact strength, which is subsequently followed by a decline as factor C further increases. This indicates that there is an ideal configuration for factor C, at which the Izod impact strength achieves its highest value. The perturbation plot underscores the significance of all three components (A, B, and C) in exerting an influence on Izod impact strength. Factors A, B, and C demonstrated a mixture of linear and quadratic influences on the response variable. Factor A exhibited a consistently positive linear correlation, whereas factors B and C displayed ideal operating zones. Gaining a comprehensive understanding of these interactions is essential for optimizing the process and maximizing the Izod impact strength.
Influence of individual printing parameters on the surface roughness
The perturbation plot in Figure 4(d) illustrates the impact of different printing parameters on the surface roughness, while keeping all other elements at their optimal levels. In this case, the variables examined were A, B, and C, which likely corresponded to the layer height, curing time, and orientation angle, respectively. The plot revolves around a focal point where both A and C are set to their most favorable configurations. This plot yields several significant observations. The greater inclination of the line linked to factor A in comparison to component C indicates that changes in parameter A have a more significant impact on surface roughness. This suggests that even small changes in the layer height can have a considerable effect on the surface roughness of the printed material. Furthermore, the curvature of the lines offers valuable insights into the inherent connection between the parameters and the surface roughness. A linear relationship is denoted by a straight line for parameter B. The individual impacts of A and C intersect at the reference point but diverge as they travel away from this point. This implies that the impact of one parameter on surface roughness may depend on the magnitude of the other parameter. Therefore, the perturbation plot provides significant information on how changes in printing parameters A, B, and C affect the sensitivity of surface roughness. The interplay between the components adds complexity to the response, underscoring the importance of a thorough comprehension of their collective impact on surface roughness.
Influence of individual printing parameters on the water sorption
The perturbation plot in Figure 4(e) illustrates the individual impact of components A, B, and C on the percentage of water sorption, where A, B, and c correspond to the layer thickness, curing time, and orientation, respectively. The plot revolves around a reference point, indicated by the black dot that symbolizes the ideal levels of all three components. 32 The line representing factor A displayed a distinct parabolic form, suggesting a robust nonlinear correlation between A and water sorption. As the distance from the reference point increases in either direction, the absorption of water initially decreases, reaches a minimum point, and then increases. This indicates the presence of an ideal amount of factor A, which reduces the water sorption to a minimum. Factor B has a parabolic tendency and is less prominent than that of component A. Factor B also exhibits an ideal level that is associated with minimum water sorption. Nevertheless, the influence of factor B on water absorption seems to be less substantial than that of component A. Factor C exhibits a close-to-linear correlation with water sorption. As the magnitude of the departure from the reference point increased for factor C, the process of water sorption exhibited a consistent and gradual increase. This suggests that elevated levels of Factor C often result in greater water absorption. Consequently, Factor A appears to have the greatest influence on water absorption. The distinct parabolic form of the curve implies a more intricate correlation and a higher capacity for minimizing water absorption by optimizing factor A. Factor B also has an impact on water sorption; however, its influence is not as significant as factor A. Factor C demonstrates a reasonably direct correlation with water absorption and appears to have the least influence compared to the other two components.
Influence of individual printing parameters on the dimensional accuracy
The perturbation plot in Figure 4(f) graphically illustrates the impact of individual components A, B, and C on dimensional accuracy while keeping other factors fixed at their ideal levels, where A, B, and C correspond to the layer height, curing time, and orientation angle, respectively. The plot revolves around a reference point, indicated by the black dot, which represents the ideal configuration for both A and B. The line connected to factor A has a nearly level profile, suggesting a minor effect on dimensional accuracy. As the distance from the reference point increases in either direction, the level of dimensional accuracy remains mostly constant. This indicates that fluctuations in Factor A had a minimal impact on the response variable. 33 The plot illustrating factor B exhibits a distinct parabolic curve, suggesting a more intricate correlation between B and the dimensional accuracy. As the difference from the reference point increases in either direction, the level of dimensional accuracy initially increases, reaches a peak, and subsequently diminishes. This implies that there is an ideal level for Factor B that maximizes the precision of the measurements. Factor C, on the contrary, exhibits linear behavior with dimensional accuracy. Component B exerted a substantially greater impact on dimensional accuracy than components A and C, as indicated by the plot. The conspicuous curve of the line representing factor B unequivocally illustrates its influence on the response variable. Factors A and C, owing to their very level profile, have a minimal impact on dimensional accuracy.
Interaction effects of printing parameters on the output responses
The output responses may exhibit some disparity in the behavior resulting from simultaneous changes in significant input parameters. The study of the interaction effects of resin printing parameters on the mechanical and physical properties helps govern the process more explicitly. There are several instances when the analysis of interaction effects on output responses becomes challenging due to simultaneous variation in more than two input variables. Therefore, the present study is confined to examine the influence of two-way interaction only. The corresponding variation in respective response parameter due to the interaction of two printing parameters was adequately analyzed and evaluated using response surfaces and interaction effects obtained using Design Expert software. In order to draw the contour plots, any two of the printing parameters were varied simultaneously while keeping the third one constant at their corresponding center level and the results of all such interactions are described in the subsequent sections.
Interaction effects of input parameters on compressive strength
The contour map in Figure 5(a) depicts the correlation between two independent variables (layer height and curing time) and their influence on the compression strength as the output response, and the contour lines depict areas with identical compression values, which are displayed as a color gradient. The plot shows that the compression increases when both the layer height and curing time increase within the range examined. The upper-right area of the plot exhibits the highest compression values, suggesting a synergistic effect between the two elements, and the presence of curved contour lines indicates a non-linear correlation between the inputs and the response. This suggests that a mere increase in one element while maintaining the other at a fixed level may not result in a corresponding increase in compression, while the red dots indicate the locations of the experimental design points. Their arrangement across the plot facilitated the evaluation of the extent to which the experimental area was covered. For optimal results, it is preferable to distribute the design points evenly to capture the response surface adequately. Consequently, the contour plot visually illustrates the relationship between the layer height and curing time and their impact on the compression strength, and emphasizes the significance of simultaneously addressing both elements to enhance the output response. 34
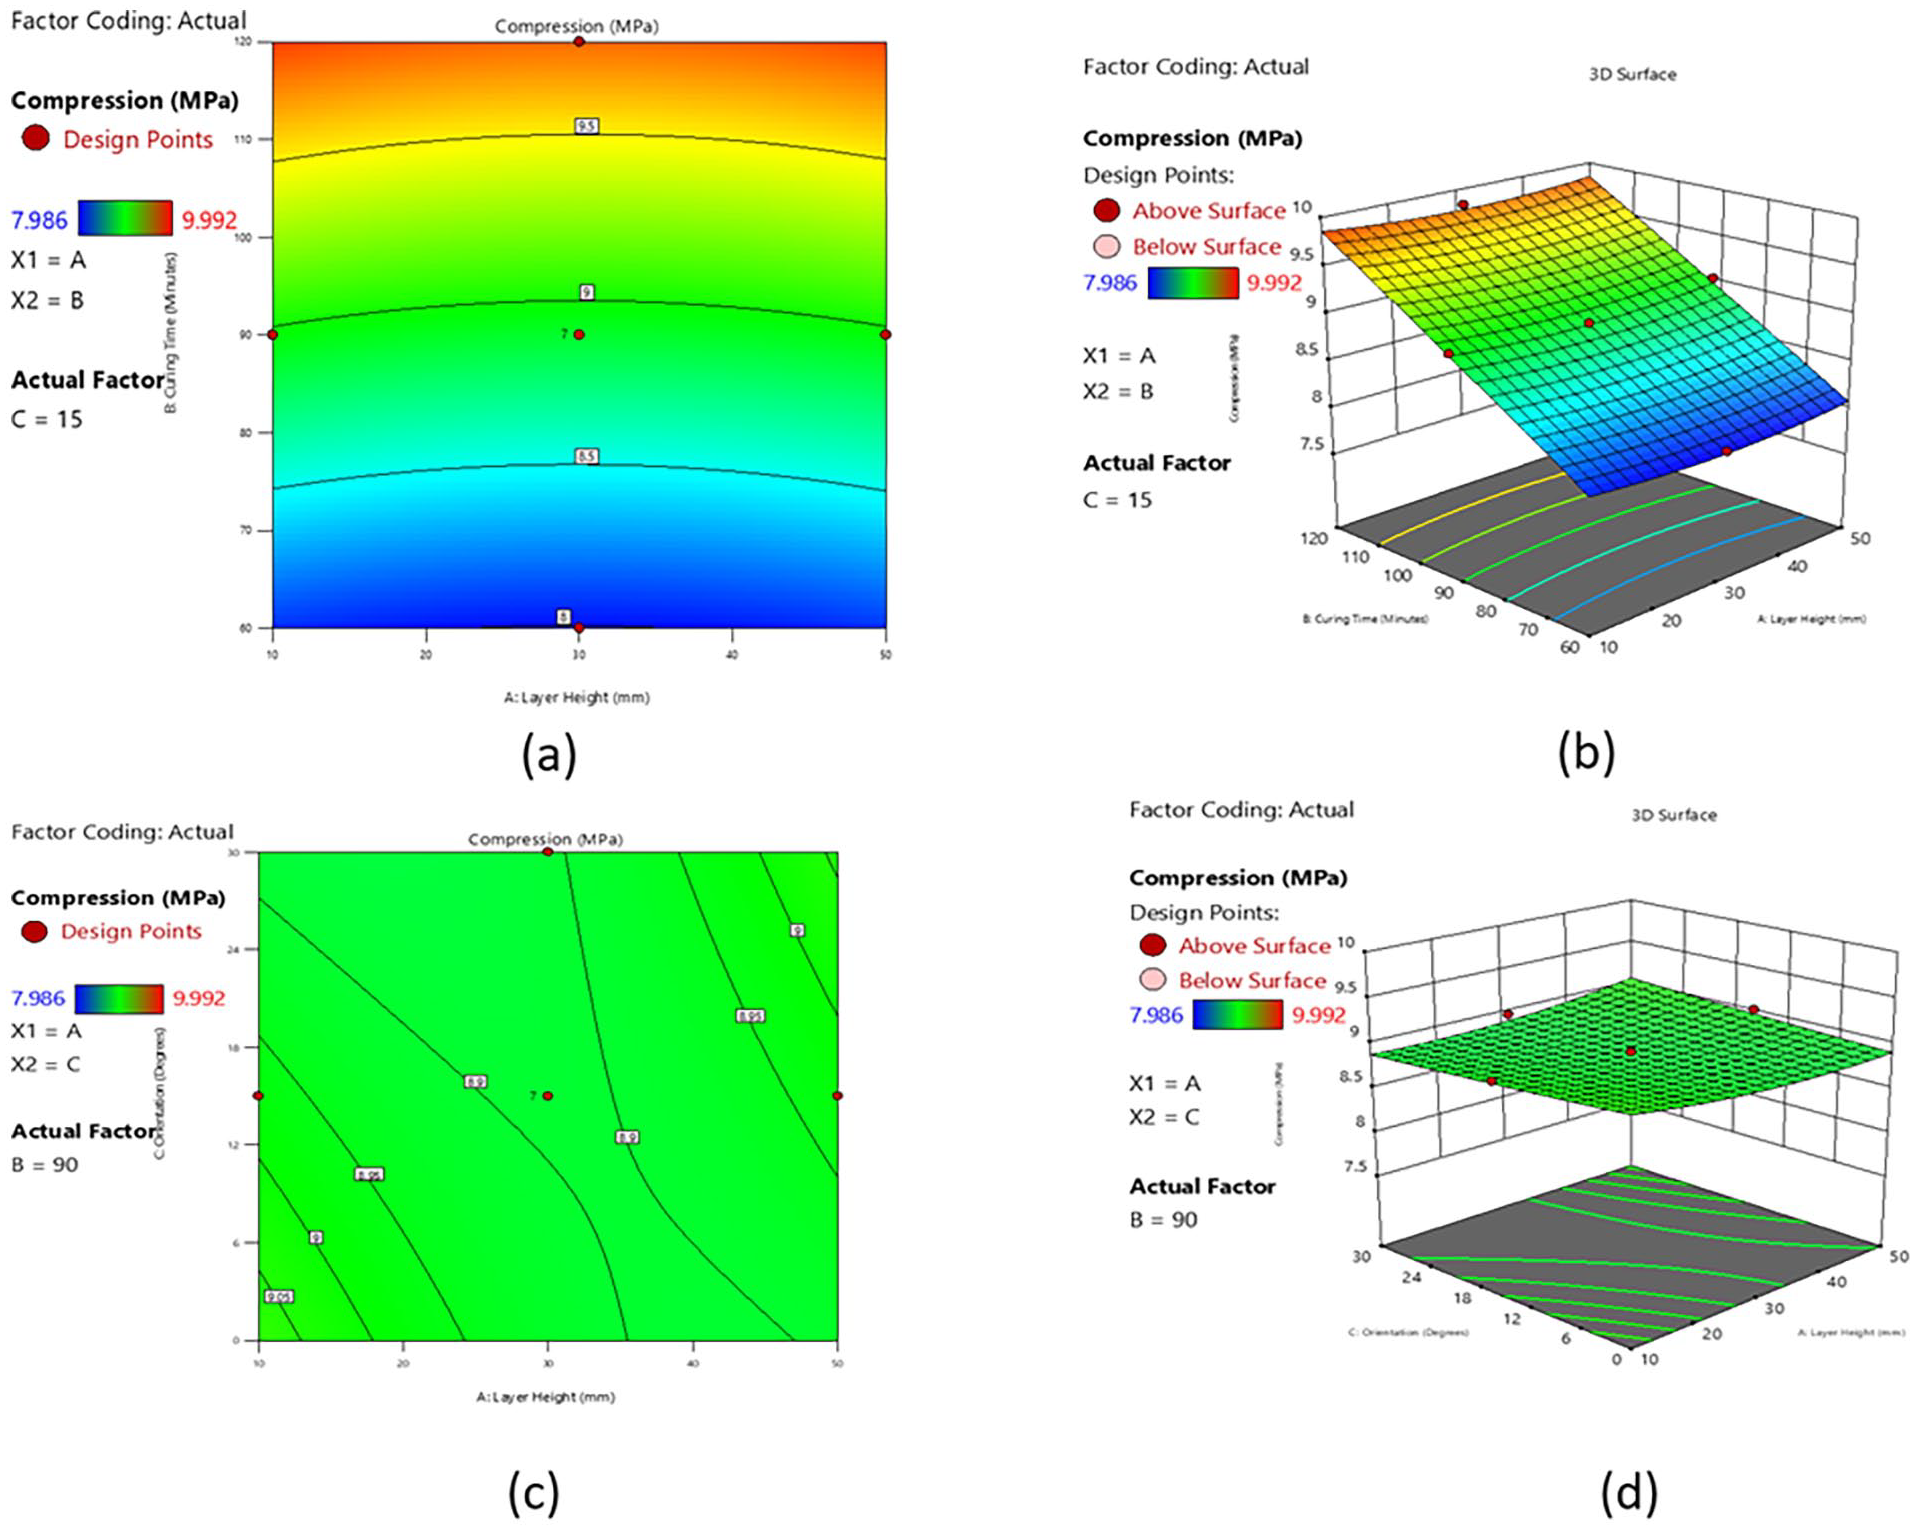
(a) Contour plot, (b) 3D surface plot representing interaction effects of layer height and curing time on the compressive strength, (c) contour plot, and (d) 3D surface plot interaction effects of layer height and orientation on the compressive strength.
The 3D surface map depicted in Figure 5(b) shows the correlation between the layer height and curing time with respect to the compression strength as the output response.
The variation in the color gradient on the surface is indicative of distinct compression values. Darker colors signify higher compression values, whereas lighter colors indicate lower values. The shape of the surface clearly demonstrates the interaction between layer height and curing time. The response (compression) has a nonlinear relationship with both parameters. The red dots in the graph correspond to empirical data points. The points were superimposed on the expected response surface, enabling a visual comparison between the projected and actual values. From the plot, it is evident that increasing both the layer height and curing time results in higher compression values within the studied range. Overall, this 3D surface plot offers a great visual depiction of the intricate correlation between the layer height and curing time on the compression strength of resin-printed specimens, and it functions as an initial step for subsequent research and optimization endeavors.
The contour map in Figure 5(c) depicts the influence of A-Layer Height and C-Orientation on Compression. The contour lines depict areas of equivalent compression, with darker tones indicating higher values. The design points are superimposed. The plot indicates a direct relationship between the A-Layer Height and Compression, with C-Orientation having a lesser impact. The contour lines exhibited a high degree of parallelism, suggesting a limited degree of interaction between the two elements within the investigated range.
The 3D surface plot illustrated in Figure 5(d) determines the correlation between the height of the A-Layer (measured in millimeters) and the orientation of the C-Layer (measured in degrees) on the compressive strength of the resin material (measured in megapascals). The plot shows a reaction surface created based on the experimental data. The surface was adorned with design points depicted as red dots for those situated above the anticipated surface and pink dots for those positioned below. The color gradient on the surface corresponded to different levels of compression, with deeper hues indicating higher values. The graph indicates a direct relationship between the A-Layer Height and Compression, as the surface inclines upward with a higher A-Layer Height. The influence of the C-Orientation on Compression seems to be less significant, as the surface shows a fairly even profile in this direction. The plot visually demonstrates the interactive impact of the A-Layer Height and C-Orientation on Compression.
The 3D surface map in Figure 6(a) depicts the correlation between the B-Curing Time and C-Orientation on Compression (measured in MPa) while keeping the layer height fixed at 30. The plot displays the response surface created using the experimental data. Design points are represented by red dots if their values are higher than the expected surface and by pink dots if their values are lower. The color gradient on the surface indicates different levels of compression ranging from approximately 7.5 to 10 MPa. The graph demonstrates a direct relationship between the B-Curing Time and Compression, as indicated by the rising slope of the surface in that direction. The influence of the C-Orientation on Compression appears to be less significant, as there is a rather uniform surface profile along this axis. The plot visually demonstrates the combined impact of B-Curing Time and C-Orientation on Compression at a given A-Layer Height.
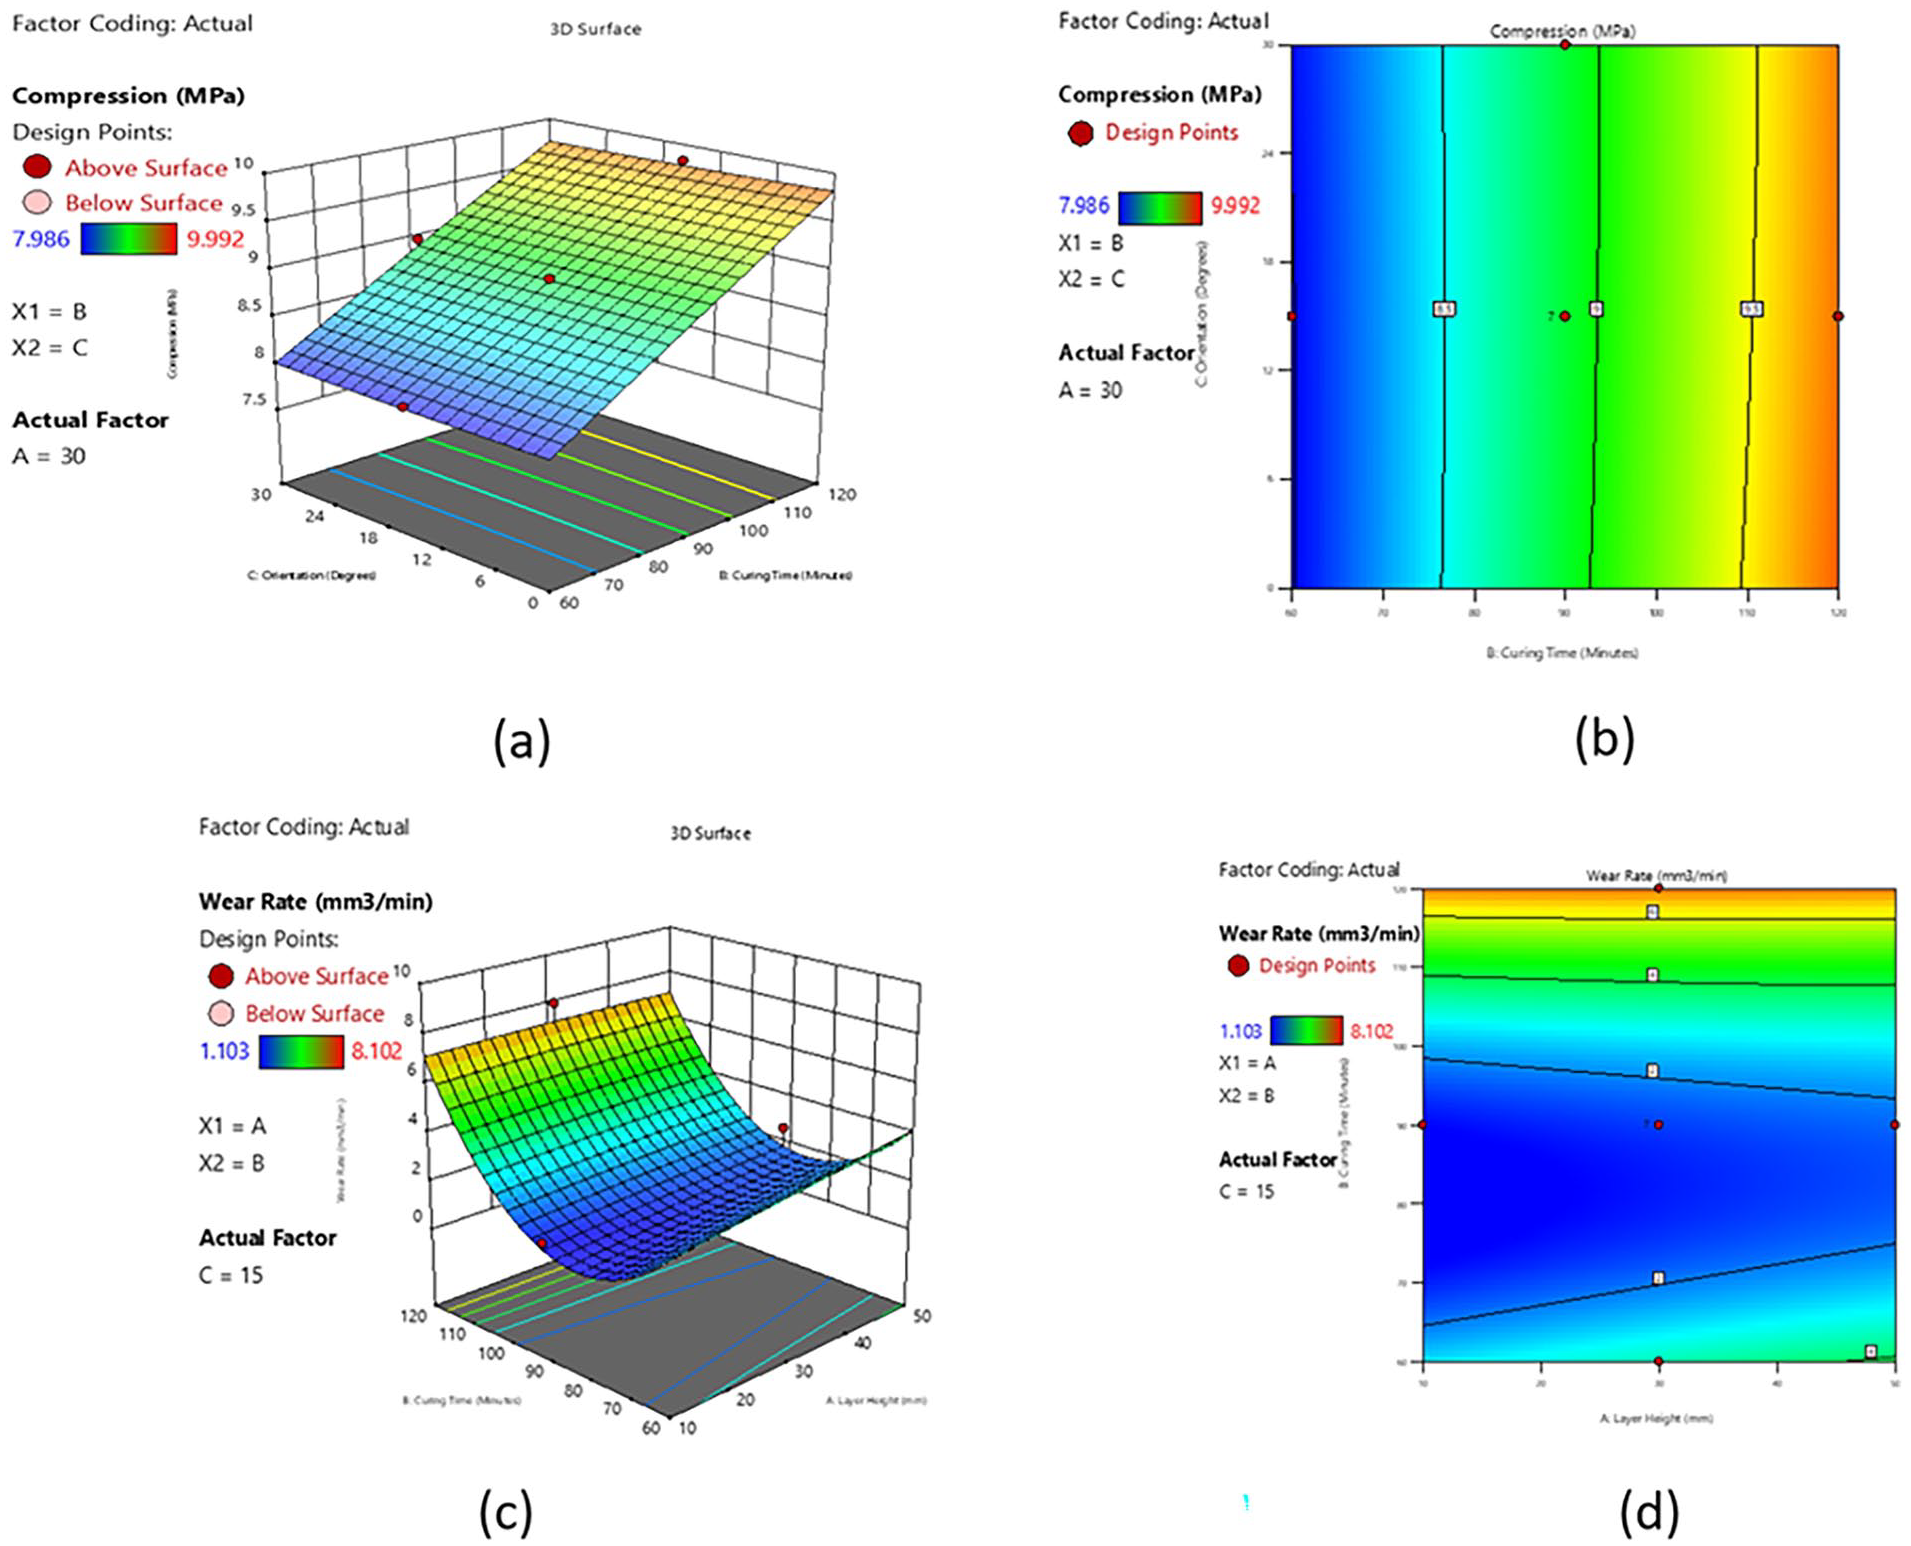
(a) 3D surface plot, (b) contour plot demonstrating the interaction effects of orientation and curing time on the compressive strength, (c) contour plot, and (d) 3D surface plot interaction effects of layer height and curing time on the wear rate.
The contour plot in Figure 6(b) demonstrates the influence of B-Curing Time (measured in minutes) and C-orientation (measured in degrees) on compression (measured in MPa), while keeping the A-Layer Height unchanged at 30 mm. The graphic uses a color gradient to depict different compression values, where deeper shades correspond to higher values. The experimental data are marked with overlaid design points, which distinguish between spots above and below the expected surface. The contour lines demonstrate a direct relationship between B-Curing Time and Compression, as indicated by the upward slope of the color gradient. The impact of the C-Orientation on Compression seems to be less significant, as the contour lines in that direction appear to be reasonably parallel. The plot indicates the possibility of enhancing the compression by extending the B-Curing Time within the investigated range.
Interaction effects of input parameters on wear rate
The 3D surface plot in Figure 6(c) demonstrates the combined impact of the A-Layer Height and B-Curing Time on Wear Rate (mm³/min). The surface, which is colored, indicates different values of Wear Rate and demonstrates a clear downward trend as both components grow. This suggests that the Wear Rate decreased as the A-Layer Height and B-Curing Time increased. The design points were overlaid and distinguished by color according to their position relative to the predicted surface. This allowed for a visual comparison between the experimental and predicted values. The plot indicates that there is a possible synergistic relationship between the A-Layer Height and B-Curing Time in decreasing the Wear Rate. This can be observed by the steeper downward slope of the surface when both the components are simultaneously increased.
The contour plot in Figure 6(d) demonstrates the combined impact of the A-Layer Height and B-Curing Time on Wear Rate. The wear rate decreases as the A-layer height and B-curing time increase. The contour lines exhibited a high degree of parallelism, suggesting a limited level of interaction between the components. The unequal distribution of design points can have a significant effect on the model accuracy in specific places in the design space.
The 3D surface plot in Figure 7(a) illustrates the combined influence of the A-Layer Height (mm) and C-orientation (degrees) on the Wear Rate (mm³/min) while keeping the B-Curing Time fixed at 90 min. The response surface is a graphical depiction that shows how the wear rate changes when the input factors, such as the A-Layer Height and C-Orientation, fluctuate. It is a three-dimensional plot that illustrates the relationship between these factors and the response.
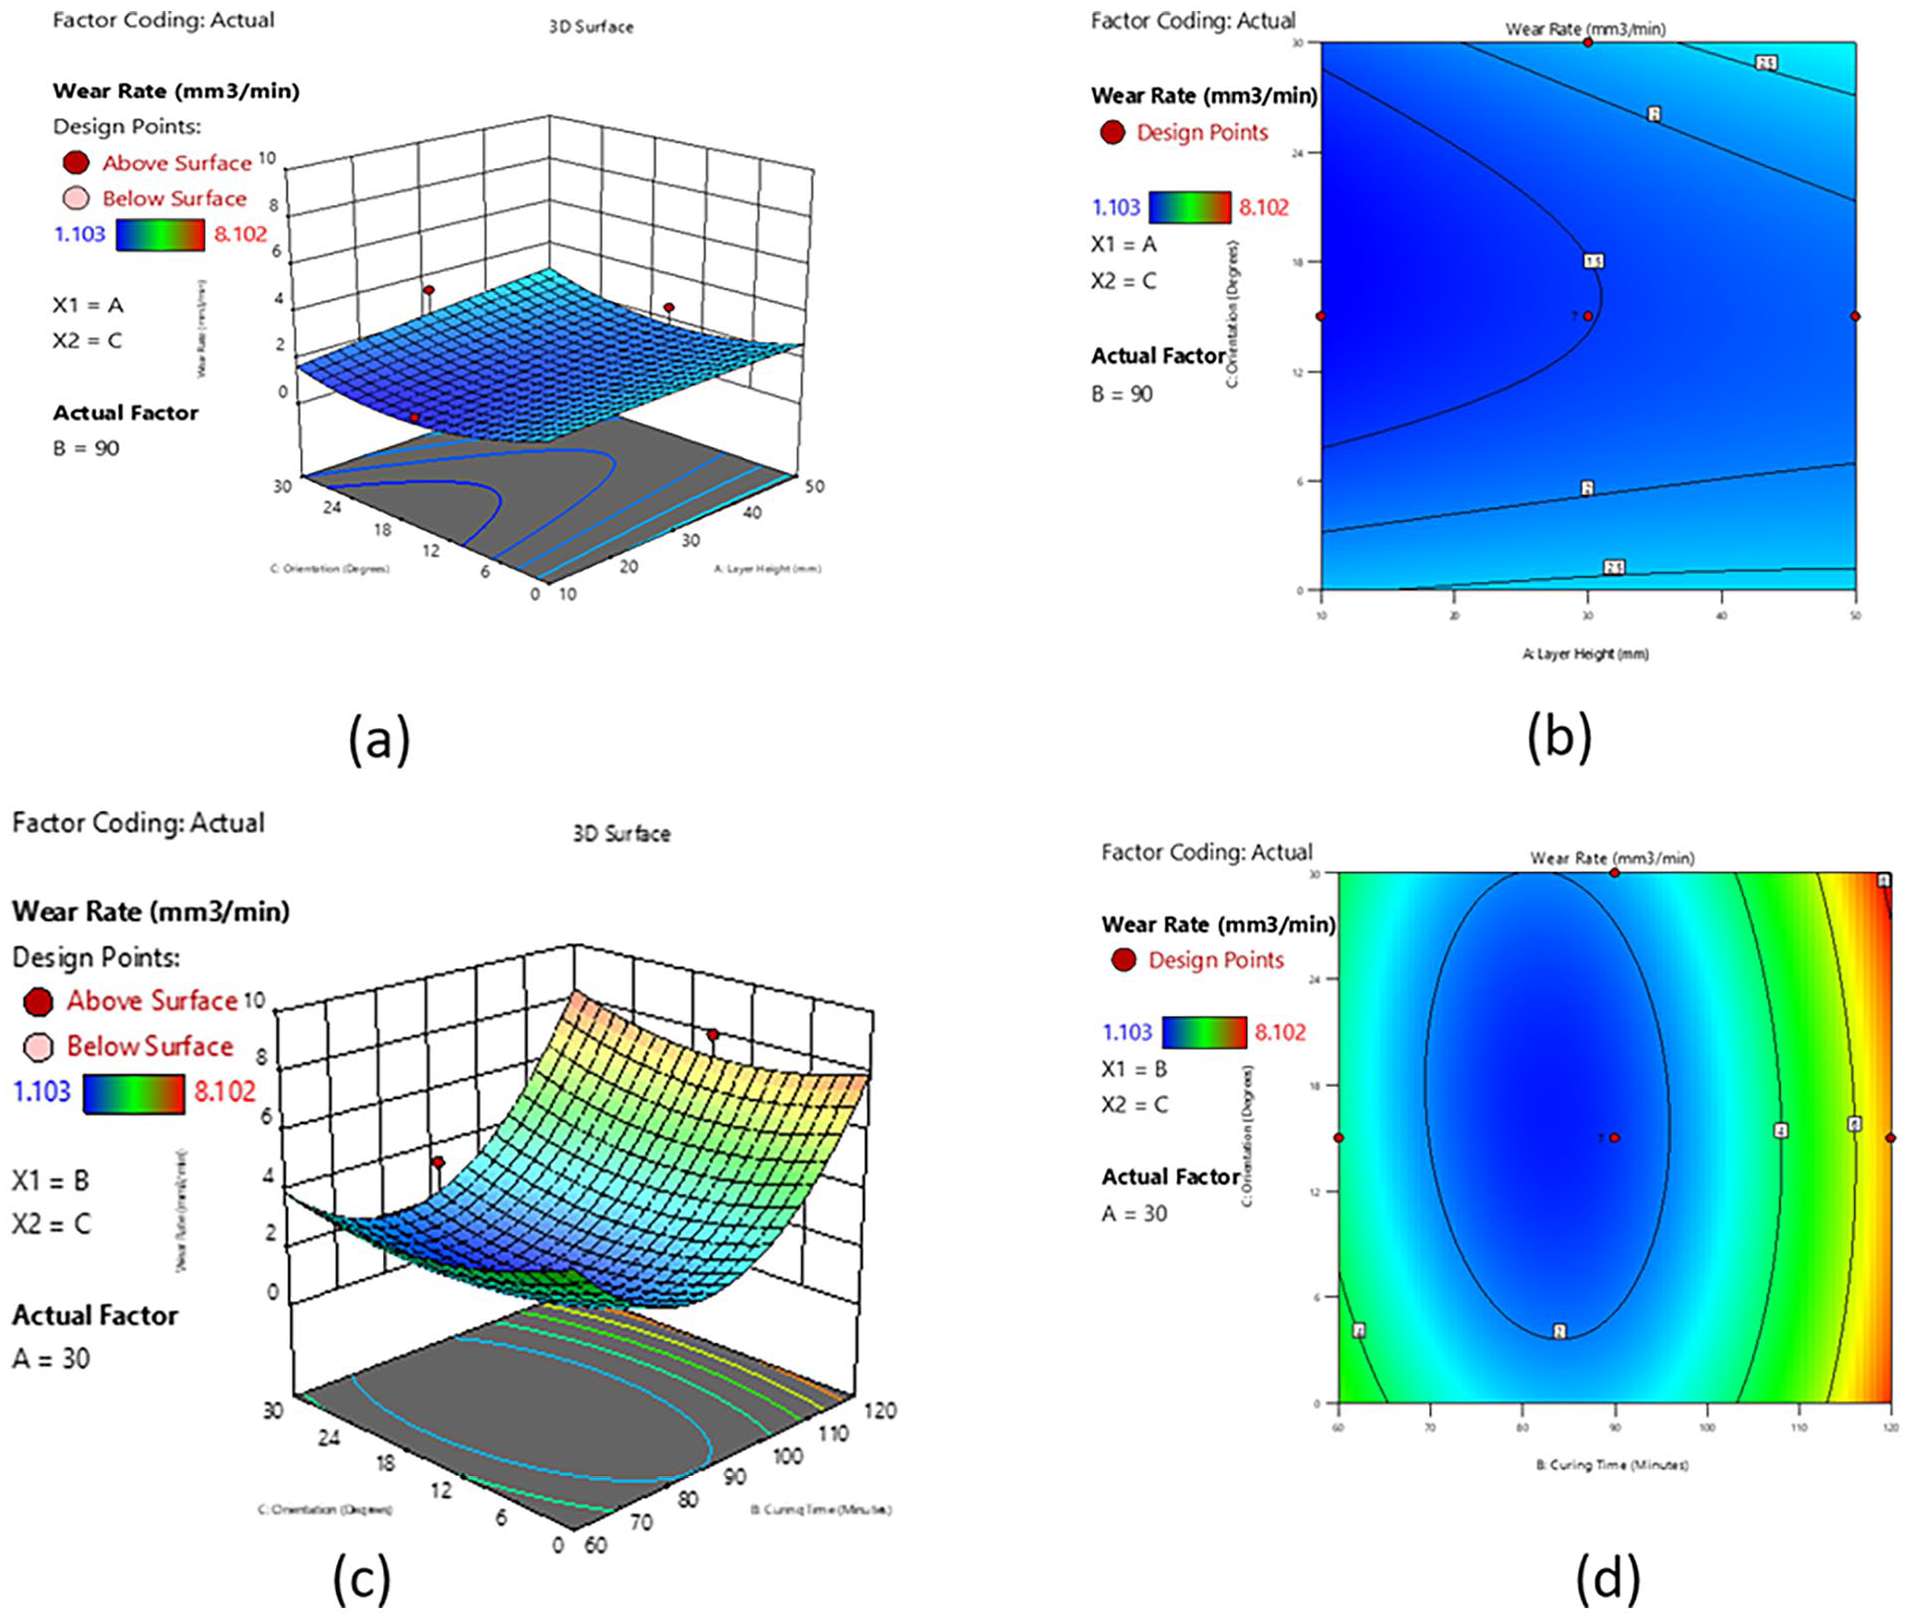
(a) Contour plot, (b) 3D surface plot interaction effects of layer height and orientation angle on the wear rate, (c) 3D surface plot, and (d) contour plot interaction effects of curing time and orientation angle on the wear rate.
The color gradient on the surface correlated with the Wear Rate values. Higher Wear Rate values are represented by darker hues, whereas lighter colors indicate lower rates. The shape of the surface clearly demonstrates an evident interaction between the A-Layer Height and C-Orientation. The wear rate exhibited a nonlinear relationship with the components.
Design Points: The crimson dots on the graph correspond to experimental data points situated above the projected surface, whereas the magenta dot represents a data point located below the projected surface. These points offer a visual juxtaposition of projected and observed values. According to the plot, it appears that decreasing both the A-Layer Height and C-Orientation values results in reduced Wear Rate values within the range that was studied. Nevertheless, a thorough examination utilizing contour plots or optimization approaches is vital for accurately determining the optimal area. Therefore, the 3D surface map offers an initial insight into the correlation between the A-Layer Height, C-orientation, and wear rate.
The contour plot in Figure 7(b) depicts the combined influence of the A-Layer Height (mm) and C-orientation (degrees) on the Wear Rate (mm³/min) while keeping the B-Curing Time constant at 90 min. The plot employs a color gradient to depict different Wear Rate values, where deeper shades correspond to higher rates. The experimental data points are indicated by red circles, which are overlaid on the design points. The contour lines indicate a consistent pattern of decreasing Wear Rate as the A-Layer Height increases. Nevertheless, the impact of C-Orientation on Wear Rate seems to be less significant. The shape of the contour lines indicates a possible interaction between the A-Layer Height and C-Orientation. The link between the Wear Rate and these components is not additive. The distribution of design points across the plot was reasonably uniform, ensuring sufficient coverage of the experimental space. 34 Hence, the contour plot offers an initial comprehension of the collective impact of A-Layer Height and C-orientation on the wear rate while keeping the B-Curing Time constant. Conducting more investigations, such as investigating different B-Curing Time levels and employing response surface methods, might be advantageous to obtain a more thorough comprehension of the process.
The 3D surface map in Figure 7(c) illustrates the combined influence of the B-Curing Time (measured in minutes) and C-orientation (measured in degrees) on the Wear Rate (measured in mm³/min) while keeping the A-Layer Height constant at 30 mm. The plot illustrates a response surface, which is a three-dimensional depiction showing how the wear rate response changes when the input factors, namely, B-Curing Time and C-Orientation, are altered. The variation in color on the surface correlates with the different values of the Wear Rate. Higher Wear Rate values are represented by darker colors, whereas lighter colors indicate lower rates, and the surface form clearly reveals an interaction between B-Curing Time and C-Orientation. The wear rate exhibited a nonlinear relationship with the components, and the Thompson dots on the graph correspond to empirical data points situated above the projected surface. These points offer a visual juxtaposition of the projected and factual values. The plots indicate that increasing both the B-Curing Time and C-Orientation results in decreased Wear Rate values within the studied range. The response shape of the surface indicates a possible synergistic impact between the B-Curing Time and C-Orientation in decreasing the Wear Rate. The existence of design points located above the projected surface suggests potential regions in which the model may underestimate the Wear Rate.
The contour plot in Figure 7(d) demonstrates the combined influence of B-Curing Time (measured in minutes) and C-orientation (measured in degrees) on the Wear Rate (measured in mm³/min) while keeping the A-Layer Height unchanged at 30 mm, and the contour lines indicate a consistent pattern of Wear Rate dropping as B-Curing Time increases. Nevertheless, the impact of C-Orientation on Wear Rate seems to be less significant. The configuration of the contour lines indicates a possible interaction between the B-Curing Time and C-Orientation. The link between the Wear Rate and these components is not additive. The distribution of design points across the plot was reasonably uniform, ensuring sufficient coverage of the experimental space.
The contour lines of the plot exhibit an almost circular form, suggesting a possible synergistic effect between the B-Curing Time and C-Orientation in decreasing the Wear Rate. The color gradient indicates a rather limited range of Wear Rate values within the experimental zone, and the contour plot offers an initial understanding of how the interaction between B-Curing Time and C-Orientation influences the Wear Rate while maintaining the A-Layer Height constant. Conducting more investigations, such as examining different A-Layer Height levels and employing response surface techniques, would be advantageous in order to obtain a more thorough knowledge of the process.
Interaction effects of input parameters on impact strength
The 3D surface map in Figure 8(a) illustrates the correlation between the Izod impact strength (J/m) and two printing variables, curing time (B) and layer height (A), while keeping factor C constant at a value of 15. The surface, which is color-coded according to the impact strength, has a prominent curvature, suggesting a significant correlation between the factors. The design points, classified as either above or below the surface, indicate regions with a greater or lesser impact resistance. The contour lines were projected onto the base plane to provide a more detailed outline of these locations. The plot indicates the best possible combination of curing time and layer height to provide the highest Izod impact strength within the range of parameters studied.

(a) Contour plot, (b) 3D surface plot interaction effects of layer height and orientation angle on the Izod impact strength, (c) 3D surface plot, and (d) contour plot interaction effects of layer height and orientation angle on the Izod impact strength.
The contour map shown in Figure 8(b) depicts the correlation between the Izod impact strength and two variables: A (Layer Height) and B (Curing Time). The color contours depict different levels of Izod impact strength, with warmer colors signifying a greater impact strength. The design points were superimposed, which indicated the testing conditions. The plot indicates that there is an ideal range for maximizing the Izod impact within the tested values of components A and B, possibly located around the intermediate values of both factors. 34
The 3D surface map in Figure 8(c) depicts the correlation between the Izod impact strength and two process factors, namely, layer height (A) and orientation (C), while maintaining the curing period (B) constant at 90 min. The plot demonstrated a conspicuous curvature, suggesting a robust correlation between the height of the layer and its orientation. The experimental design points were classified based on their location, either above or below the surface, indicating areas with greater or lesser impact strength. The contour lines were projected onto the base plane to provide a more detailed outline of these areas. The plot indicates the most effective combination of layer height and orientation within the parameter space explored to maximize the Izod impact strength.
The contour map in Figure 8(d) depicts the correlation between the Izod impact strength (J/m) and the two process parameters, layer height (A) and orientation (C), while maintaining the curing period (B) constant at 90 min. The plot demonstrates a clearly defined elliptical area where the Izod impact intensity is at its highest, indicating a significant correlation between the height of the layers and their direction. The experimental design points were superimposed, indicating the precise combinations of parameters that were tested. This plot helps to discover the best process settings for achieving the maximum Izod impact strength within the range of parameters being evaluated.
The 3D surface map in Figure 9(a) depicts the correlation between the Izod impact strength and two process factors, orientation (C) and curing time (B), while keeping the layer height (A) constant at 30. The curve demonstrates a prominent curvature, suggesting a significant correlation between orientation and cure time. Design points classified as either above or below the surface indicate areas with higher or lower impact strength. These zones are further defined by contour lines projected onto the base plane. Within the parameter space analyzed, the figure indicates that there is a suitable combination of orientation with curing time that can be used to maximize the Izod impact strength.

(a) Contour plot, (b) 3D surface plot interaction effects of orientation angle and curing time on impact strength, (c) contour plot, and (d) 3D surface plot interaction effects of layer height and curing time on surface roughness.
The contour plot in Figure 9(b) depicts the impact of the curing time (B) and orientation (C) on the Izod impact strength, while keeping the temperature unchanged at A = 30. Colors with higher temperature values indicate greater impact strength. The design points were superimposed for reference purposes. The map indicates that the best area for maximizing the Izod impact lies within a particular range of curing time and orientation, probably between 90 and 100 min of curing time and 60°–70° orientation.
Interaction effect of printing parameters on surface roughness
The 3D surface plot in Figure 9(c) depicts the relationship between the surface roughness (measured in microns) and both the layer height (A) and curing time (B), while keeping the temperature constant at 15°C (C = 15). The plot demonstrates a distinct correlation between the height of the layers and the duration of the curing process, resulting in a response surface resembling a saddle shape. Higher surface roughness ratings are represented by warmer colors. The design points were superimposed, differentiating between those located above and below the anticipated surface. The map suggests the existence of a prospective area with the least surface roughness within a specified range of layer heights and curing times.
The contour plot in Figure 9(d) illustrates the impact of the layer height (A) and curing time (B) on the surface roughness, while keeping the temperature constant at 15°C (C = 15). A higher surface roughness is indicated by warmer colors. The design points were superimposed for reference purposes. The plot indicates an intricate correlation between the variables and surface roughness, with a likely ideal area for reducing surface roughness, perhaps situated in the bottom left corner of the plot, distinguished by the lower layer height and curing time values.
The contour map in Figure 10(b) depicts the correlation between the surface roughness and two variables: A (Layer Height) and C (orientation), while keeping factor B constant at 90. The color contours depict different levels of surface roughness, with warmer colors signifying higher roughness. The design points were superimposed, which indicated the testing conditions. The plot indicates an intricate correlation between the height of the layers and the orientation, exhibiting several high and low points in the response to the surface roughness. The most favorable sites for reducing surface roughness seem to be found in regions with cooler hues, perhaps at particular combinations of intermediate layer heights and orientation values.

(a) 3D surface plot, (b) contour plot interaction effects of layer height and orientation angle on the surface roughness, (c) 3D surface plot, and (d) contour plot interaction effects of curing time and orientation angle on the surface roughness.
The 3D surface plot in Figure 10(a) illustrates the relationship between the surface roughness (measured in microns) and the layer height (A) and orientation (C) while keeping factor B fixed at a value of 90. The surface is color-coded to show the projected values of surface roughness, with warmer colors representing higher levels of roughness. The design points are superimposed and distinguished based on their spatial relationship with the projected surface, demonstrating an intricate correlation between the height of the layers and their orientation, resulting in a surface that resembles a saddle. This implies a possible correlation between these two parameters, which affects the roughness of the surface. The coexistence of design points, both above and below the surface, suggests that the model may not accurately represent the actual relationship in certain areas of the design space.
The 3D surface plot in Figure 10(c) illustrates the relationship between the surface roughness (measured in microns), cure time (B), and orientation (C) while keeping factor A constant at a value of 30. The surface is color-coded to show the projected values of surface roughness, with warmer colors representing higher levels of roughness. The design points were superimposed and distinguished by their location in relation to the anticipated surface. The plot demonstrates a significant correlation between the duration of curing and the curing direction, resulting in a surface that displays a curving pattern that slopes upward. These findings suggest that longer curing times or higher orientation levels lead to higher surface roughness. The coexistence of design points, both above and below the surface, indicates that the model may not accurately represent the actual relationship in certain areas of the design space.
The contour plot in Figure 10(d) depicts the correlation between the surface roughness and two variables: B (Curing Time) and C (orientation), while keeping factor A constant at 30. The color contours depict different degrees of surface roughness, with warmer colors denoting higher roughness. The design points were superimposed, most likely indicating the experimental conditions. The plot indicates an intricate correlation between the duration of curing and alignment, exhibiting several high and low points in the reaction of surface roughness. The most favorable locations for minimizing surface roughness seem to be situated in regions characterized by cooler colors. These regions may be found for particular combinations of curing times and orientation values falling within the range of 80–100 min and 60º–70º, respectively.
Interaction effects of input parameters on water sorption
The 3D surface plot in Figure 11(a) illustrates the relationship between the water sorption percentage and layer height (A) and curing time (B), while keeping the temperature constant (C = 15). This provides a visual representation of how these variables affect water sorption percentage. The color-coded surface shows the anticipated values of water sorption, with warmer colors representing elevated levels of sorption. The design points were superimposed and distinguished based on their spatial relationship to the projected surface. The plot demonstrates a noticeable curve on the response surface, indicating a substantial interaction between the layer height and curing time on the water sorption. The surface displays a saddle-shaped structure with a peak area, suggesting that certain combinations of layer height and curing time result in the highest water absorption. The coexistence of design points, both above and below the surface, indicates that the model may not accurately represent the actual relationship in certain areas of the design space.

(a) 3D surface plot, (b) contour plot interaction effects of layer height and curing time on the water sorption, (c) 3D surface plot, and (d) contour plot interaction effects of layer height and orientation angle on the water sorption.
The contour map in Figure 11(b) depicts the correlation between the water sorption percentage and two variables, A (Layer Height) and B (Curing Time), while keeping the temperature constant at 15°C. The color contours depict different levels of water sorption, with warmer colors suggesting greater sorption values. The design points were superimposed, which indicated the testing conditions. The plot indicates a significant correlation between the thickness of the layer and duration of the curing process in relation to water absorption. The region that is most effective in minimizing water sorption seems to be concentrated in the middle of the plot, where there are moderate values for both layer height and curing time.
The 3D surface plot in Figure 11(c) illustrates the relationship between the water sorption percentage and the layer height (A) and orientation (C) while maintaining the curing time constant (B = 90). The color-coded surface represents the projected values of water sorption, with warmer colors suggesting higher levels of sorption. The design points were superimposed and distinguished based on their spatial relationship to the projected surface. The plot demonstrates an intricate relationship between the height of layers and the orientation of the material, namely in terms of water absorption. The surface of the material displayed a shape resembling that of a saddle. This suggests that certain combinations of layer height and orientation result in either the highest or the lowest water absorption levels. The coexistence of design points, both above and below the surface, indicates that the model may not accurately represent the actual relationship in some areas of the design space.
The contour plot in Figure 11(d) depicts the correlation between the percentage of water sorption and two process parameters, namely, layer height (A) and orientation (C), while maintaining a constant factor B (presumed to be either time or temperature). The color-coded contours depict the amount of water sorption. Cooler colors indicate lesser sorption, while warmer colors indicate higher sorption. The design points were superimposed, indicating the experimental conditions. The graph demonstrates an intricate, nonlinear relationship between layer height and orientation, where water absorption shows both high and low points throughout the range of parameters. This visualization assists in determining the most effective process parameters for reducing the water absorption.
The 3D surface plot in Figure 12(a) depicts the combined influence of curing time and orientation angle on the percentage of water sorption at a fixed layer height of 30. The response surface has an intricate correlation, distinguished by a prominent curvature and saddle-like shape. Higher water sorption was indicated by warmer colors. The design points were superimposed, with the majority situated below the anticipated surface. This implies that the model can overestimate water absorption in some areas.

(a) 3D surface plot, (b) contour plot interaction effects of orientation angle and curing time on the water sorption, (c) 3D surface plot, and (d) contour plot interaction effects of layer height and curing time on the dimensional accuracy.
The contour map in Figure 12(b) depicts the correlation between the percentage of water sorption and two variables, B (Curing Time) and C (orientation), while keeping the layer height constant at A = 30. The color contours depict different levels of water sorption, with warmer colors indicating higher sorption values. The experimental conditions are represented by overlay design points. The plot demonstrates an intricate relationship between the duration of curing and the orientation direction in relation to water absorption. An ideal location for minimizing water sorption was observed within a specified range of curing time (approximately 90–100 min) and orientation (roughly 60º–70º). It is important to note that the contour lines in this area are closely spaced, indicating a possible susceptibility to minor alterations in these variables.
Interaction effect of printing parameters on dimensional accuracy
The 3D surface map in Figure 12(c) illustrates the relationship between dimensional accuracy and layer height (A) and curing time (B), while keeping the temperature constant at 15°C (C = 15). The surface was color-coded to show the expected values of dimensional accuracy, with warmer colors suggesting greater accuracy. The design points were superimposed and distinguished by their spatial relationship to the projected surface. The plot demonstrates an intricate relationship between the height of each layer and the time required for the material to harden, which directly affects the accuracy of the dimensions. The surface of the object has a shape resembling that of a saddle. This suggests that certain combinations of layer height and curing time result in either the highest or lowest values of dimensional accuracy. The coexistence of design points, both above and below the surface, indicates that the model may not accurately represent the actual relationship in certain areas of the design space.
The contour map in Figure 12(d) depicts the combined influence of the layer height (A) and curing time (B) on the dimensional accuracy while maintaining the constant factor C at a value of 15. The contour lines, which depict areas of consistent dimensional precision, demonstrate a nonlinear correlation between variables. The presence of a distinct curve in the contours indicates that the most precise dimensions were obtained using a particular combination of the layer height and curing time. The design points represented in the graph illustrate the combinations of various aspects that were either experimented with or deliberately chosen. The purposeful placement of the design points is aimed at effectively exploring the response surface. The color gradient superimposed on the contour plot offers supplementary visual data regarding the extent of dimensional correctness, where warmer colors indicate greater values. Therefore, the plot offers useful insights into the process parameters that affect dimensional accuracy and can help direct future optimization efforts.
The 3D surface plot in Figure 13(a) illustrates the relationship between the dimensional accuracy and layer height (A) and orientation (C) while maintaining the curing time fixed at 90 (B = 90). The surface was color-coded to show the expected values of dimensional accuracy, with warmer colors suggesting higher levels of precision. The design points were superimposed and distinguished based on their spatial relationship to the projected surface. The plot demonstrates an intricate relationship between the height of each layer and the orientation of the object, which directly affects the dimensional accuracy. The surface of an object displays a shape resembling that of a saddle. This suggests that certain combinations of layer height and orientation result in either the highest or the lowest values of dimensional accuracy. The coexistence of design points, both above and below the surface, indicates that the model may not accurately represent the actual relationship in certain areas of the design space.

(a) 3D surface plot, (b) contour plot interaction effects of orientation angle and layer height on the dimensional accuracy, (c) 3D surface plot, and (d) contour plot interaction effects of orientation angle and curing time on the dimensional accuracy.
The contour plot in Figure 13(b) depicts the interaction impact of the layer height (A) and orientation (C) on the dimensional accuracy, while keeping the factor B constant at 90. The plot illustrates a nonlinear correlation between the layer height and orientation, as represented by the curved contour lines. These contours depict the areas with the same dimensional precision. The color gradient enhances the diversity in response, with warmer colors suggesting a greater dimensional accuracy. The design points were strategically distributed throughout the plot, indicating a carefully orchestrated experimental design. The plot suggests that there is an ideal range of layer heights and orientations for achieving dimensional precision.
The 3D surface plot in Figure 13(c) illustrates the relationship between dimensional accuracy and curing time (B) and orientation (C), while keeping the layer height fixed at 30 (A = 30). The surface was color-coded to show the expected values of dimensional accuracy, with warmer colors suggesting greater accuracy. The design points were superimposed and distinguished by their spatial relationship to the projected surface. The plot demonstrates an intricate relationship between the amount of time required for the material to cure and the orientation of the object, which affects its dimensional correctness. The surface of the object exhibited a shape resembling a saddle. This suggests that certain combinations of curing times and orientations result in the highest values of dimensional accuracy.
The contour map in Figure 13(d) depicts the combined influence of the curing time (B) and orientation (C) on the dimensional accuracy while keeping the factor A constant at 30. The plot revealed an intricate correlation between the two variables, as evidenced by the nonlinear and apparently discontinuous contour lines. These lines are equally precise in terms of dimensional accuracy. The color gradient enhances the display of variation in responses, where warmer colors correspond to higher accuracy. The design points were evenly distributed throughout the plot, indicating a balanced experimental design. Nevertheless, the figure reveals places with sparse data, particularly in the lower-left corner, which could potentially compromise the accuracy of forecasts in those regions. In general, the plot offers an initial understanding of the process parameters that affect dimensional accuracy.
Process parameter optimization
Response Surface Methodology (RSM) was employed to optimize the printing parameters for resin-printed specimens fabricated using a digital light-processing 3D printer. Design expert software was used to create contour plots and response surfaces that illustrated how the responses changed based on the interaction of input factors. The parameters that correspond to the peak of the response surface have optimum values if the objective criterion is to maximize the response. The objective of this study was to optimize the compressive strength (CS), Izod impact strength (IS), and surface roughness (SR) while minimizing the surface roughness (SR), wear rate (WR), and water sorption of the printed parts. Single- and multi-objective optimizations were conducted to identify the optimal combination of input parameters to produce the desired response according to specific criteria. The purpose of single-objective optimization is to identify the combination of input parameters that result in a single response with the optimal value according to desire. Any response other than those evaluated in the solution technique can have any value for the combination of input parameters, regardless of their desirability. However, in multi-objective optimization, the primary aim is to obtain a combination of input parameters that result in optimal values for all answers according to their respective desirability. Occasionally, a scenario of compromise occurs when the reactions are opposed, with one increasing and the other decreasing.
Multi-objective optimization 35 for improved Table 4 displays the criteria for several parameters in multi-objective optimization for improved mechanical properties, and Table 5 demonstrates the desirability solutions for the proposed optimization approach. The results of the multi-objective optimization of mechanical properties through ramp function graphs are depicted in Figure 14(a). The optimum printing parameters for compressive strength include a layer height of 16.5  mm, curing time of 93.6 min and d orientation angle of 12.8 ° that yields a compressive strength of 9.05 MPa, wear rate of 159 mm3/min and impact strength 71.58 J/m. The ramp functions in Figure 14(a) are indicative of an optimization process that specifically targets the parametric optimization of printing parameters.
Criterion for multiobjective objective optimization of mechanical properties.

Desirability solutions obtained using RSM.


(a) Rampl plot , (b) desirability plot for multi-objective optimization of the mechanical properties of resin-printed specimens, (c) ramp plot and (d) desirability plot for multi-objective optimization of the physical properties of resin-printed specimens.
The desirability plot provides a clear visualization of the comparative effectiveness of different process and response variables within an optimization framework. The plot employs a desirability scale ranging from 0 to 1, where a value of 1 signifies the highest level of alignment with predetermined objectives. Figure 14(b) shows the desirability plot of the multi-objective optimization of the mechanical properties of resin printed specimens fabricated using a digital light processing resin 3D printer. It is worth mentioning that all process parameters (A: layer height, B: curing time, C: orientation) achieved a flawless desirability score of 1. This suggests that the selected levels for these parameters are perfectly aligned with their respective objectives, perhaps maximizing the process window or operable zone. There was a noticeable discrepancy between response variables. Although Izod impact and Wear Rate have high attractiveness values of 0.887515 and 0.929937, respectively, suggesting their close approach to desirable levels (perhaps maximizing their potential), Compression Strength has a somewhat lower score of 0.530914. This implies that the compression strength is not at an acceptable level, which may indicate a compromise with other variables or less than the ideal process parameters. The combined desirability score of 0.759541 represents a balance between the ideal levels of the process parameters and different performances of the response variables. Although the process parameters and certain response variables are highly desirable and have beneficial impacts, a lower compression strength value negatively affects the total score. Consequently, the desirability plot demonstrates the effective optimization of process parameters while also pinpointing compression strength as a crucial aspect that needs enhancement. Future optimization efforts should prioritize improving the compression strength while maintaining the currently optimized process parameters and other response factors (Figure 14(b)).
Multi-objective optimization of the physical properties of the resin-printed specimens (Table 6) determined the criteria for different printing parameters used for multi-objective optimization. The goal is to minimize the water sorption and surface roughness and maximize the dimensional accuracy within the prescribed range of printing parameters.
Criterion for multiobjective objective optimization of physical properties.

The ramp functions provided in the Figure 14(c) visually illustrate the correlation between process parameters and response variables in an optimization framework. The charts demonstrate the effect of changing one parameter while maintaining the others at their ideal values. The ramp functions represented in Figure 14(c) for factors A (layer height), B (curing time), and C (orientation) have profiles that are flat and save for a sudden and significant increase at the optimal value. This suggests a rather unresponsive reaction to variations in these factors within a specific range, followed by a rapid enhancement in the ideal configuration. This implies that achieving the intended outcomes requires the precise control of these factors at their respective ideal values. The ramp function for Dimensional Accuracy exhibited a slow ascent, eventually levelling off near the optimal value. This implies that, by making minor changes to the relevant process parameters, it is possible to enhance the precision of the dimensions. However, there may be a point where the benefits of further modification become less significant. The ramp functions for Surface Roughness and Water Sorption demonstrated a decline as the parameter values increased. These findings suggest that increasing parameter values typically results in decreased surface roughness and water sorption. Nevertheless, the pace of decline seems to differ, indicating possible nonlinear connections between these parameters and response variables.
A desirability of 0.887 was selected from 71 solutions. The desirability plot in Figure 14(d) provides a graphical representation of desirability levels linked to different response factors and their collective influence. Desirability is a quantitative measure, ranging from 0 to 1, that evaluates the degree to which a response conforms to predetermined objectives, with a score of 1 indicating complete alignment. Factors A (layer height), B (curing time), and C (orientation) had a desirability score of 1, indicating a high level of demand for these process parameters. This indicates that the selected levels for these parameters are ideally aligned with their respective objectives, most likely aiming to maximize the process window or operable region. The response variables, namely Dimensional Accuracy, Surface Roughness, and Water Sorption, exhibit different levels of desire. Surface Roughness and Water Sorption exhibit high desirability scores, approaching 1, indicating their strong alignment with desirable levels, presumably for the purpose of minimizing them. In contrast, Dimensional Accuracy had a lower score (0.698505). This indicates that the dimensional accuracy was not at an acceptable level, which may suggest a compromise with other response variables or inadequate process parameters. The overall desirability score of 0.887271 represents the total desired values of all the response factors in a balanced manner. The overall desirability is affected by the high desirability of the process parameters and some response variables but is reduced by the reduced dimensional accuracy. Ultimately, the desirability plot shows the effective fine-tuning of process parameters while also pointing out opportunities for further dimensional precision. Additional optimization endeavors could concentrate on improving the dimensional precision while maintaining the integrity of other crucial response factors.
Confirmatory test
Experiments were performed to validate or confirm the reliability of the output responses, that is, the compressive strength, wear rate, Izod impact strength, water sorption, dimensional accuracy, and surface roughness predicted by the constructed mathematical models. Specimens for each property were fabricated using a DLP resin 3D printer with a given set of parameters. The results of the corresponding confirmatory tests for the mechanical and physical properties are tabulated in Tables 7 and 8, respectively.
Set of printing parameters for the confirmatory test for mechanical properties.

Set of printing parameters for the confirmatory test for physical properties.

Conclusion
This study has proficiently examined how different printing parameters influence the effectiveness of resin-based occlusal splints, which aligns with the increasing interest in environmentally friendly dental solutions.
The curing time was found as a crucial factor, especially regarding its impact on wear rate, dimensional precision, and surface roughness, with an optimal range established for each response variable.
The orientation angle exhibited a diminished impact relative to layer height and curing time; however, its interaction with other parameters significantly influenced specific responses, including compressive strength and surface roughness.
Through the optimization of factors such as layer thickness, orientation angle, and curing time, the present research showed the capability of 3D printing to produce superior splints that fulfill the requirements of contemporary dentistry.
The novelty of this research lies in the importance of parameter optimization in attaining specific mechanical and physical attributes such as compressive strength, wear resistance, and dimensional precision, which is emphasized by our research findings.
This study aids in the advancement of sustainable dental care practices by diminishing the ecological repercussions linked to conventional manufacturing techniques and offering a more effective and customized approach to splint production.
Future investigations should delve into supplementary printing variables, examine alternative resin substances, and assess the enduring clinical efficacy of 3D-printed occlusal splints. By further developing this technology, one can make a valuable contribution to the dental healthcare system that is both environmentally friendly and easily accessible.
Footnotes
Acknowledgements
1. The authors are truly grateful for the support provided by the DCRUST, Murthal, and Sonepat.
2. All the authors are thankfull to the King Khalid University, Saudi Arabia for the financial Support.
Correction (May 2025):
the affiliation of author “Ashish Kaushik” was incorrect and has been corrected in this version.
Author contributions
Conceptualization: R.K.G; Methodology: A.K and R.K.G; Software: R.K.G; Validation: A.H., F.B. and R.S.S; Formal analysis: A.K, R.K.G, A.H, F.B. and R.S.S; Investigation: A.K and R.K.G; Resources: R.K.G; Data Curation: A.K; Writing – Original Draft: A.K, A.H, and R.S.S; Writing – Review & Editing: A.K, A.H, R.S.S, and F.B.; Visualization: R.K.G; Supervision: A.H and R.K.G; Project administration: R.K.G. Funding Acquisition :R.S.S. All authors have read and approved the published version of the manuscript.
Funding
The author(s) disclosed receipt of the following financial support for the research, authorship, and/or publication of this article: The authors extend their appreciation to the Deanship of Research and Graduate Studies at King Khalid University for funding this work through Large Research Project under grant number RGP2/545/46.
Declaration of Conflicting interests
The author(s) declared no potential conflicts of interest with respect to the research, authorship, and/or publication of this article.
Data availability Statement
The data presented in this study will be made available upon request from the corresponding author.