
Abstract
Craniofacial bone defects result from various disorders such as trauma, congenital malformations and infections. Cleft lip and palate are the most prevalent congenital craniofacial birth defect in humans. Growth factors (GFs) are soluble proteins secreted by cells that regulate various cellular processes and tissue regeneration. At present, developing three-dimensional scaffolds for delivering GFs to the site of injury has become an important aspect in craniofacial bone regeneration. This study aims to develop a novel 3D bone substitute using lyophilized-platelet-rich fibrin (LyPRF) biocomposite scaffolds for potential application for CLP repair. Collagen (C), bioglass (BG), and LyPRF were used to fabricate a biocomposite (C-BG-LyPRF) scaffold. The physical, chemical, and biocompatibility properties of the scaffold were evaluated. The C-BG-LyPRF scaffold demonstrated a mean pore diameter of 146 µm within a porosity of 87.26%. The FTIR spectra verified the presence of am-ide I, II, and III functional groups. The inorganic phase of the C-BG-LyPRF scaffold was composed of sodium, calcium, silicon, and phosphorus, as determined by EDX analysis. Furthermore, C-BG-LyPRF scaffold was biocompatible with MC3T3-E1 cells in both the Live/Dead and prolif-eration assays. Data demonstrate the developed C-BG-LyPRF scaffold exhibits biomimetic and biocompatibility properties, establishing it as a promising biomaterial for craniofacial regeneration.
Introduction
Craniofacial bone deformities can be caused due to trauma, bone recessions, or congenital disorders. Cleft lip and palate (CLP) are the most prevalent congenital craniofacial birth defect affecting 1 in 700 live births. 1 The gold standard surgical intervention involves the use of autologous grafts. In addition, various allografts and xenogenic graft materials have been investigated for use in craniofacial regeneration.2,3 The newest generation of tissue engineering (TE) scaffolds aim to enhance tissue regeneration by delivering bioactive molecules essential to bone formation at the site of injury/defect. 4 Growth factors (GF) play an important role in tissue regeneration, prompting the development of a new GF-based strategy for improving bone healing. Various natural and synthetic derived GFs can be incorporated into three-dimensional (3D) scaffolds to improve bone regeneration. Platelet-rich fibrin (PRF) has gained popularity for therapeutic use due to the absence of an anticoagulant and as it contains an abundance of autologous GFs, including platelet-derived growth factors (PDGF; plays a significant role in blood vessel formation), transforming growth factor-β1 (TGF-β1; controlling cell growth, cell proliferation, cell differentiation, and apoptosis) and vascular epithelial growth factor (VEGF; promotes angiogenesis), that are essential for bone regeneration and tissue repair. 5 However, its widespread clinical application is limited by its low modulus of elasticity, limited storage capacity, and restrictions in use for emergency therapy.6,7 Current studies have shown that lyophilised platelet-rich fibrin (LyPRF) displays significant utility as a promising biomaterial for craniofacial regeneration due to its rich GF reservoir, and its persistent release of (platelet-derived growth factor-AB) PDGF-AB.8–10
Collagen (C) is the most predominant protein in mammals and is the principal protein component of connective tissues such as skin, ligaments, tendons and cartilage. Due to its high biocompatibility, biodegradability, mechanical properties, and cell activities, collagen is an ideal biomaterial for therapeutic applications such as tissue engineering, wound healing, and skin supplementation. 11 Collagen type I, obtained from bovine tendons, is often employed due to its biocompatibility as well as mechanical characteristics, pore structure, permeability, hydrophilicity, and in vivo stability. 12 Consequently, it is often regarded as the gold standard bone regenerative biomaterial13,14 and as a carrier of GFs for the treatment of craniofacial deformities.15,16 Bioactive glass (BG) is also well known for its superior bone regenerative properties. When BG is implanted into host tissues, a sequence of chemical processes occurs at the material-bone interface, resulting in strong mechanical bonding between the material and the host tissue.17–19
Collagen and BG combinations are well characterised for promoting osteoblast adhesion, proliferation, differentiation and mineralisation, making them potential candidates for application in regenerative medicine.20–22 Nevertheless, the addition of LyPRF into these mixtures has yet to be explored. Platelet-rich fibrin (PRF) provides a rich reservoir of autologous growth factors (GFs) that are essential for bone regeneration, including platelet-derived growth factors (PDGF), transforming growth factor beta (TGFβ), and vascular endothelial growth factors (VEGFs), with prolonged release of these GFs to surgical areas. However, its low elastic modulus, short clinical half-life and limited storage capabilities have constrained its more widespread clinical use. The lyophilisation of PRF has been investigated to preserve the GFs and their microarchitecture and produce an off-the-shelf product with improved stability ready for future therapeutic application. Our previous study investigated the physical and biological properties of Ly-PRF. The present study now aims to evaluate the physicochemical and biological properties of a composite LyPRF containing collagen and BG (C-BG-LyPRF) as a novel three-dimensional (3D) scaffold for cleft lip and palate repair. For comparative purposes, additional scaffolds containing collagen, hydroxyapatite and LyPRF (C-HA-LyPRF) and collagen and BG alone (C-BG) were synthesised and compared with C-BG-LyPRF. It is hypothesised that incorporating of LyPRF granules in the C-BG scaffold will improve its physicochemical and biological properties for craniofacial regeneration.
Materials and methods
LyPRF fabrication
Ethical approval was obtained from the University of Otago Human Ethics Committee (Health) (approval number H19/057) prior to venous blood collection and centrifuged at 400 g for 10 min using an Eppendorf Centrifuge 5810 R. 23 To prepare LyPRF, an intact fresh PRF was frozen and stored at −80°C for 30 min before being freeze-dried (FreeZone® Triad Freeze Dry System Models 740000 Series, Labconco, MI, USA) overnight at −51°C to produce Ly-PRF. Samples were ground into granules using a mortar and pestle before storage at 4°C.7,24 The level of PDGF within the LyPRF upon preparation range from 71.09 ± 41.24 pg/mL at day 1 to 0.17 ± 0.32 pg/mL at day 28, as reported in our previous analyses. 24
Bioactive glass preparation
Sol-gel derived BG were synthesised as previously reported 25 where the glass fabrication involves mixing of vital compounds including deionised water, 2N nitric acid, Tetraethyl orthosilicate (TEOS), Triethyl phosphate (TEP), sodium nitrate and calcium nitrate tetrahydrate. The mixture was stirred overnight to achieve a gel state. The semi-gelation mixture was then further gelled at 35°C in an oven for 3 days before the sealed container containing the gel mixture was aged at 60°C for 2 days. The mixture was then subjected to 110°C for 2 days to ensure it was fully dehydrated before the samples were sintered at 700°C for 1 h. The sol gel BG powder was then ground and sieved using 50 micron sieve to achieve a powder with particle size less than 50 μm.
Collagen preparation
Collagen suspensions from a bovine Achilles tendon (Sigma-Aldrich, C9879) were prepared following the previous protocol. 26 Briefly, 1.6% (w/v) collagen type I bovine Achilles tendon were dissolved in 0.5 M acetic acid. The solutions were sonicated for 15 min or until no visible large particles of collagen were observed in the solution.
Fabrication of C-BG-LyPRF, C-BG and C-HA-LyPRF scaffold
For the fabrication of the C-BG-LyPRF scaffold, approximately 0.2% (w/v) of BG were added to the collagen solution under continuous stirring and sonicated for 10 min to achieve a homogenous solution. The pH was adjusted to between 7 and 7.2 by adding 1 M Sodium hydroxide (NaOH) (Biolab (AUS) LTD). Approximately 2 mL of this collagen-BG mixture solution was transferred into wells of a 24-well polystyrene plate, and subsequently, 5 mg of LyPRF granules were added to the mixture. The plates were frozen for 24 h at −80°C and subsequently freeze-dried for 24 h at −20°C. The weight, diameter and thickness of each scaffold were determined. In addition, for the fabrication of C-BG and C-HA-LyPRF scaffolds, a similar protocol was used, however without the inclusion of LyPRF (for C-BG scaffold), whilst the C-HA-LyPRF group was generated using synthetic hydroxyapatite (HA) Acros Organic, Germany (A0296043) in replacement of the bioactive glass. HA is a commonly used biomaterial for bone tissue regeneration, and acts as a biocompatible scaffold promoting cell adhesion, proliferation, and differentiation.27–29 Therefore, the C-BG group was used as a control group to investigate the effect of LyPRF with or without LyPRF. The C-HA-LyPRF group was used as the control group to compare the effect with or without bioglass.
Characterisation of the scaffolds using field emission scanning electron microscopy (FESEM) and micro-computed tomography (Micro-CT)
The surface morphology and pore size microarchitecture of all scaffolds were determined by FESEM. The cross-sections of the scaffolds were sputter coated with gold-palladium in an Emitech K575X Sputter Coater (EM Technologies Ltd, Kent, England). Samples were viewed in a JEOL JSM-6700F FESEM (JEOL Ltd, Tokyo, Japan) at an accelerating voltage of 5 kV. Image analysis software was used to assess the pore size (ImageJ, NIH, Bethesda, MD, USA). A minimum of 30 pores of three representative scaffolds taken at 100 times (100×) magnification were identified to calculate the average pore size (n = 90). 30 Energy Dispersive X-ray (EDX) analysis was conducted to determine the elemental analysis of the scaffolds in four randomly selected areas using an OXFORD JEOL 2300 (Tokyo, Japan) scanning electron microscope equipped with an energy dispersive X-ray analyser (EDX; Oxford, UK) operating at 15 kV and 15 mA. Carbon coated samples were analysed at a voltage of 10 kV. 29 Micro-CT analysis was conducted to quantify the 3D microstructure and to evaluate the porosity of all scaffolds. Scaffolds were scanned using a SkyScan 1172 high-resolution μCT scanner (Bruker, Kontuch, Belgium) at a voltage of 30 kV and a current of 175 μA. Approximately 1000 2D images of the scaffold’s transverse section were captured over the course of the 30 min of scanning. The 2D images were assembled and analysed using the SkyScan software in accordance with the protocol “Advanced porosity analysis” (Bruker CT, Bruker). The µCT-analyser software was utilised to characterise the 3D porosity of the scaffolds. 29
Chemical and physical analysis of the scaffolds using Fourier transform infrared spectroscopy (FTIR) and the swelling test
FTIR spectroscopy was used as a primary technique for determining the functional groups of all scaffolds using a Fourier Transform Infrared Spectrophotometer (ALPHA FT-IR pectrometer, Bruker Optik GmbH, Ettlingen, Germany). Samples were subjected to infrared spectra measured in the range of 400–4000 cm−1 with an average of 23 scans. Prior to each set of experiments, a background scan was performed to eliminate noise and the crystal area was debrided. The powdered samples were placed onto the designated crystal area. The sample volume was adjusted to provide sufficient material to fill the crystal region. 31
The swelling test was performed by immersing the scaffolds (n = 3) in sterile phosphate buffered saline (PBS), pH = 7.4 at 37°C for 24 h. At specific intervals (10, 20, 30, 40, 50, 60 min, 3, 6, 24 h), the swollen scaffolds were dried with filter paper and weighed (Shimadzu AUW220D, accurate to 0.0001 g). Three measurements were recorded, and an average was used for each weight determination. Triplicate measurements were obtained to ensure reproducibility of the method and reduce the likelihood of error. After the measurements were obtained, the scaffold was re-immersed in PBS. Prior to immersion in PBS, the weight of each scaffold was determined which is also known as the dry weight of the scaffold. 30 The swelling ratio was calculated using the formula:

M: the weight of the swollen scaffold after drying with tissue paper, and
Mi: the initial dry weight of the scaffold
Estimates of PDGF-AB growth factor release from the scaffolds
The kinetic release pattern of the PDGF-AB growth factors from all scaffolds (n = 3, per scaffold) was conducted over 28 days. This study quantified PDGF-AB from all scaffolds using a previous described protocol. 9 Briefly, all of the scaffolds were incubated in 4 mL of Dulbecco’s Modified Eagle’s Medium (DMEM) in a cell culture flask at 37°C and 5% CO2 for 28 days. Conditioned media (4 mL) was obtained at days 1, 4, 7, 14, 21, and 28 and replaced with an equal volume of DMEM. Samples were stored at −80°C before ELISA (Quantikine ELISA (Human PDGF-AB), R&D SYSTEMS®, USA). Reagents, working standards, sample preparation, and growth factor quantification followed manufacturer’s recommendations.
Cell culture
Cell culture procedures were performed in a class II biohazard laminar flow hood (BTR Environmental, Leicestershire, UK). The cells were cultured in a humidified incubator at 37°C with 5% CO2 in a 25 cm2 vented cell culture flask (T25, 353108, Becton Dickinson). Every 3 days, the growth medium was refreshed. MC3T3-E1 subclone 4 (MC3T3-E1) (ATCC® CRL-2593™) cells are preosteoblast cells derived from the mouse calvaria bone. They were obtained from the American Type Culture Collection (ATCC; Virginia, USA) for this study. This cell line was chosen because it has been extensively used to evaluate and simulate in vitro craniofacial bone regeneration. 32 MC3T3-E1 cells were used to assess the in vitro cytocompatibility of the C-BG-LyPRF scaffold, where complete growth medium (without scaffold extract), C-BG, and C-HA-LyPRF scaffolds acted as the controls in this study employed to facilitate cell identification and viability comparison.
Cell viability/cytotoxicity assay
The cytocompatibility of the C-BG, C-BG-LyPRF and C-HA-LyPRF scaffolds (n = 3) were determined using the LIVE/DEAD® cytotoxicity kit for mammalian cells assay (Molecular probes, Life Technologies, CA, USA) according to the manufacturer’s instructions using an indirect elution technique. Prior to the test, C-BG, C-BG-LyPRF and C-HA-LyPRF scaffold extracts were prepared. Briefly, the C-BG-LyPRF scaffold-containing growth medium was placed on an orbital shaker for 4 h to dissolve all the components within the scaffold to produce a scaffold extract medium. 33 MC3T3-E1 cells were seeded at a density of 6000 cells per cm2 inside a 48-well plate and the cells were treated with the 10 mg/mL scaffold extract media. For quantitative analysis, cell counts were performed on three random microscopic fields per scaffold. The cell viability for each image was calculated according to the following formula 29

Cell proliferation assay
The proliferation of MC3T3-E1 cells in the scaffold extract media of C-BG, C-BG-LyPRF, and C-HA-LyPRF (n = 3) was measured using the MTS [3-(4,5-dimethylthiazol-2-yl)-5-(3-carboxymethoxyphenyl)-2-(4-sulphonyl)-2H-tetrazolium] assay (CellTiter 96® Aqueous One Solution, Promega, Madison). As per the cell viability assay, 6000 MC3T3-E1 cells were seeded in wells of a 48-well plate and the cells were treated with the scaffold extract media.34,35 The MTS cell proliferation assay is a calorimetric technique that alters the colour of tetrazolium dye when it reacts with cells, and it is converted to formazan by cellular enzymes. The intensity of the colour change is proportional to the number of viable cells. For each trial, a standard curve (40,000–3750 cells) was produced for the MC3T3-E1 cells. The medium was withdrawn at 24, 48, and 72 h to determine cell proliferation. Each well obtained a mixture of 40 μL MTS and 160 μL growth media, and the samples were incubated for an additional 2 h to allow the proliferating cells to metabolise the MTS agent. Following that, 100 μL of the supernatant was transferred to a 96-well plate and the absorbance (the formazan dye produced by proliferating cells) was quantified at 490 nm using a spectrophotometer (Synergy 2 Multi-Mode Microplate Reader, Biotek®). All experiments were conducted three times in triplicate (n = 9). 29
Statistical analysis
Statistical analyses were conducted using PRISM software (GraphPad Prism 6, CA, USA), and results presented as mean and standard deviations. ANOVA (one-way and two-way) with Tukey’s post hoc correction for multiple comparisons were performed with a probability of type I error (a) = 0.05.
Results
Physicochemical characteristics and morphological features of all scaffolds
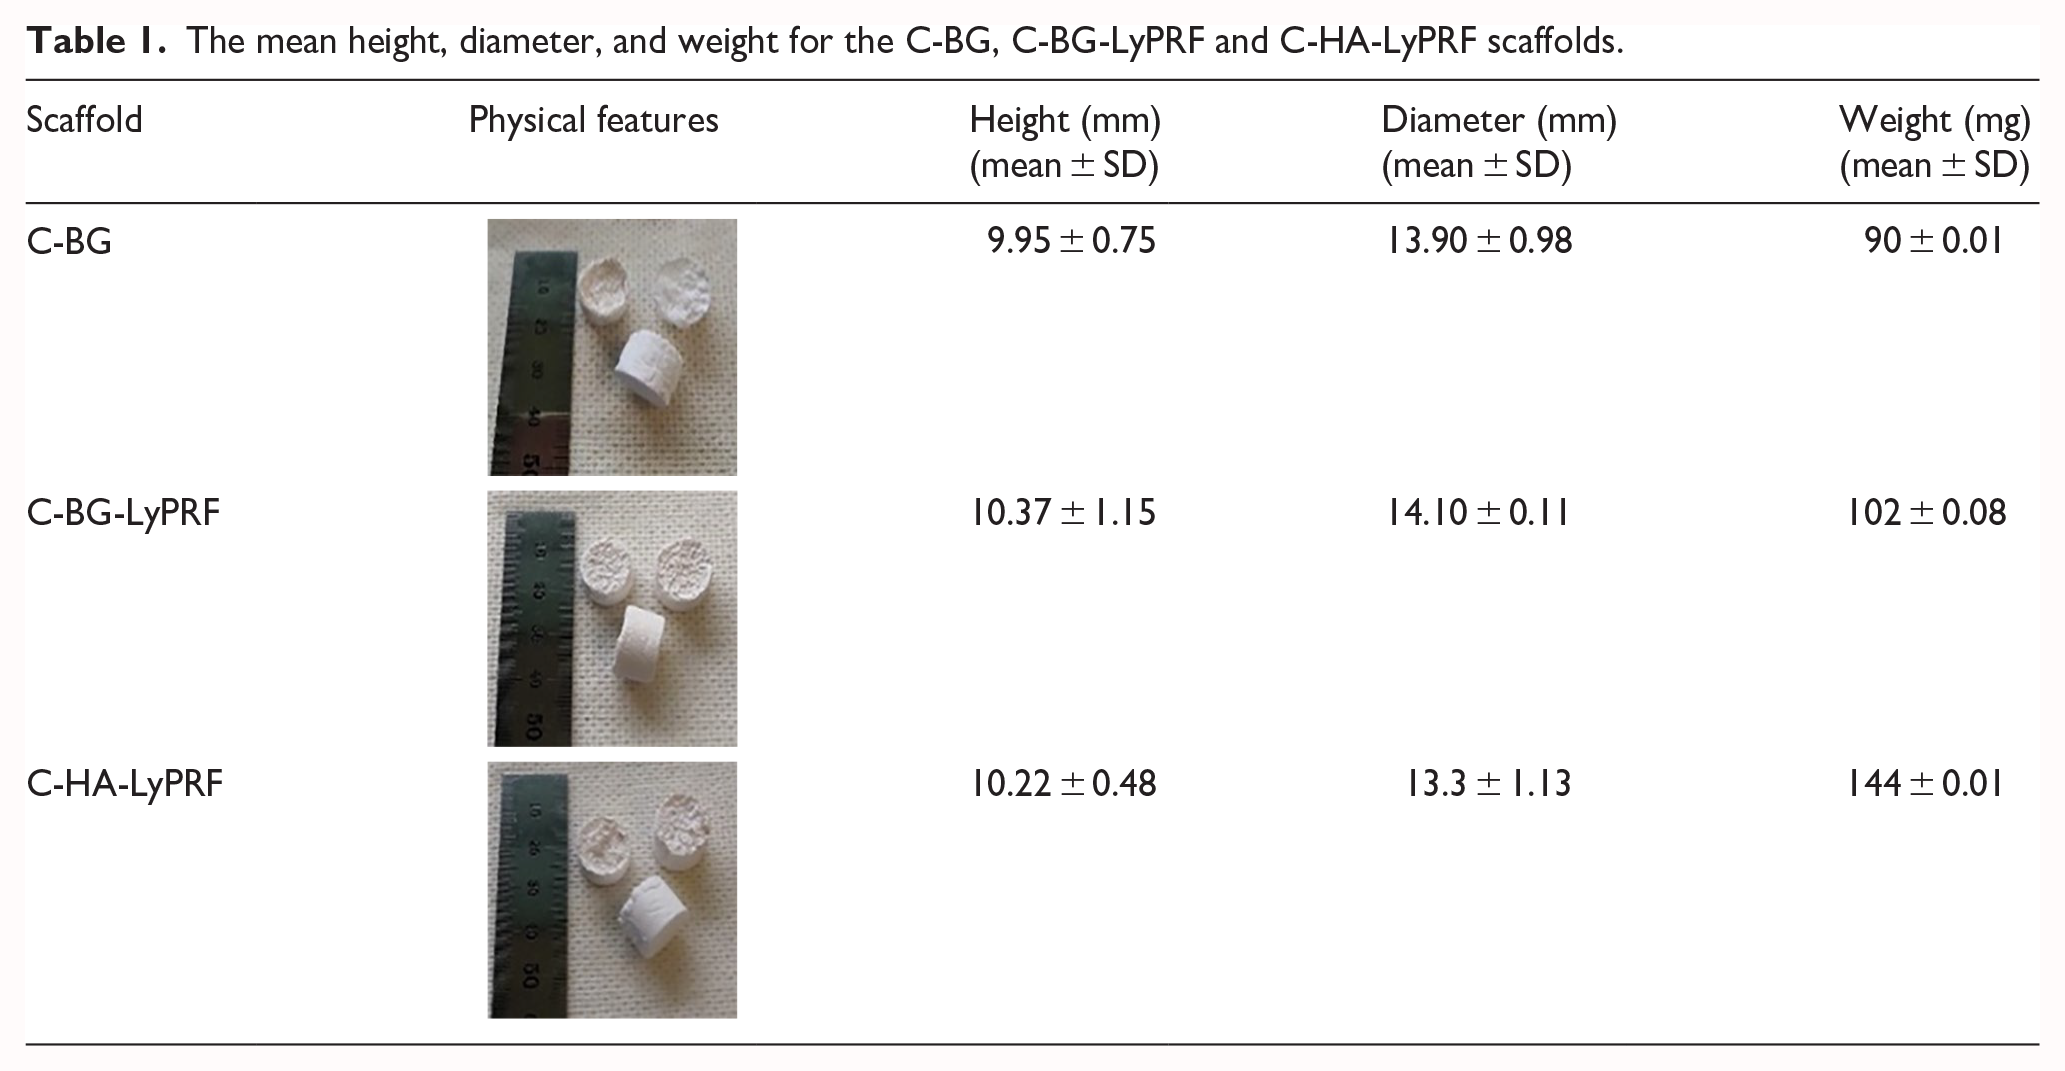
The C-BG-LyPRF exhibited a spongy appearance after the freeze-drying process, and the physical properties of all C-BG-LyPRF scaffolds, such as height, diameter, and weight are shown in Table 1.
The mean height, diameter, and weight for the C-BG, C-BG-LyPRF and C-HA-LyPRF scaffolds.
SEM images of the C-BG, C-BG-LyPRF and C-HA-LyPRF scaffolds demonstrated their irregular surface morphology (Figure 1). There was no apparent evidence of cellular or fibrin networks as being present on the C-BG and C-HA-LyPRF scaffold surfaces. In contrast, on the C-BG-LyPRF scaffold surface, the presence of cell attachments morphologically identified as leukocytes, platelets, and fibrin networks were apparent (Figure 2). The fibrin strands derived from LyPRF exhibited a condensed, interconnected, and densely packed framework, with red blood cells and platelets entangled inside the fibrin network on the scaffold of C-BG-LyPRF.
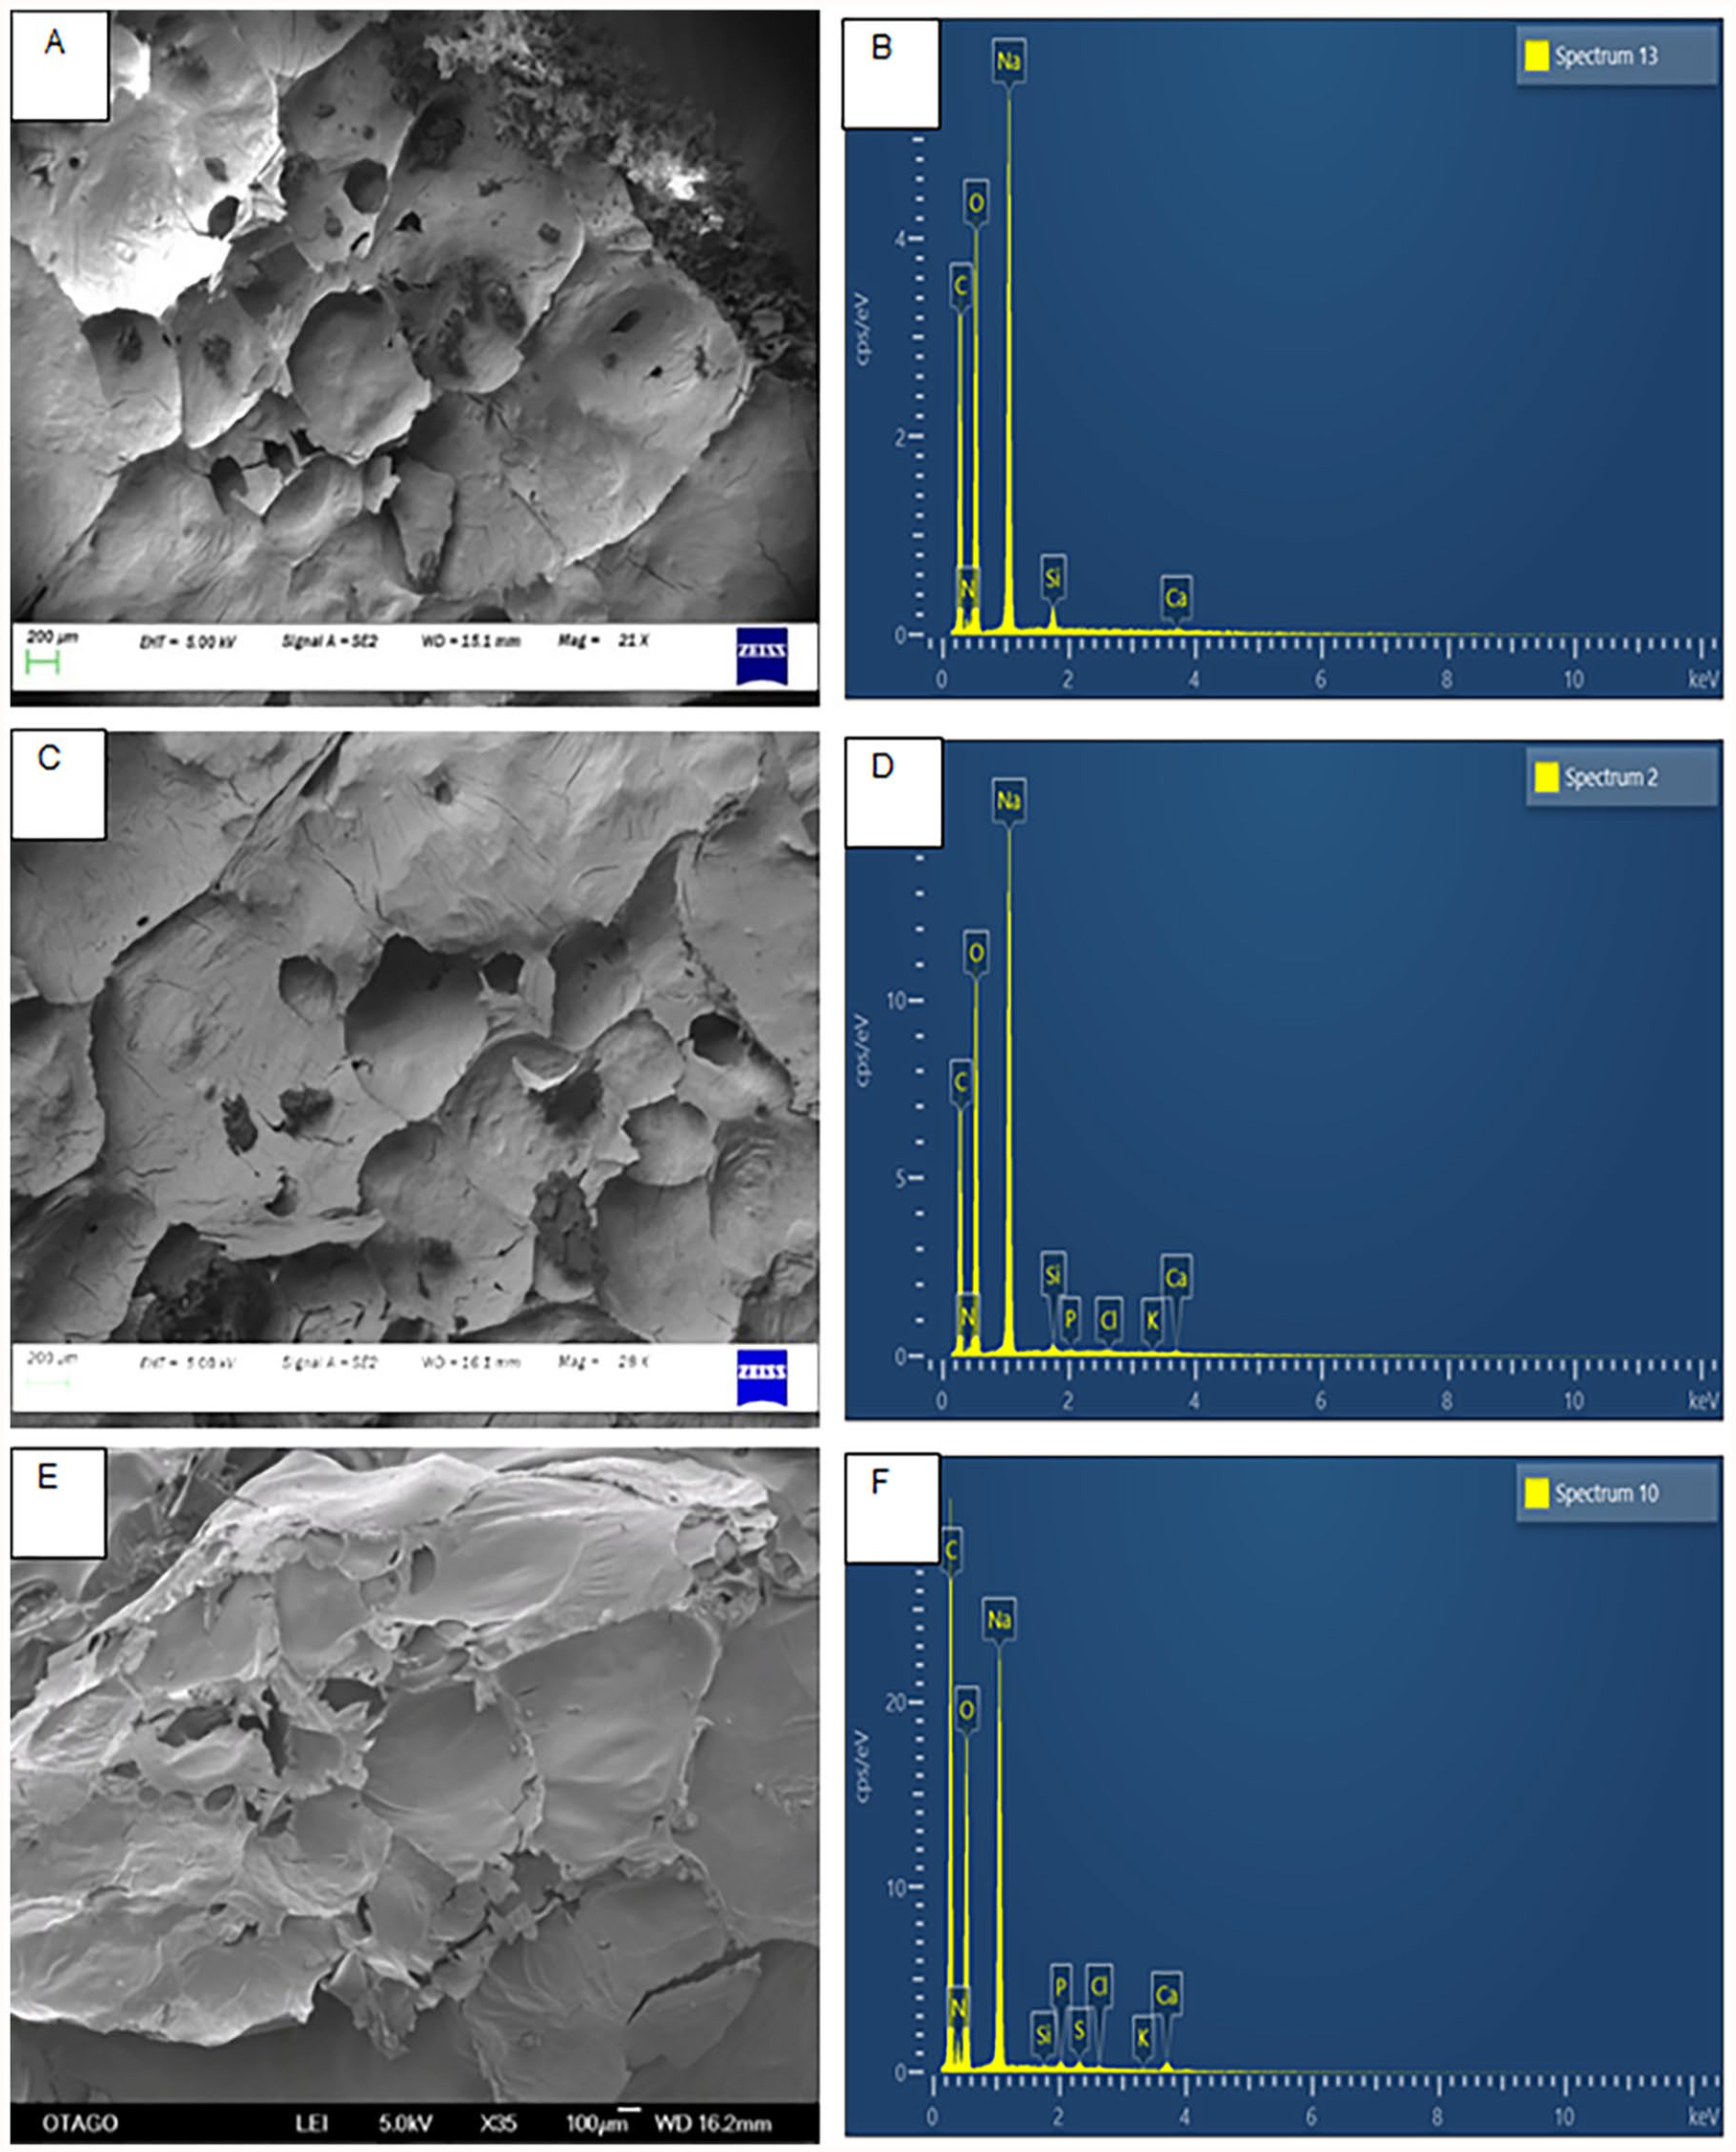
SEM scaffold surface of C-BG-LyPRF and EDX spectra. (a and b) C-BG (c and d) C-BG-LyPRF, and (e and f) C-HA-LyPRF.
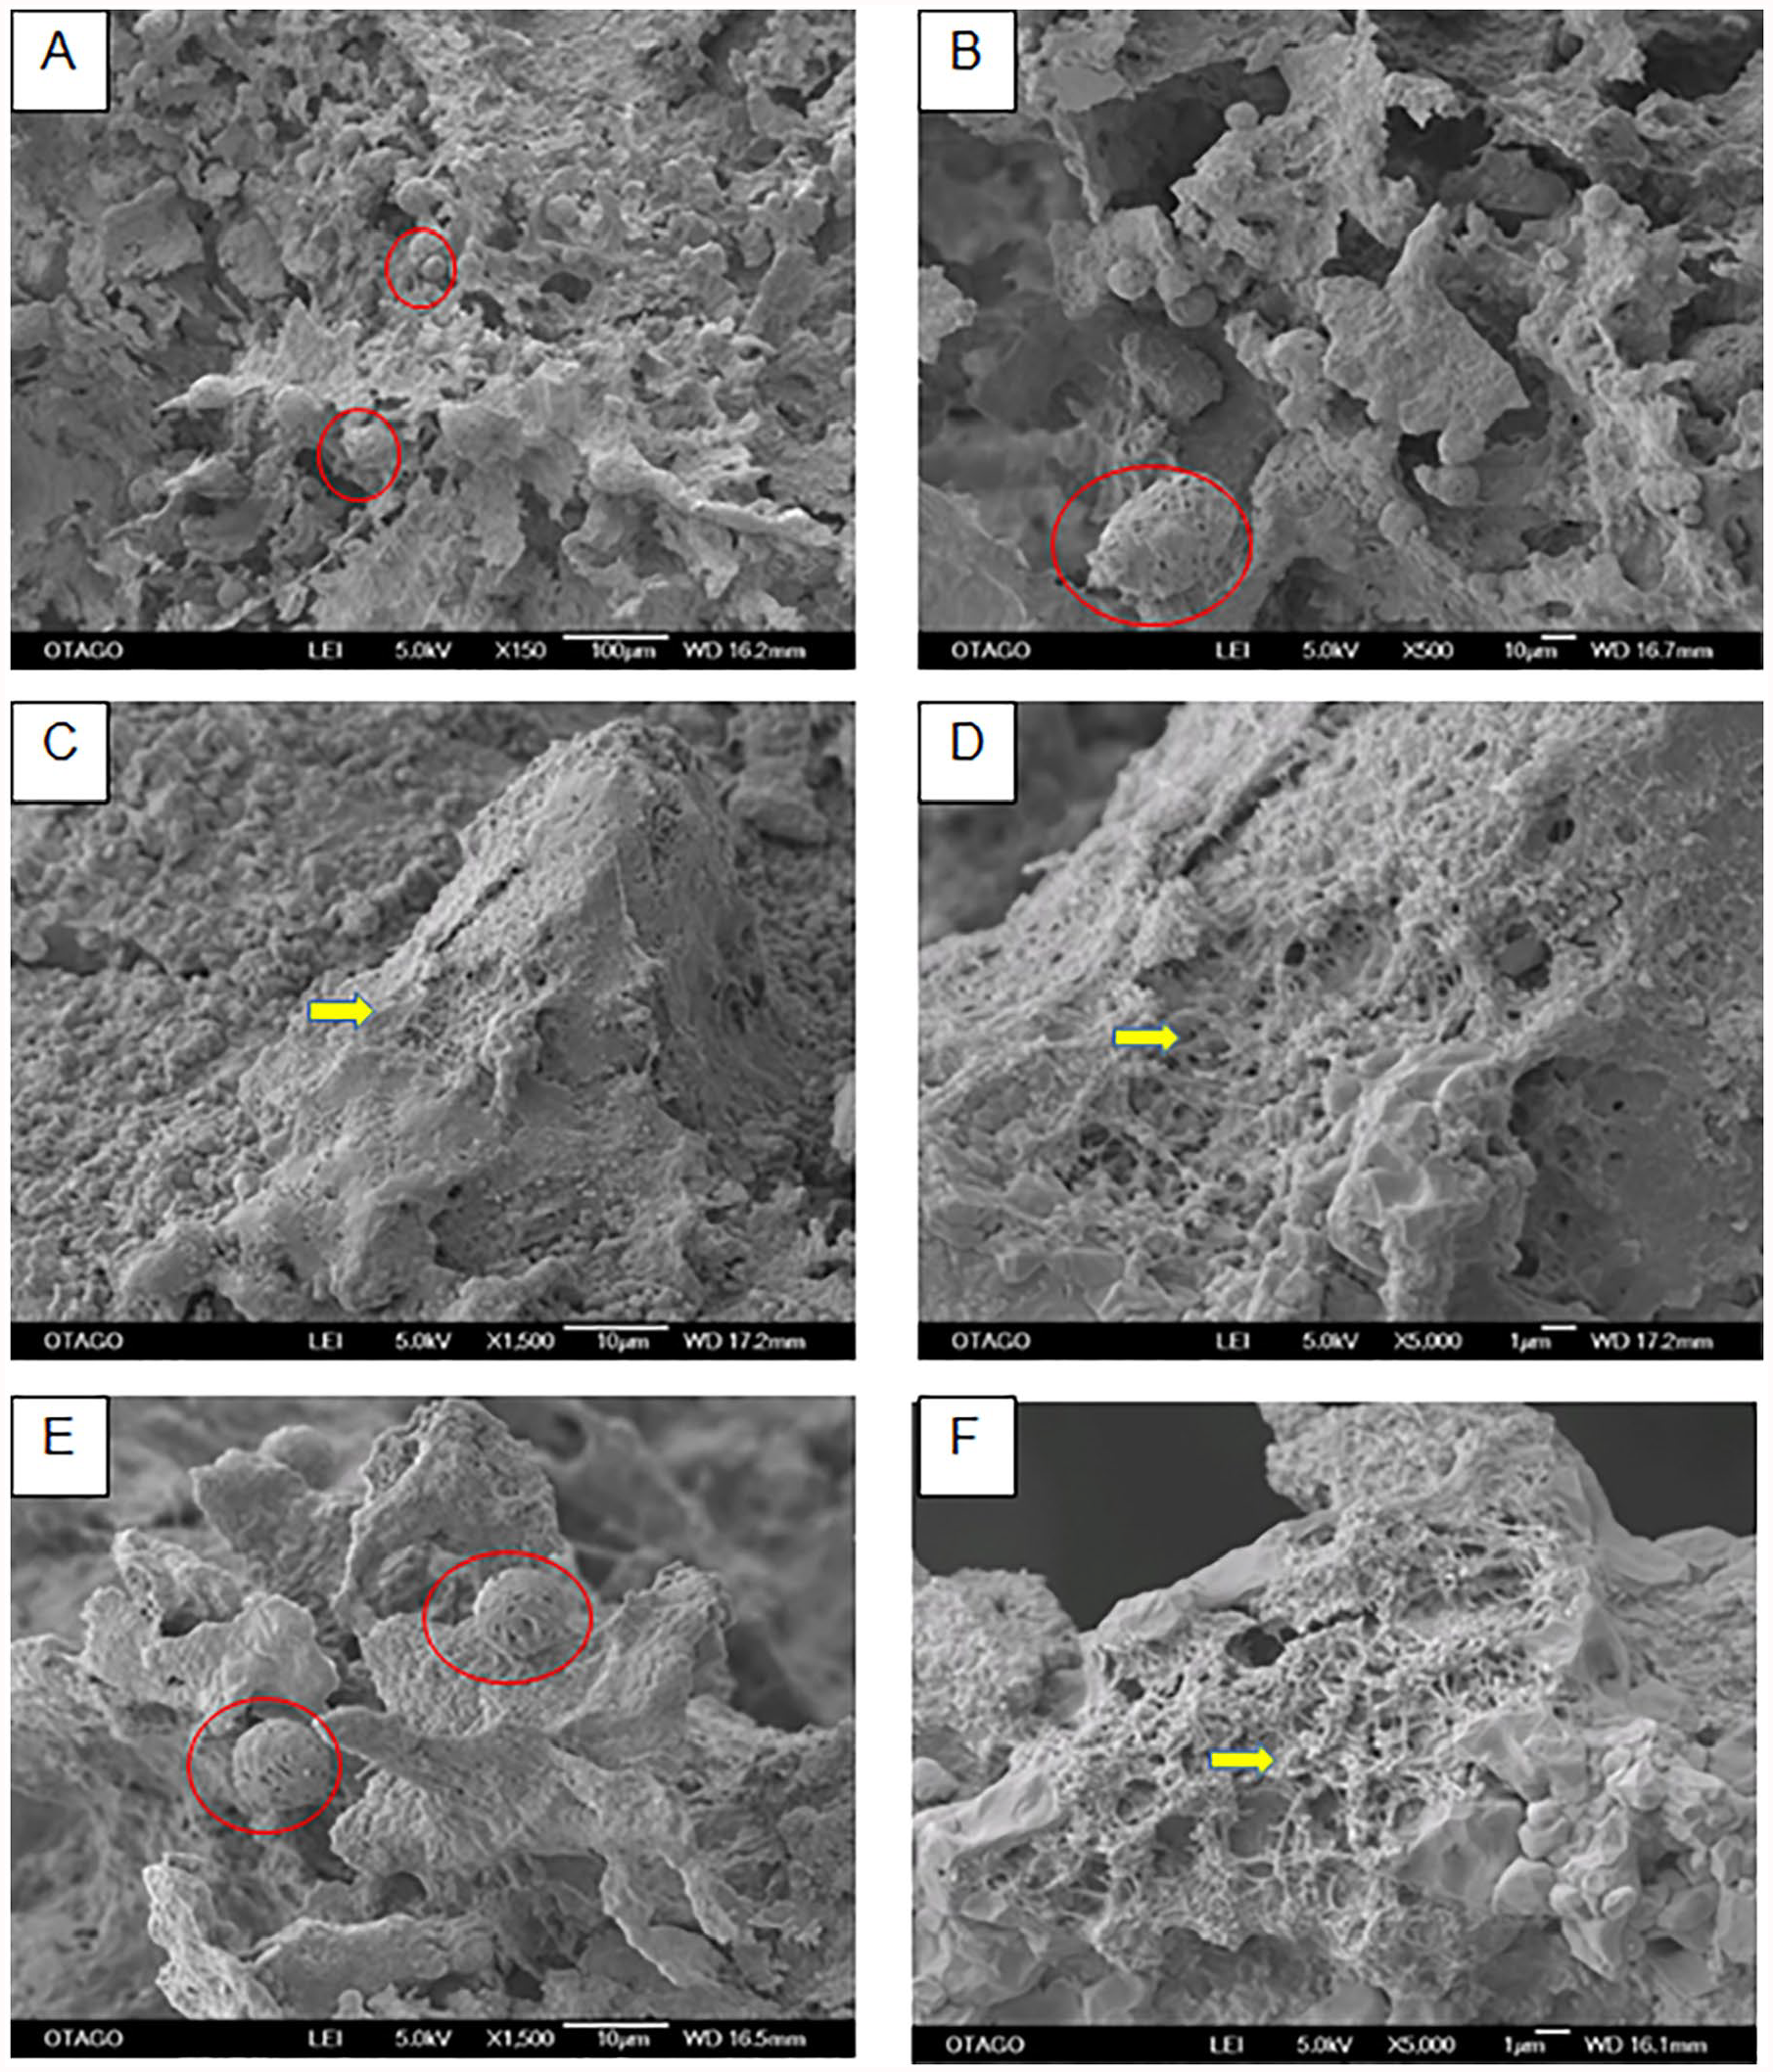
SEM analysis of cell (red circles) and 3D fibrin networks (yellow arrows) on the C-BG-LyPRF scaffold surfaces. SEM magnification, (a) X150, (b) X500, (c) X1500, (d) 5000, (e) 1500, and (f) 5000. Scale bars are shown.
The EDX spectra shows that the inorganic constituents of the C-BG scaffold consist of sodium (Na), Silicon (Si), calcium (Ca) and phosphorus (P) with these elements present in BG. In addition, the trace elements of phosphorous (P), chloride (Cl), and potassium (K) is a result of the LyPRF present in the scaffold.
Analysis of SEM images demonstrated that the mean pore size for C-BG was 116 ± 30.52 µm. It was also observed that the C-BG scaffold also exhibited a homogenous interconnected porous structure within the scaffold. The spherically shaped pores ranged from 27 to 321 µm in diameter (Figure 3). Cross-sectional images of the C-BG-LyPRF scaffold demonstrated a homogenous interconnected network with a porous microarchitecture (Figure 3). The spherical shaped pores identified in the C-BG-LyPRF scaffolds ranged from 30 to 300 µm. The minimum pore size for the C-BG-LyPRF scaffold was 68.26 ± 49 µm, while the maximum pore size was 271.46 ± 49 µm. The mean pore sizes for the C-BG-LyPRF scaffolds were 146 ± 23.69 µm.
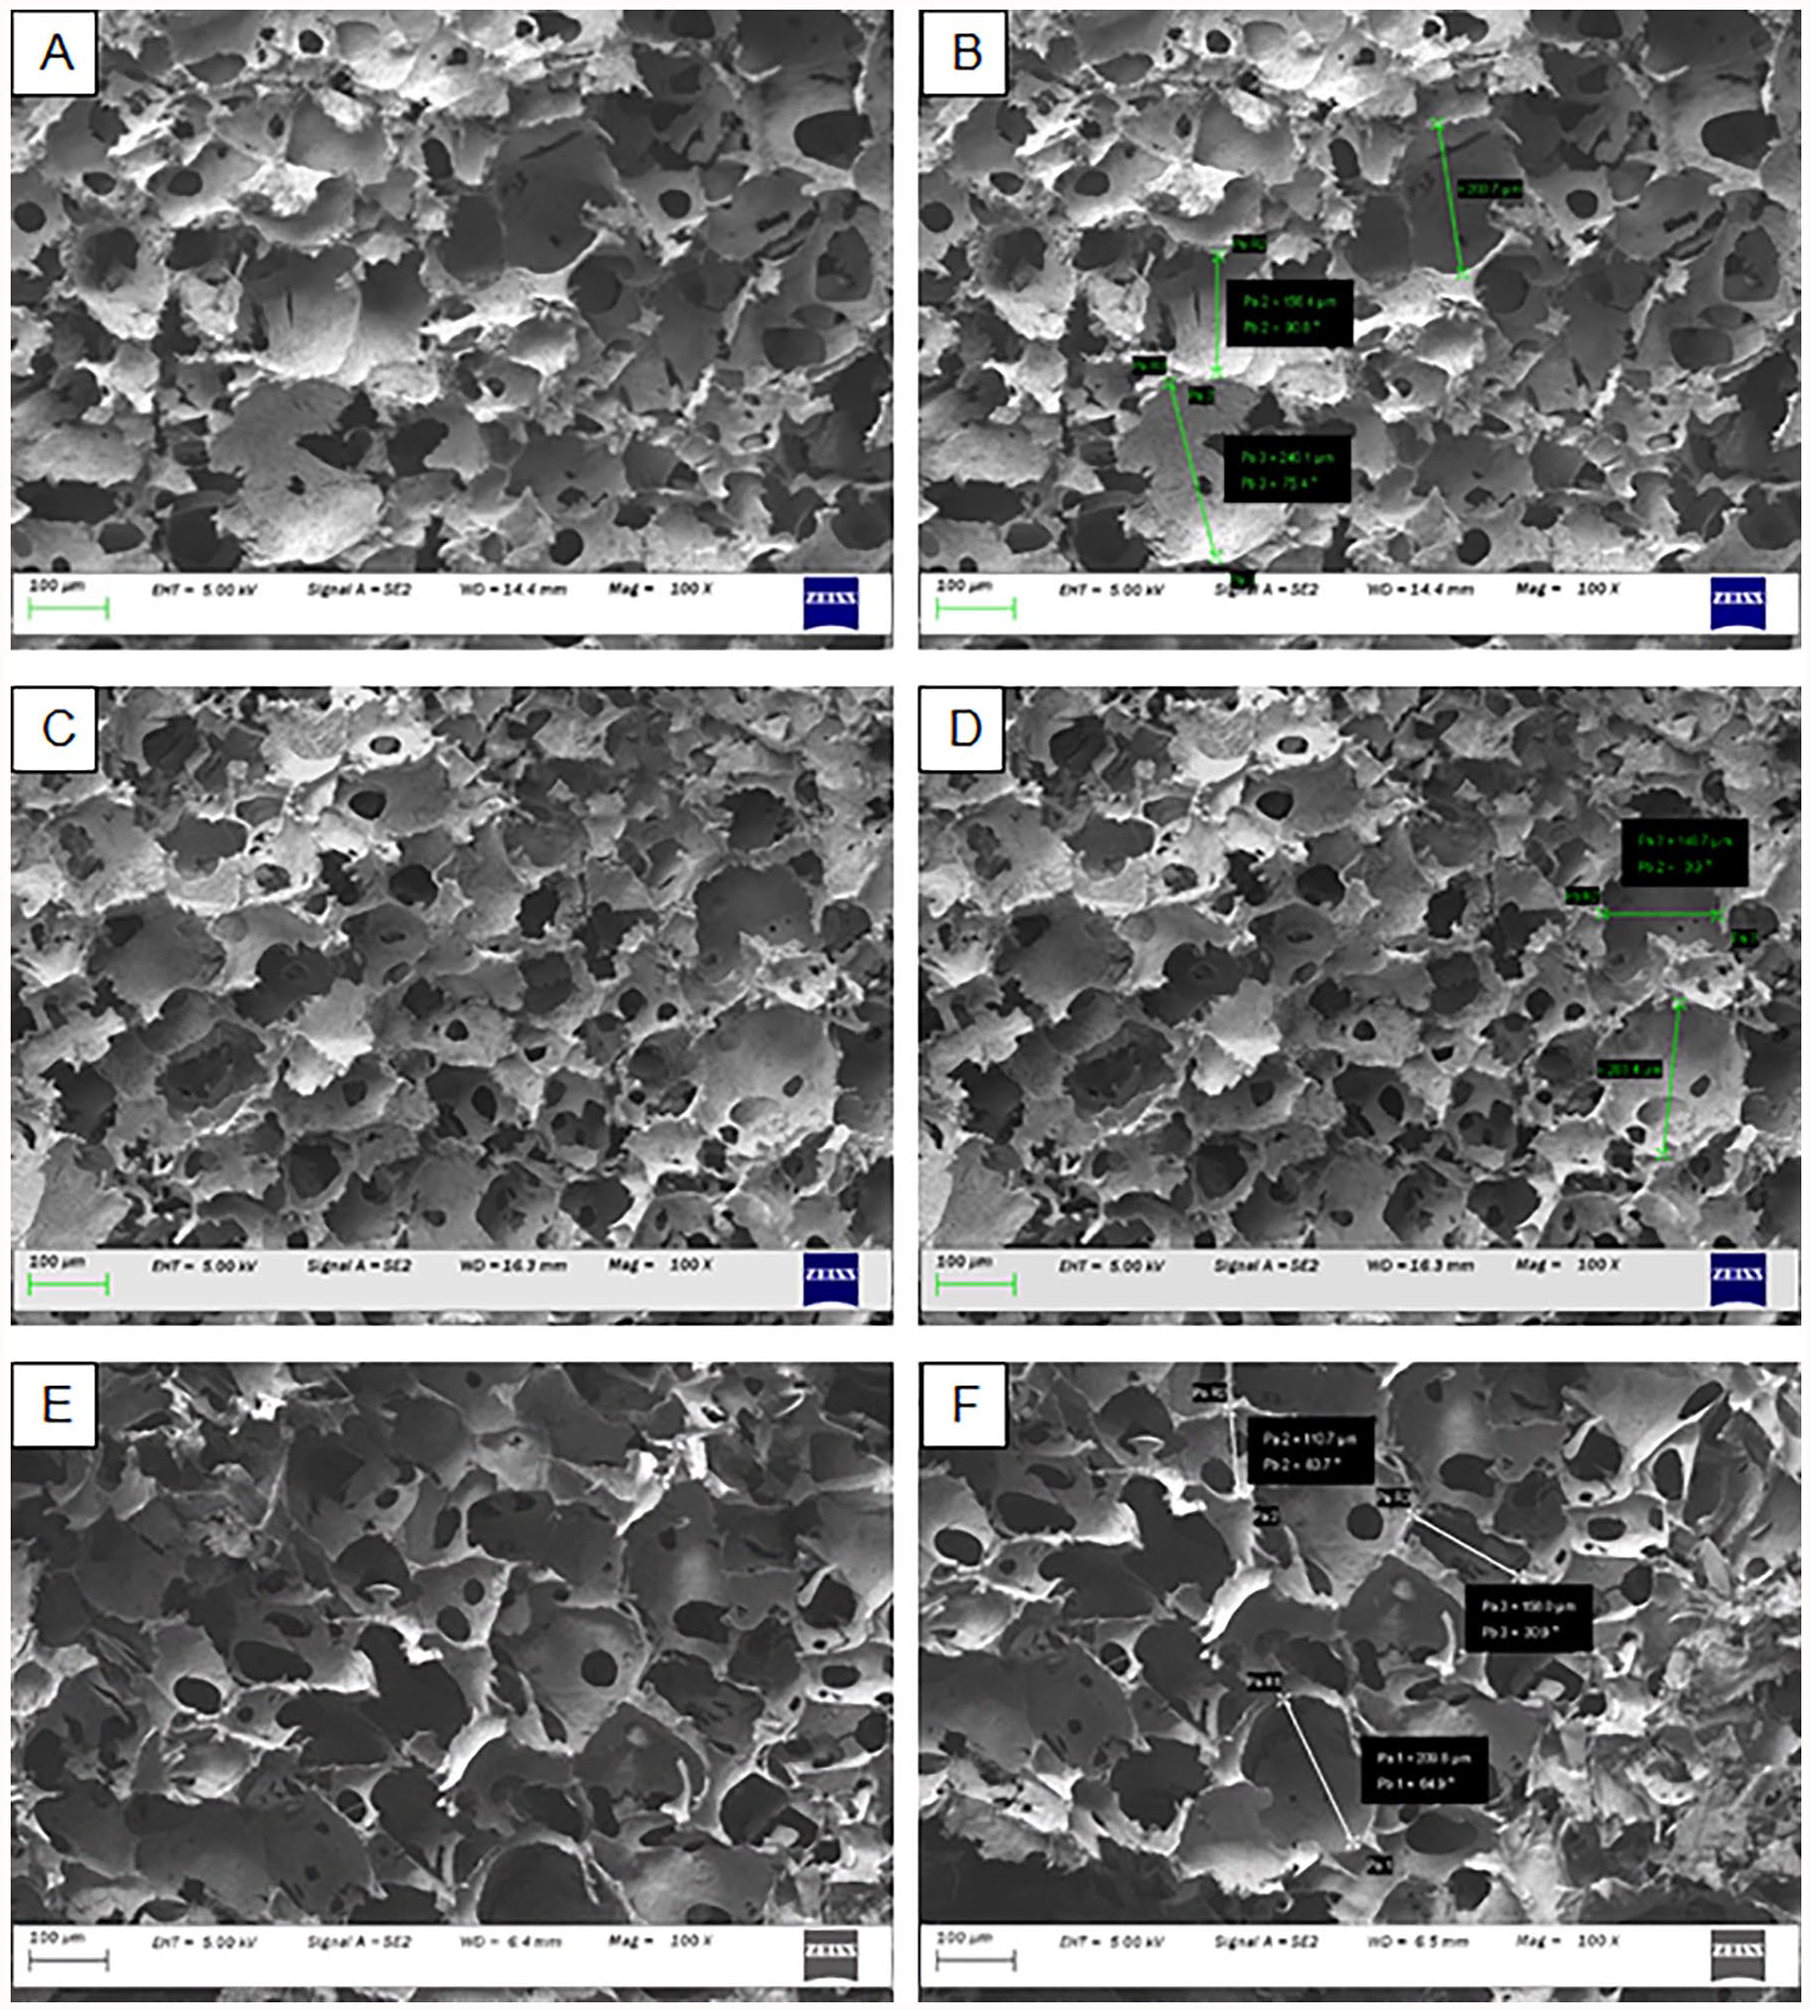
SEM analysis of C-BG-LyPRF pore diameter at ×100 magnification. The green and white lines represent the measurement of the scaffold’s pore sizes. (a and b) C-BG (c and d) C-BG-LyPRF, and (e and f) C-HALyPRF. Scale bars are shown.
Micro-CT analysis demonstrated that the mean total porosity of the C-BG-LyPRF scaffold was 87.26% ± 0.19%. A 2D cross-sectional image of C-BG-LyPRF scaffold is presented in Figure 4. The homogeneous and interconnected porosity is apparent, as well as the thickness of the struts in the scaffolds. EDX data for a single area within the scaffold’s surface, along with the average of the EDX elemental analysis for all different concentrations of the C-BG-LyPRF scaffold is displayed in Figure 1. EDX analysis showed that the inorganic phase of the C-BG-LyPRF and C-HA-LyPRF scaffolds were composed of sodium, calcium, silicon, and phosphorus with traces of chlorine and sulphur. In contrast, the C-BG scaffold was composed of sodium, calcium, silicon, and phosphorus with an absence of trace elements, such as chlorine and sulphur.
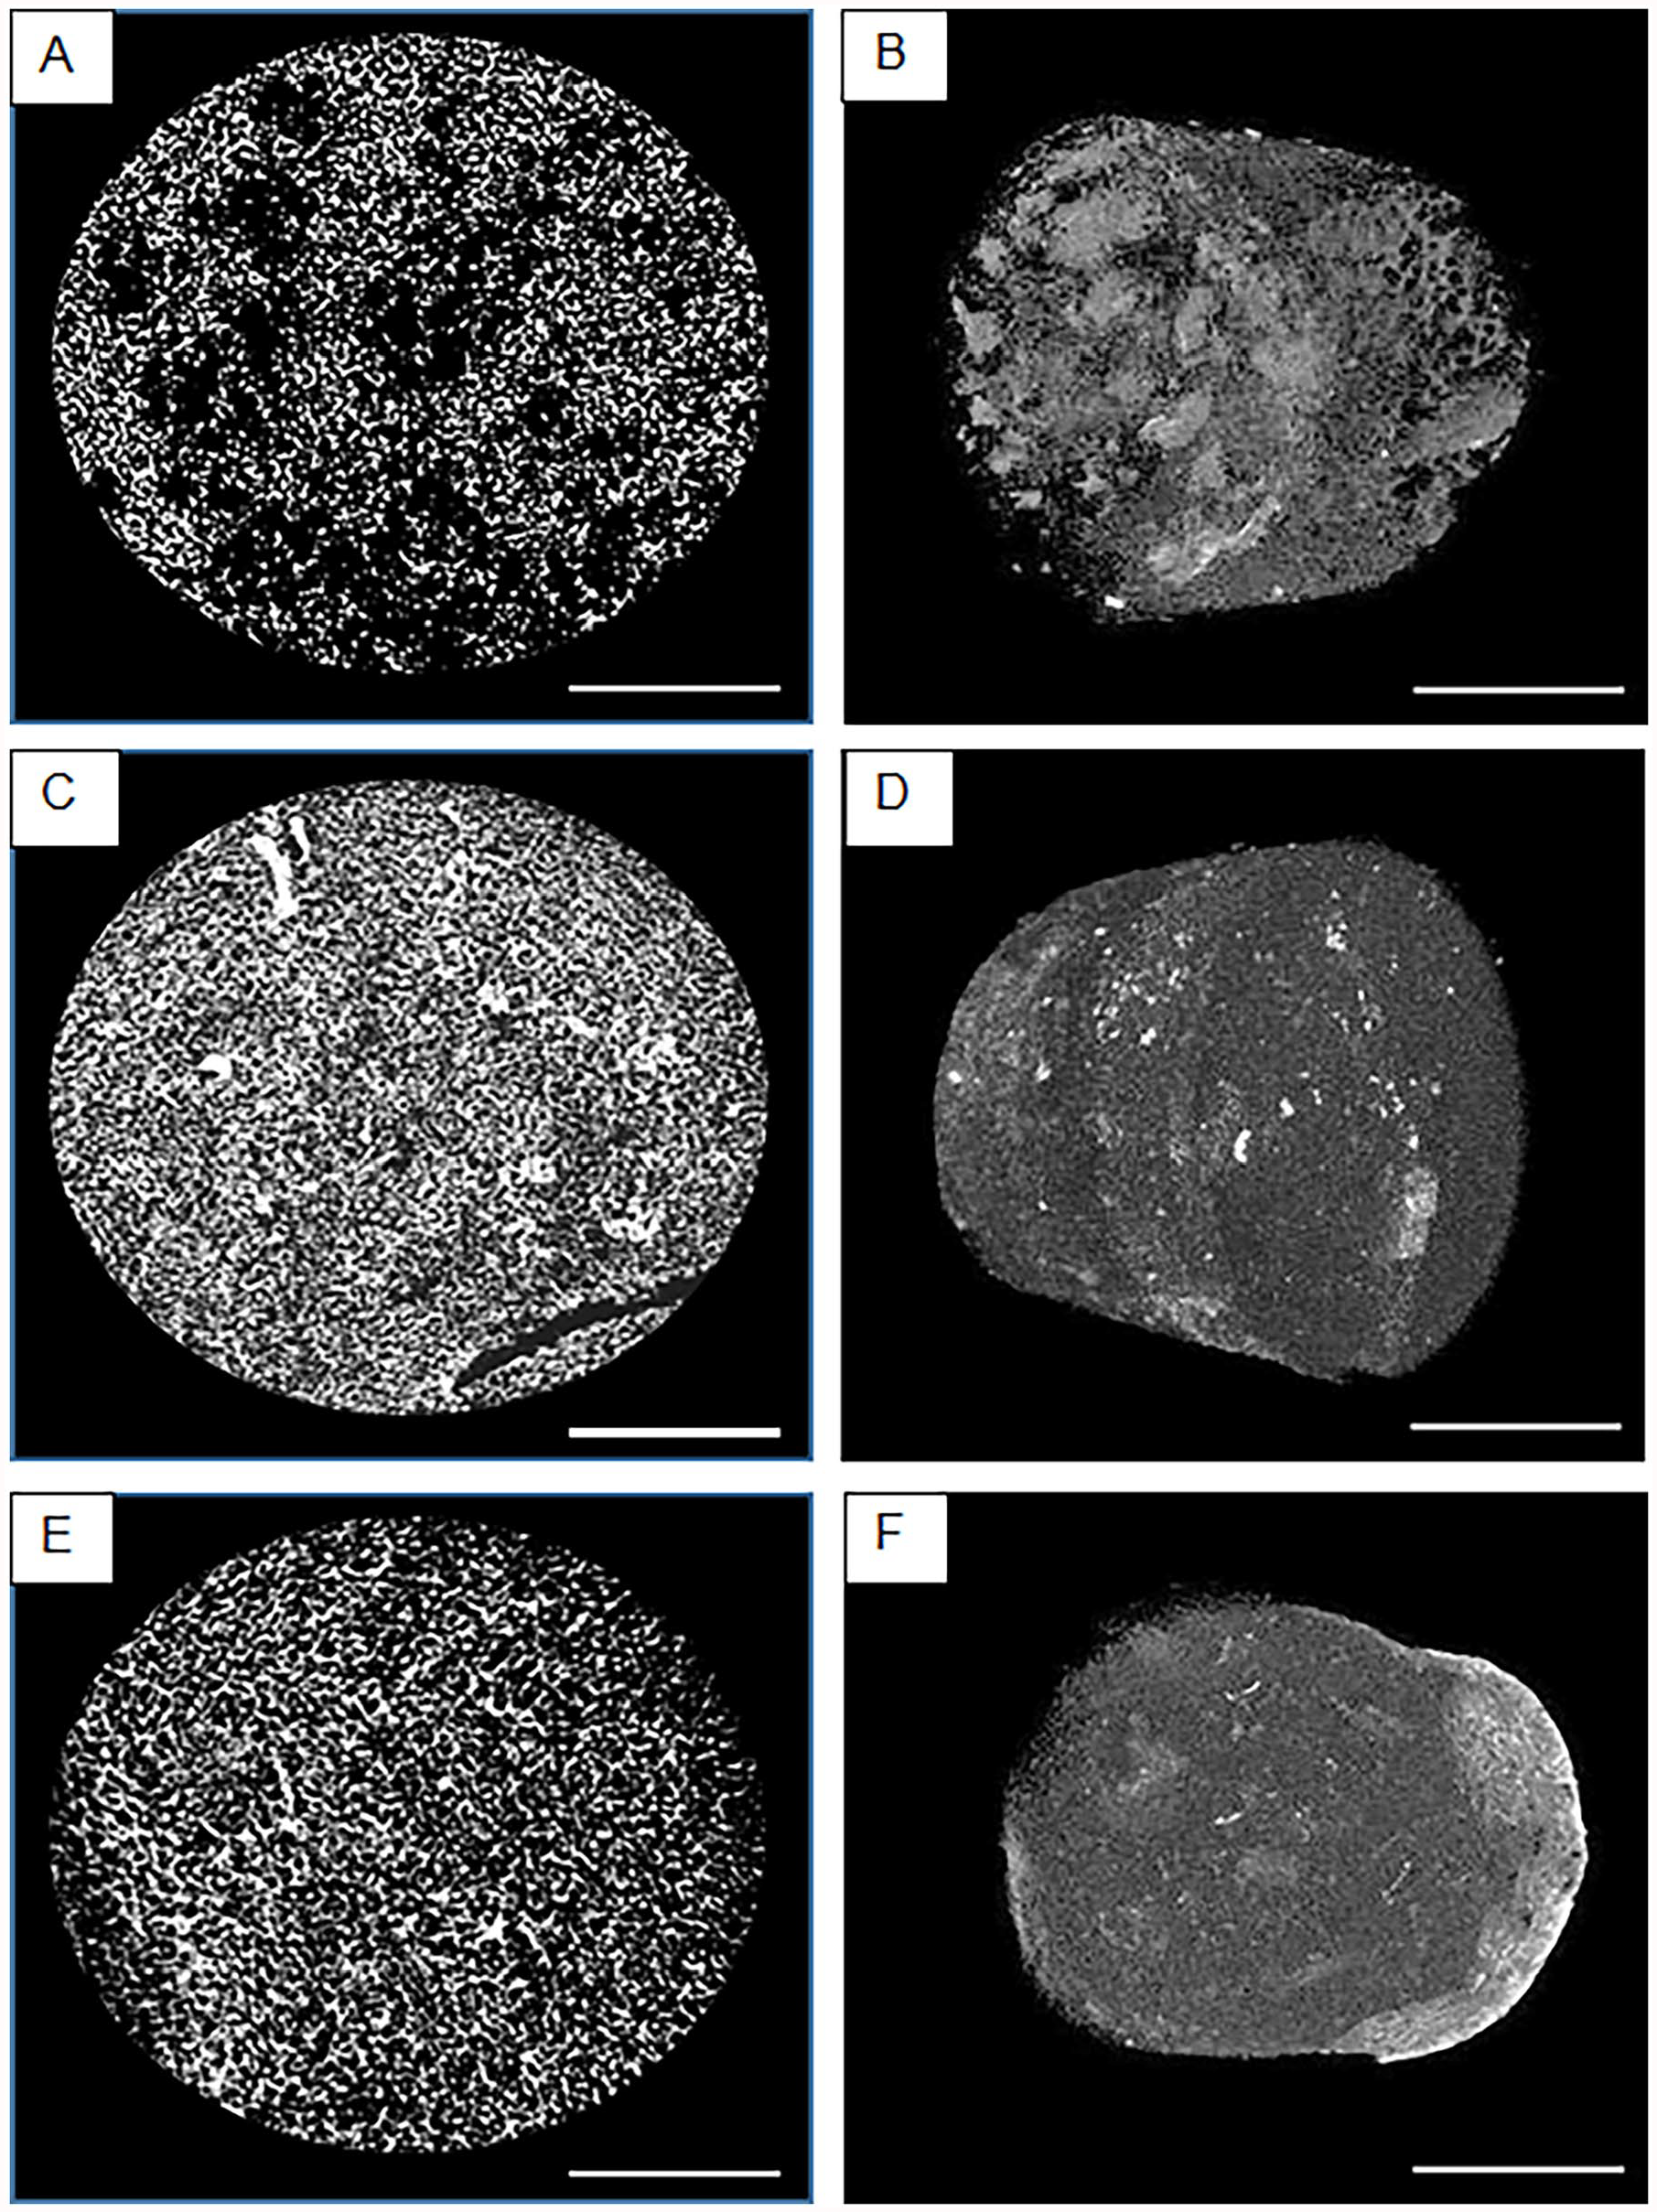
2D and 3D micro-CT images of (a and b) C-BG, (c and d) C-BG-LyPRF, and (e and f) C-HALyPRF. Scale bar = 5 mm.
FTIR spectroscopy was conducted to assess the presence of collagen, bioactive glass and LyPRF in the blended composite scaffolds (Figure 5). Analyses also enabled determination of the structural changes of the collagen and bioglass material. The C-BG scaffold demonstrated the presence of amide I, amide II and amide III at 1637, 1559 and 1338 cm−1. These spectra represent the typical associated band of collagen in the sample. The presence of peaks at 512, 800 and 1016 cm−1 was attributed to the Si-O-Si bending vibration, the Si-O stretching vibration, and the Si-O-Si stretching asymmetry caused by the bioglass composition. The FTIR spectra of the C-BG-LyPRF scaffold in the range of 4000–400 cm−1 reveals a broad band between 3100 and 3500 cm−1 attributed to O-H stretching vibrations in collagen, caused by strong intramolecular and intermolecular hydrogen bonds. The characteristic absorption bands of the original collagen at 1631, 1532, and 1234 cm−1/1336 cm−1 correspond to the stretching vibration of the C=O of amide I, and the C-N stretching/N-H bending of amide I and III, respectively. There were no apparent changes in the peak form or wavenumber in relation to the LyPRF concentration in the scaffold. The presence of peaks at 505–512 cm−1, 795–798 cm−1, and 1013–1020 cm−1, respectively, was attributed to the Si-O-Si bending vibration, the Si-O stretching vibration, and the Si-O-Si stretching asymmetry related to the bioglass composition.
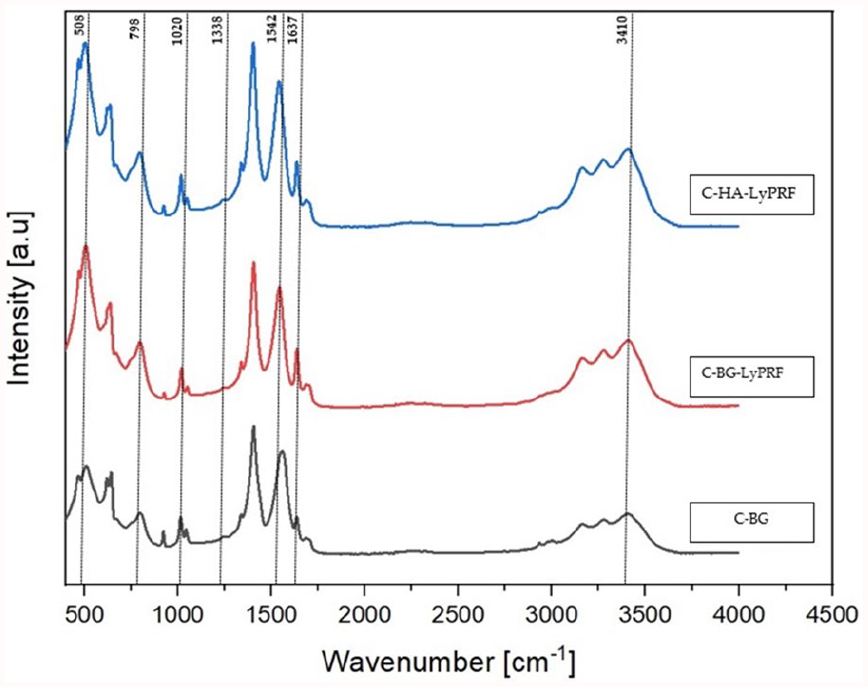
FTIR spectra for the C-BG, C-BG-LyPRF and C-HA-LyPRF scaffolds.
Water uptake capability of all scaffolds based on swelling test
The degree of swelling for C-BG, C-BG-LyPRF and C-HA-LyPRF is shown in Figure 6. The mean percentage swelling ratio for the C-BG scaffold at 10 min was 30.84% ± 9.76% which gradually increased and peaked at 60 min to 126.70% ± 8.69%. At 3 h the values were 104.20 ± 13.98, followed by 90.08 ± 6.46 and 85.83 ± 3.72 at 6 and 24 h, respectively. For the C-BG-LyPRF scaffold, at 10 min the swelling ratio percentages were 68.50 ± 18.86. The swelling ratio reached its maximum level at 50 min to 157.43 ± 13.25. Later, the level remained constant at 60 min before slowly decreasing to 125.38 ± 15.11, 116.94 ± 8.48 and 109.74 ± 6.21 at 1, 3, 6, and 24 h. With regards to C-HA-LyPRF, the swelling ratio gradually increased from 10 min onwards and reached a maximum at 40 min at 130.24 ± 39.78. Subsequently, the swelling rate gradually decreased to 95.46 ± 13.99, 90.03 ± 8.40, 84.05 ± 6.32, 78.71 ± 5.63 and 75.27 ± 11.16 at 50, 60 min, 3, 6 and 24 h, respectively. C-BG-LyPRF exhibited the highest swelling ratio statistically, compared with the other scaffolds at 50, 60 min, 6 and 24 h (p < 0.05).
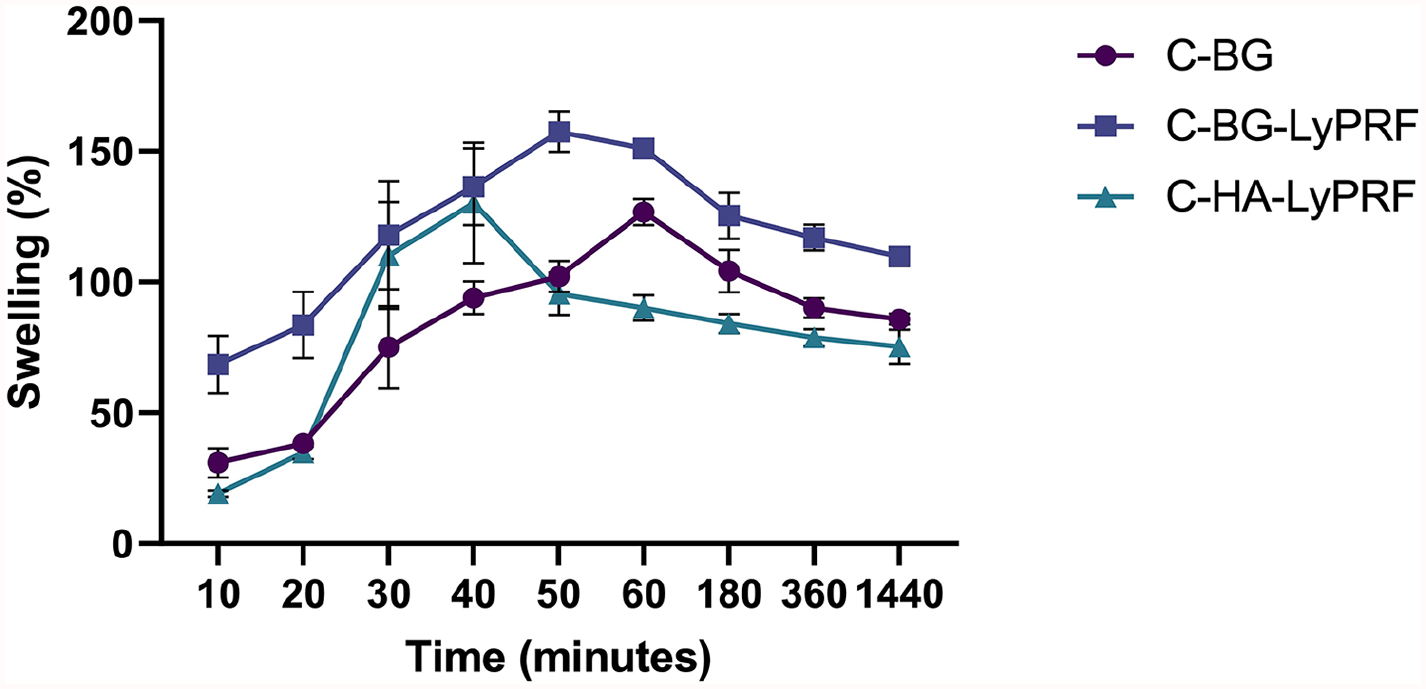
Plot of swelling analysis for the C-BG, C-BG-LyPRF and C-HA-LyPRF scaffolds over time.
PDGF-AB growth factor release from the scaffolds
The level of PDGF-AB was observed to be significantly highest on day 1 for both the C-BG-LyPRF and C-HA-LyPRF scaffolds. Later, growth factor levels were dramatically decreased from day 4 to day 28. On day 1, the growth factor levels were statistically greater than those on days 4, 7, 14, 21 and 28 for the C-BG-LyPRF scaffold by 6.42-fold, 44.06-fold, 410.86-fold, 410.11-fold, and 660.52-fold, respectively (p < 0.05). Moreover, the level of growth factor on day 4 was significantly higher than day 14, day 21 and day 28 (p < 0.05) in the C-BG-LyPRF scaffold group. Nevertheless, no PDGF-AB growth factors were detected in the C-BG scaffold at any time point analysed. Although the concentration of PDGF-AB growth factors appeared to be greater in C-HA-LyPRF than in C-BG-LyPRF throughout the experimental period, this difference was not statistically significant in our study (p > 0.05). The cumulative average release of PDGF-AB over 4 weeks for C-BG-LyPRF and C-HA-LyPRF scaffolds is illustrated in Figure 7.
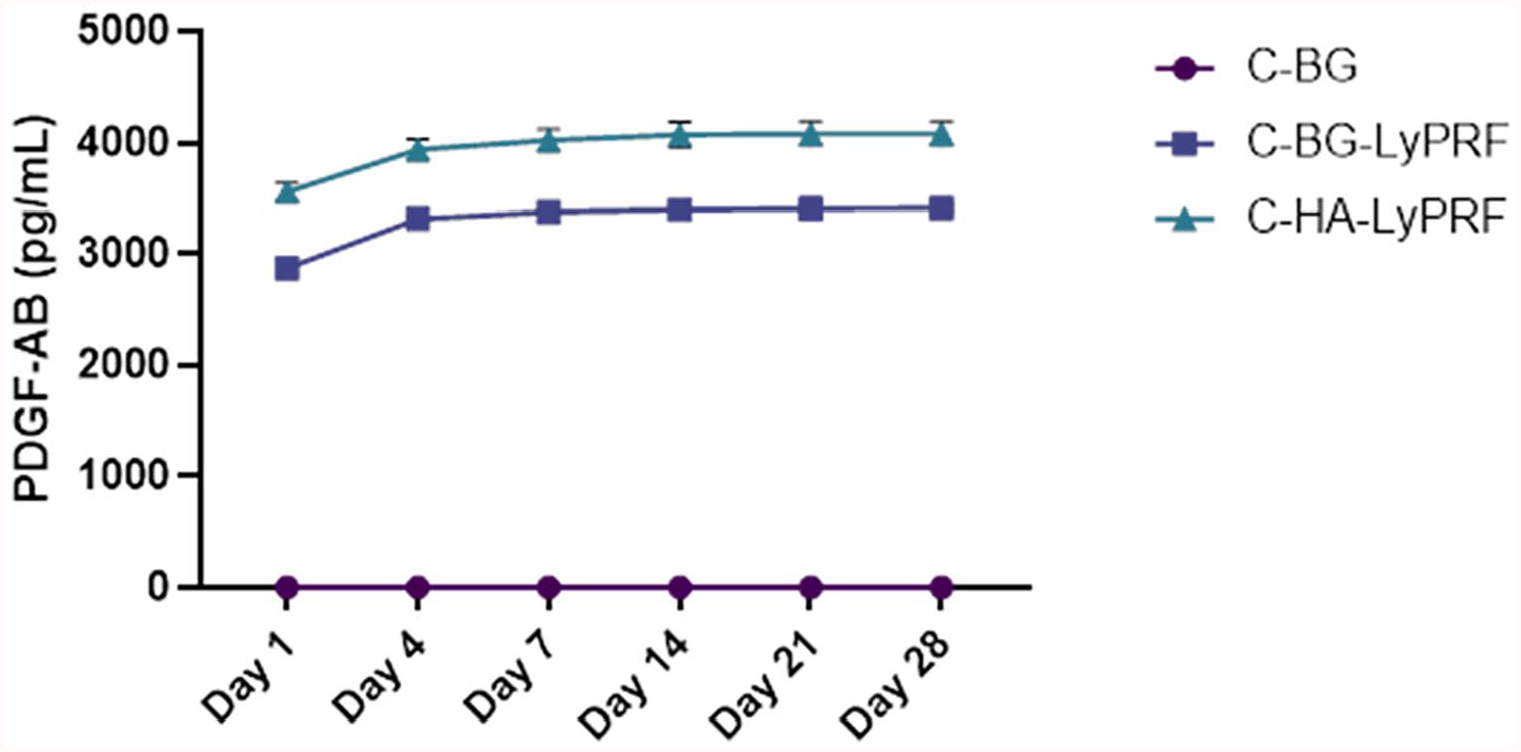
The cumulative release pattern of PDGF-AB from C-BG, C-BG-LyPRF and C-HA-LyPRF scaffolds.
Cytocompatibility of MC3T3-E1 responses to the scaffolds
Representative fluorescent images of the MC3T3-E1 cells cultured for 24, 48, and 72 h following exposure to the scaffold extract conditioned-medium at 10 mg/mL, are shown in Figure 8. After 24 h, MC3T3-E1 cells exposed to C-BG extracts exhibited 99.29% ± 0.37% cell viability, while cells exposed to C-BG-LyPRF and C-HA-LyPRF had 99.55% ± 0.11%, and 99.18% ± 0.34% viability, respectively. At 48 h, the viability of cells exposed to each scaffold extract marginally increased to 99.75 ± 0.03, 99.87 ± 0.02, and 99.77% ± 0.02% for C-BG, C-BG-LyPRF, and C-HA-LyPRF, respectively. The cells incubated in control medium, showed a decrease in percentage cell viability of approximately 0.28% after 48 h. After 48 h of incubation, however, there was no notable difference between data for any of the groups. After 72 h culture, all groups exhibit a marginal decrease in cell viability to 98.22 ± 0.53, 98.40 ± 0.76, and 96.40% ± 1.73% for C-BG, C-BG-LyPRF, and C-HA-LyPRF, respectively. This may be due to cell floating in the well plate due to less surface areas in the well plate for the cells to attached since the seeding density is 6000 cells per well in 48 WP, hence the reduced surface area in the well plate for the cell maybe due to the higher proliferation and population doubling of the cells. The number of viable cells in all groups was significantly higher when compared to the control group after 72 h culture (p < 0.05).
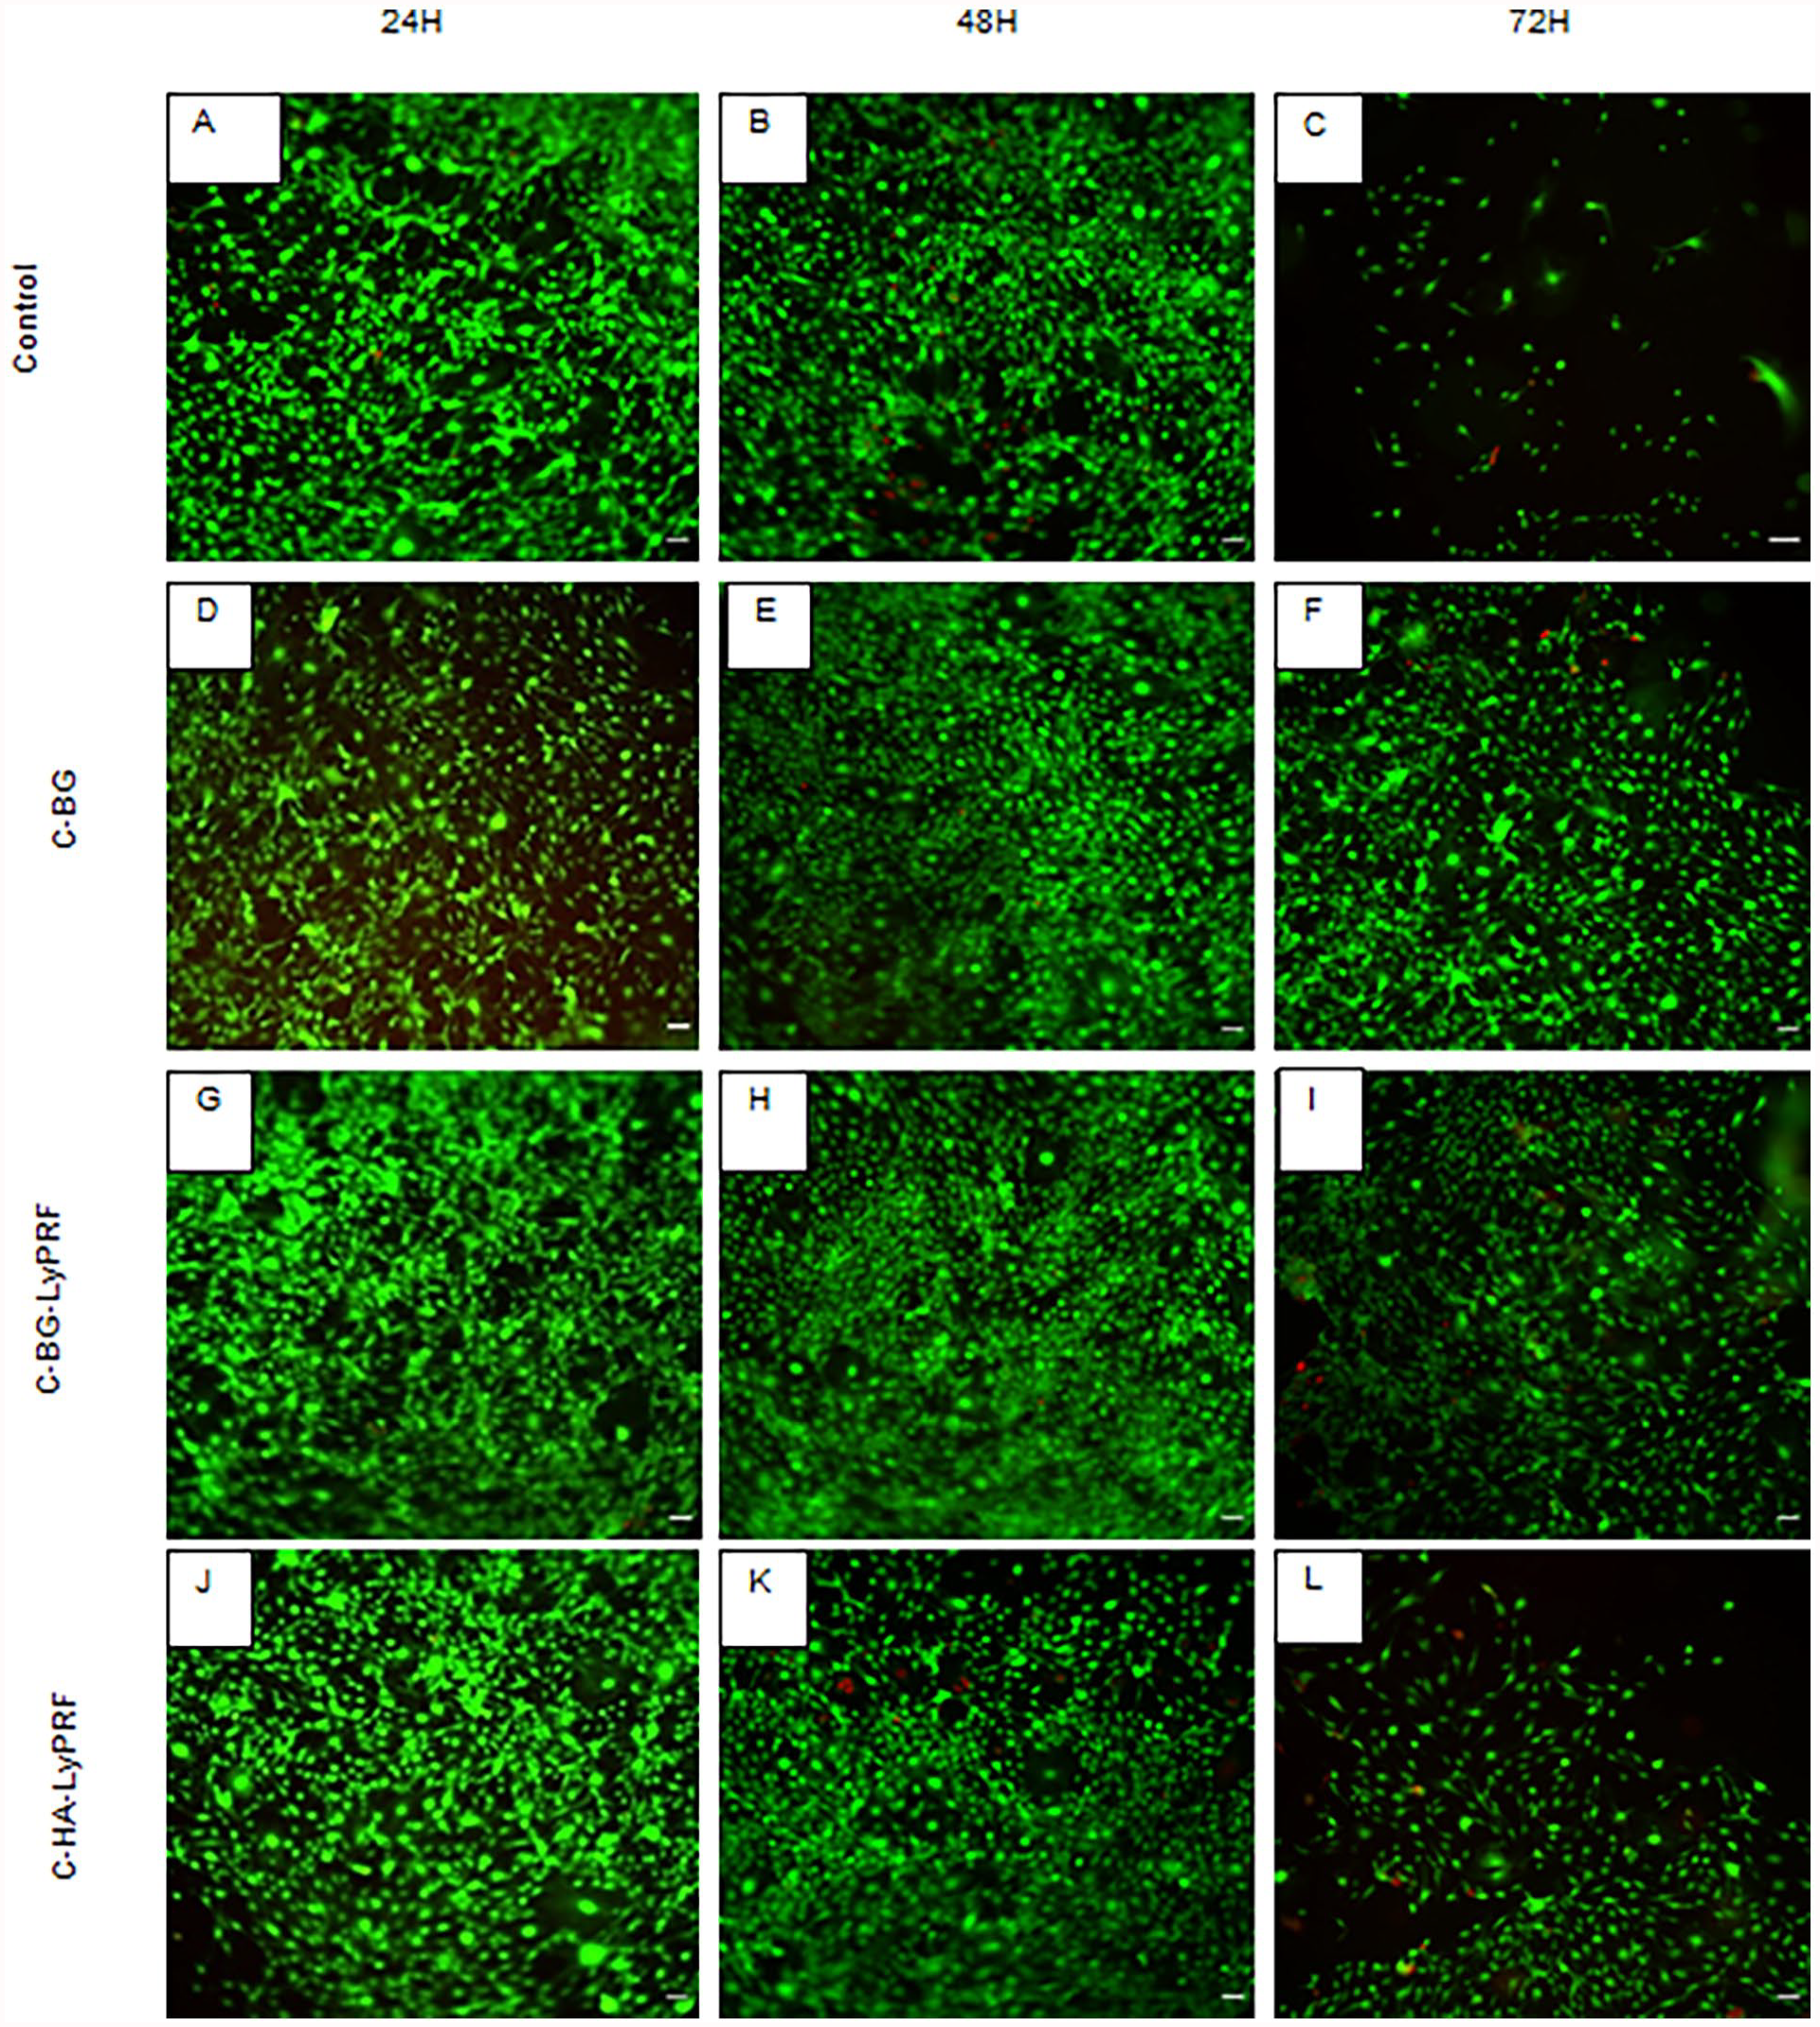
Representative fluorescent images of MC3T3-E1 cells after 24-, 48- and 72-h incubation with C-BG, C-BG-LyPRF, and C-HA-LyPRF scaffold extract media, followed by the LIVE/DEAD viability staining. Green = live cells (calcein). Red cells = dead cells (ethidium homodimer-1). (a–c) Control, (d–f) C-BG, (g–i) C-BG-LyPRF and (j–l) C-HA-LyPRF. Scale bar = 200 μm.
Cell proliferation of MC3T3-E1 cells
The MTS assay was used to determine the proliferation of MC3T3-E1 cells after exposure to C-BG, C-BG-LyPRF, and the C-HA-LyPRF scaffold extract media at 10 mg/mL. MC3T3-E1 cells proliferated significantly from 24 to 72 h after being exposed to C-BG, C-BG-LyPRF, and the C-HA-LyPRF scaffold extract media (p < 0.05). The MTS analysis of MC3T3-E1 cells from 24 to 72 h are presented in Figure 9. MC3T3-E1 cells grown in the C-BG-LyPRF scaffold extract medium showed a significant increase in cell proliferation from 48 to 72 h (p < 0.001). At 72 h, the cells exposed to the C-BG-LyPRF extract medium exhibit a 1.50-, 1.31-, and 1.44-fold increase in cell numbers compared to cells in the C-BG and C-HA-LyPRF scaffold extracts medium, and the control medium (p < 0.05). However, no significant differences in cell numbers were observed among the C-BG-LyPRF group, with other groups at 24 and 48 h. With regards to the MC3T3-E1 cell incubated with C-BG and the C-HA-LyPRF’s scaffold extract media, no significant difference was observed between groups at 24, 48 and 72 h (p > 0.05). In general, the number of MC3T3-E1 cells increased over the duration of 72 h based on the MTS assay, indicating that the cells were capable of proliferating when exposed to all types of material. MTS assay supported the Live/Dead assay results as it was apparent from both assays that MC3T3-E1 demonstrated greater viability and proliferation after exposure to C-BG-LyPRF than other groups, particularly at 72 h.
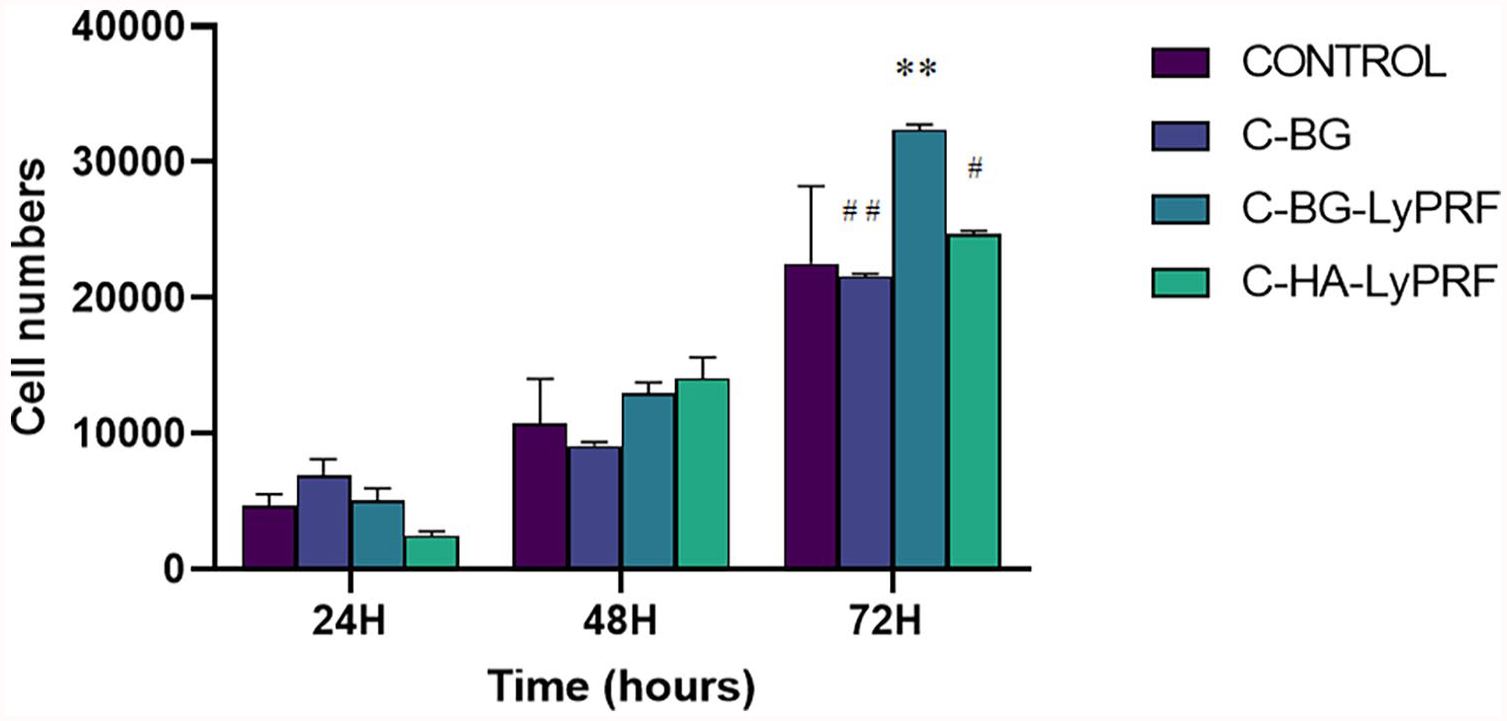
The MTS activity of MC3T3-E1 cells incubated in B-CG, C-BG-LyPRF and the C-HA-LyPRF scaffold extract media.
Discussion
In this current study, the C-BG-LyPRF hybrid scaffold demonstrated a highly porous and interconnected structure. The C-BG-LyPRF also exhibited the highest mean pore diameter compared with the control groups (C-BG and C-HA-LyPRF). Reportedly, this relatively high pore diameter and an interconnected pore structure in C-BG-LyPRF scaffolds allows for better cellular penetration and nutrition delivery to the cells, as well as for waste product diffusion out of the scaffold. 36 The mean pore size of the C-BG-LyPRF scaffold in this investigation was 146 µm, and this mean pore size is within the recommended mean pore size range (96–150 µm) to facilitate optimal cell attachment, particularly in collagen based scaffolds. 37 The SEM analysis demonstrated that the fibrin strands from LyPRF appeared compacted, linked, and dense, with red blood cells and platelets entangled within the fibrin network. However, the collagen strands exhibit a slender and uneven appearance. 38 Moreover, the distinctive characteristic of the fibrin network structure in LyPRF may also shield the growth factors from proteolysis. Therefore, it is feasible that the growth factors maintain their functionality for a relatively extended duration in order to facilitate their effective promotion of bone regeneration over a prolonged period. 23
Porosity is defined as the proportion of void space in a solid material. 39 In this study, micro-CT analysis revealed that the C-BG-LyPRF scaffold was a highly porous material with a mean porosity of 87.2%. The mean porosity of the C-BG-LyPRF scaffold in this study was comparable with that of previous reports using composite collagen and bioglass scaffolds, which demonstrated an average porosity of 85% and 96% for their bone scaffold investigations, respectively. 40 The high porosity of the C-BG-LyPRF scaffold will allow for the release of biofactors such as proteins or cells and will serve as an ideal substrate for nutrition exchange.41,42 This morphological characteristic is crucial for bone regeneration as a porous surface enhances the physical stability of the scaffold by facilitating mechanical interlocking between the scaffolds and surrounding tissue. 39 Moreover, the Micro-CT analysis revealed that the C-BG-LyPRF scaffold has a significantly lower porosity compared with the control groups (C-BG and C-HA-LyPRF scaffolds) in this study. Interestingly, the porosity analysis also demonstrated that when LyPRF was incorporated into the C-BG scaffolds, the percentage of porosity was significantly reduced. We hypothesise that the incorporation of LyPRF into the scaffold may be the cause of this change in porosity. In order to ascertain the relationship between porosity and LyPRF, additional research should be conducted. EDX is a well-established technique for microanalysis of the elemental component that utilises the generation of characteristic X-rays to determine the presence of elements in specimens. C-BG-LyPRF and C-HA-LyPRF predominantly constituted of sodium with trace quantities of silicon, calcium, phosphorus, potassium, chlorine, and sulphur. However, there was no chlorine or sulphur detected in the C-BG scaffold. Therefore, we hypothesised that the chlorine and sulphur traces originated from LyPRF.
FTIR studies of C-BG and C-BG-LyPRF revealed the existence of Amide I, Amide II, and Amide III at 1635–1637 cm−1, 1542–1566 cm−1, and 1338 cm−1, respectively, in the samples. These data are comparable with those described in the literature for collagen scaffolds and consistent with the extraction of type I collagen from animal sources. 31 The characteristic absorption bands of raw collagen were at 1631, 1532, and 1234 cm−1/1336 cm−1 which correspond with the stretching vibration of the C=O of amide I, and the C-N stretching/N-H bending of amides I and III, respectively. These spectral bands are distinctive of collagen.20,31 Additionally, LyPRF contains unique bands at 1635, 1530 and 1338 cm−1 that was associated with the C=O stretch of amide I, the N-H bend of amide II, and the C-N bend of amide III, respectively. 42 Moreover, the C-BG-LyPRF scaffold displays bands that are equivalent to those found in the previously described composite scaffold with LyPRF reported in the literature.42,43 Numerous studies on freeze-dried platelets and fibrin clots revealed a band between 1540 and 1550 cm−1 that is suggestive of alpha helical structures and is particularly apparent in the amide II region. 43 In this study, the same peak was obtained in all the C-BG-LyPRF samples.
Swelling refers to the capability of the scaffold materials to absorb fluid under physiological conditions. 44 The swelling behaviour of C-BG, C-BG-LyPRF, and C-HA-LyPRF scaffolds after 24 h of immersion was investigated. After 50 min, C-BG-LyPRF had the highest swelling rate of 157%, whereas C-BG had the highest swelling rate of 127% at 60 min. C-HA-LyPRF, on the other hand, achieved the peak swelling ratio of 130% in 40 min. This finding demonstrated that the C-BG-LyPRF scaffold had the highest swelling capacity compared with the other control groups. The decrease in swelling ratio after ~40–50 mins are contributed to by the dissociation of the scaffolds that cause the breakage of the interconnectivity of the struts. The fabrication of the scaffolds did not involve any sintering or high temperature treatment, hence resulting in the scaffolds readily disintegrating and releasing important elements into the surrounding environment at dedicated time points, as is shown by the PDGF release profile. This also enabled an additional role of the scaffold as a potential carrier for key growth factors to the site on injury. This greater swelling property in C-BG-LyPRF scaffolds will result in greater cellular adhesion and infiltration. 44 The high hydrophilicity of collagen that generates the considerable swelling features of the scaffolds may offer better surgical adaptation and superior healing properties, particularly in craniofacial surgery. 45
The current study demonstrated the sustained release of PDGF-AB from C-BG-LyPRF and C-HA-LyPRF for up to 28 days. The highest kinetic release pattern of the growth factor was observed at day 1 for both scaffolds. This was followed by a rapid decrease in the growth factor release at day 4 which levelled off for both groups at 21 days. Ammar and colleagues also reported a similar finding in their study, and indicated that by incorporating a platelet concentrate into a hydrogel scaffold, growth factor release can be prolonged, while also providing critical bioactive molecules for cell adhesion and proliferation on the scaffold surface. 46 LyPRF is a biologically active substance utilised in the field of regenerative medicine, specifically for the purpose of promoting healing in bones and soft tissues. It is obtained from the patient’s blood and one of the primary components of LyPRF is the growth factors, which are essential for bone regeneration. Platelet-Derived Growth Factor (PDGF) and Insulin-like Growth Factor (IGF) for example, ensure the growth of cultured cells, enhance bone cell proliferation, increasing TGF-β release from macrophages, and promote fibroblast chemotaxis. 47 Furthermore, the differentiation of mesenchymal stem cells into osteoblasts, the cells responsible for new bone formation, is facilitated by growth factors such as Transforming Growth Factor-beta (TGF-β) and Bone Morphogenetic Proteins (BMPs). This is crucial for the regeneration of bone, particularly in the case of large or intricate defects.
The highly porous and swelling capabilities of C-BG-LyPRF scaffolds may have contributed to the outcome of this PDGF-AB release assay. This is supported by previous research, which demonstrated that a variety of architectural characteristics, including porosity, pore size, and permeability, influence the biological delivery of a tissue-engineered scaffold. 46 The delivery of biological signalling molecules plays a vital role in regulating cellular activity and the regeneration of tissue. Bioactive molecules, such as growth factors, modulate the complexities of cellular activity, including survival, proliferation, migration, and differentiation, and are crucial for the synthesis of the extracellular matrix for bone regeneration. 48 Moreover, the presence of a growth factor can induce the differentiation of recruited precursor cells from the host into bone matrix producing cells, resulting in osteoinduction. 39
The cytocompatibility of C-BG, C-BG-LyPRF, and C-HA-LyPRF scaffolds was determined by an indirect elution technique utilising the Live/Dead® cell viability-cytotoxicity and MTS assays in accordance with the ISO 10993-5 standard. 49 To determine the cytocompatibility of the C-BG, C-BG-LyPRF and C-HA-LyPRF scaffolds, 6000 cells were seeded into the well and maintained for 24, 48, and 72 h to determine cell viability and proliferation assays. 50 It is noteworthy that at each time point, more viable cells were detected in the C-BG-LyPRF scaffold extract medium. The MTS assay was used to determine the scaffold’s potential to induce cell proliferation. The results showed that cell density increased over time; however, there were no significant differences in cell proliferation between cells exposed to the C-BG-LyPRF scaffold extract medium and C-BG and C-HA-LyPRF scaffold extract media after 24 and 48 h, as demonstrated in the MTS Assay. This study supports the C-BG-LyPRF scaffold as potential carrier or reservoir for PDGF-AB growth factor release which demonstrates a high level of biological activity for utility in craniofacial bone tissue repair.
This study did not assess the biological activity of the released PDGF directly, however, the cells responses toward the C-BG-LyPRF scaffolds showed that the cells exposed to the conditioned medium from this scaffold showed higher viable cells compared to other scaffolds. Further study should look into these aspects and assessed other related growth factors that is important in angiogenesis and healing potential in craniofacial bone tissue repair.
Conclusions
The C-BG-LyPRF scaffold demonstrated the mean 146 ± 23.69 µm for pore diameters within an acceptable scaffold porosity of 87.26% ± 0.19%. It was demonstrated that C-BG-LyPRF offers comparable physical and chemical properties for a bone scaffold that resemble the microstructural properties of natural bone. In addition, the superior swelling capacity and sustained release of the PDGF-AB growth factor delivery demonstrated the potential of this novel scaffold for craniofacial tissue engineering. Therefore, the C-BG-LyPRF provides a promising candidate for further in vitro analysis for development for use in craniofacial bone regeneration such as cleft palate repair.
Footnotes
Acknowledgements
We appreciate Mr Andrew McNaughton’s assistance with Micro-computerized Tomography and Confocal Scanning Microscopy.
Data availability statement
Data available on request.
Declaration of conflicting interests
The author(s) declared no potential conflicts of interest with respect to the research, authorship, and/or publication of this article.
Funding
The author(s) disclosed receipt of the following financial support for the research, authorship, and/or publication of this article: This project is supported by the Malaysian government and Universiti Teknologi MARA through scholarship funding. This project was also supported financially by the New Zealand Dental Research Foundation (RF8.15 2020). We appreciate the support of the Sir John Walsh Research Institute, Faculty of Dentistry, University of Otago.
Informed consent statement
Informed consent was obtained from all subjects involved in the study.
Institutional review board statement
The study was conducted according to the guidelines of the Declaration of Helsinki and approved by the University of Otago Human Ethics Committee (Health) (approval number H19/057) (or Ethics Committee).