
Abstract
Background
One of the hardest tasks in developing or selecting grafts for bone substitution surgery or tissue engineering is to match the structural and mechanical properties of tissue at the recipient site, because of the large variability of tissue properties with anatomical site, sex, age and health conditions of the patient undergoing implantation. We investigated the feasibility of defining a quantitative bone structural similarity score based on differences in the structural properties of synthetic grafts and bone tissue.
Methods
Two biocompatible hydroxyapatite porous scaffolds with different nominal pore sizes were compared with trabecular bone tissues from equine humerus and femur. Images of samples’ structures were acquired by high-resolution micro-computed tomography and analyzed to estimate porosity, pore size distribution and interconnectivity, specific surface area, connectivity density and degree of anisotropy. Young's modulus and stress at break were measured by compression tests. Structural similarity distances between sample pairs were defined based on scaled and weighted differences of the measured properties. Their feasibility was investigated for scoring structural similarity between considered scaffolds or bone tissues.
Results
Manhattan distances and Quadrance generally showed sound and consistent similarities between sample pairs, more clearly than simple statistical comparison and with discriminating capacity similar to image-based scores to assess progression of pathologies affecting bone structure.
Conclusions
The results suggest that a quantitative and objective bone structural similarity score may be defined to help biomaterials scientists fabricate, and surgeons select, the graft or scaffold best mimicking the structure of a given bone tissue.
Introduction
Bone grafting procedures are becoming a serious burden for health care systems and insurance companies, as testified by the ca. US$2.5 billion paid annually for the 1.5 million bone graft procedures performed in the United States alone (1). Scarcity of bone substitutes and morbidity at the implant site increase costs and worsen quality of life for patients. In practice, autologous bone grafting, the gold standard for bone replacement surgery, is limited by the scarce availability of bone and morbidities at donor sites (2), whereas the use of bone bank allografts is limited by disease transmission and poor osteoinductivity (3). Alternatively, grafts made of metals, ceramics and polymers may be used, but the lack of biochemical cues and osteogenic cells makes them poorly osteoconductive and osteogenic, and limits their osteointegration (4). Resorbable porous scaffolds functionalized with biochemical cues and engineered with patients’ osteogenic cells hold promise to repair large bone defects, but have not proven their clinical efficacy yet (5). The unsatisfactory outcome of current treatments suggests that there is room for improving the selection criteria for, and even the properties of, artificial grafts and scaffolds. The biochemical and chemical properties of grafts or scaffolds for bone tissue engineering (BTE) are known to strongly affect their interactions with cells and integration with the surrounding tissues (6). However, clinical success of implanted grafts is also largely dependent on their structure and mechanical properties, particularly for the replacement of heavy load-bearing bones such as the femur (7). In fact, grafts and scaffolds with similar trabecular architecture (e.g., the connections and alignment of trabeculae) and mechanical behavior to the bone tissue they have to replace are expected to integrate well with the patient's mechanical response to environmental challenges right after implantation (7). Grafts and scaffolds with a large fraction of open and interconnected pores and a large pore surface area are also expected to favor cell migration and colonization and to integrate well with the surrounding tissues. In tissue engineering, there is a general consensus on the importance of having large pores in the scaffold to enable cell migration into the scaffold, and small pores to supply nutrients and biochemical cues to cells anywhere in the scaffold (8).
One of the hardest tasks in developing or selecting the graft (or scaffold) for direct substitution, or tissue engineering, of a specific bone piece is possibly to match the structural and mechanical properties of tissue at the recipient site (9). The first challenge is to characterize quickly, reliably and nondestructively the specific bone that needs to be replaced, because of the large variability of tissue properties with anatomical site, sex, age and general health conditions of the patient undergoing implantation (10–11–12). The second challenge is to develop quantitative and objective criteria to compare the structure of natural bone tissue and artificial substitutes. Today, state-of-the-art imaging and postprocessing techniques permit the gathering of accurate quantitative information about grafts, scaffolds and tissue structure nondestructively and noninvasively, and make it possible to quickly characterize natural bone tissues in vivo (13). Bone imaging techniques are already used in clinics to monitor bone structure and assess the occurrence and progression of bone pathologies. To ease the assessment of pathological states, an overall score has recently been introduced, termed the trabecular bone score (TBS), that evaluates gray-level pixel variations in 2-dimensional (2D) dual-energy X-ray absorptiometry images of the bone providing information on its 3-dimensional (3D) bone trabecular architecture (14). The TBS correlates well with histological section analysis and eases diagnosis and prognosis with little discomfort to patients (14). In contrast, so far little work has been done to exploit the possibilities of imaging techniques and compare natural and artificial bone structures on quantitative and objective grounds. To the best of the authors’ knowledge, only one score has been proposed to evaluate structural and mechanical properties of real scaffolds against ideal expectations for BTE scaffolds in the repair of a segmental defect of the diaphysis of a 70-kg patient's tibia (15). No objective and quantitative score has been proposed yet for comparing the structure of an artificial graft (or scaffold) with the specific bone tissue that it should replace.
This study aimed at investigating the feasibility of developing a quantitative bone structural similarity score (BoSS) useful for comparing the structure of artificial grafts, or scaffolds, with one another and with bone tissues. The use of the BoSS could allow for a preliminary screening of available graft or scaffold structures to better match the specific bone to be replaced. It could also guide graft or scaffold fabrication to match natural bone tissues. For this purpose, the structural and mechanical properties of 2 commercial hydroxyapatite (HA) scaffolds with different nominal pore sizes were characterized, as was trabecular bone tissue harvested from equine humerus and femur. As a proof of principle, a minimal number of 8 independent properties were selected to characterize the sample structure. Sample images were acquired nondestructively by high-resolution micro-computed tomography (µCT), and analyzed with state-of-the-art computational techniques to estimate porosity, pore size distribution and interconnectivity, specific surface area, connectivity density and degree of anisotropy. Young's modulus and stress at break were characterized by compression tests. Structural distances between each pair of samples were defined that account for the difference of all measured properties, and were investigated as possible criteria for demonstrating structural similarities between sample pairs, hence as BoSS. The Manhattan distances and Quadrance showed similarities (vs. dissimilarities) between sample pairs more clearly than did simple statistical comparison, with a discriminating capacity similar to that of the TBS. This suggests that a quantitative bone structural similarity score may be developed to help biomaterials scientists fabricate, and surgeons select, biomimetic grafts or scaffolds matching the structure of a given bone tissue.
Materials and Methods
Equine trabecular bone conserving the type I collagen component and harvested from horse humerus (EHT; Osteoplant®, OMC50b) and femur (EFT; Osteoplant®, OSP01) was kindly provided by Bioteck (Arcugnano VI, Italy). Commercial porous sintered HA scaffolds (EngiPore™, PFS015005-23-00) with either an open pore (OPHA) or a narrow pore (NPHA) structure were kindly provided by Finceramica (Faenza, Italy). Cylindrical specimens, 10-mm diameter and 10-mm length, were obtained from each sample by core-cutting with a diamond core drill, and their structural and mechanical properties were characterized as described below. All measurements were performed in triplicate (i.e. n = 3).
Structure characterization
High-resolution µCT images of sample structures were acquired with a SkyScan 1174 (Microphotonics Inc., Allentown, PA, USA) operated at 50-kV source voltage, 800-µA current and a sample-to-detector distance of 40 mm. To exclude any region near the boundaries possibly altered by the core-cutting procedure, a cylindrical volume of interest (VOI) of 7-mm height and 9-mm diameter was selected at the center of each sample. The voxel (i.e., the volume element) size was typically ≤9.23 × 9.23 × 9.23 µm, depending on the exposure time per projection and the filters used. Images of layers perpendicular to the sample axis were reconstructed from raw µCT data through the standard filtered backprojection algorithm (16) with the software N-Recon and CT-Vox (Microphotonics Inc., Allentown, PA, USA). Solid material pixels were separated from void pixels based on their gray-scale value (i.e., were segmented) with a lower 80-99 gray threshold, and an upper 255 gray threshold. A binary 3D representation of the structure of the VOI (i.e., image rendering) was obtained from the 2D layers with CT-An software (Bruker, Billerica, MA, USA), More detailed information may be found elsewhere (8, 17–18–19). The structural properties of the samples were estimated with the same software as briefly described below.
Porosity (ε)
Scaffold porosity is defined as the fractional sample volume occupied by void spaces (i.e., pores). In this study, the porosity ε was estimated as follows:

where Po.V is the volume of the void pores and TV is the total volume of the scaffold (20). The porosity was estimated as the ratio between the number of void and total voxels in each sample.
Pore size distribution (f(dp))
The pore size distribution of a scaffold is defined as the fractional number of pores with size found within a set interval (or class). In this study, any group of void voxels surrounded by solid voxels was considered a pore. The pore size distribution was calculated according to a model-independent 2-step procedure. Firstly, the medial axis of all void structures was identified (i.e., skeletonization). Secondly, a “sphere-fitting” measurement was made for all of the voxels lying along each axis. The local size associated to a point on each axis was defined as the average diameter of the spheres which fulfilled the following 2 conditions: the sphere enclosed the point, but the point was not necessarily the center of the sphere; the sphere was entirely enclosed in the void structure, but it was entirely bounded within the solid surfaces. The local sizes of void structures thus obtained were distributed into classes by counting the fractional number of local sizes falling in each class. The size range of each class was set equal to twice the size of the voxel of the considered µCT scan.
Pore interconnectivity (Ip)
Pore interconnectivity is defined as the fraction of the void volume in a scaffold that is accessible from the outer surface (21). In this study, pore interconnectivity was expressed as follows (21):

where Po.O is the ratio of the open pore volume to the VOI, and εis the porosity defined in Equation [1]. Po.O was estimated as the complement to one of the percentage closed porosity. A closed pore is a connected assemblage of void voxels that, in 3D, is fully surrounded on all sides by solid voxels. Percentage closed porosity is the volume of closed pores as a percentage of the VOI.
Specific surface area (av)
The specific surface area measures the solid surface area available for cell attachment and tissue deposition per unit scaffold volume. In this study, av was calculated as follows:

where BS is the sample solid surface measured on the basis on the faceted surface of the marching cubes volume model (22) and TV is the total number of voxels in the VOI.
Connectivity density (β)
The connectivity, Eu.Conn, characterizes the redundancy of trabecular connections and thus the degree to which parts of the sample are multiply connected. It is derived from the Euler characteristic, EC, which accounts for the number of cavities surrounded by solid material. Description of the evaluation of EC from binarized images is beyond the scope of this work, and details can be found elsewhere (23). The connectivity of each sample was calculated as:

and provided a measure of the number of connections that must be severed to break the structure down into 2 separate parts (18). To characterize sample structure independent of its size, the connectivity is generally normalized with respect to the sample volume in terms of the connectivity density, β, as follows (18):

where Eu.Conn is the connectivity of the sample, and TV is its total volume.
Degree of anisotropy
The degree of anisotropy, DA, is a measure of the preferential alignment of solid struts in the scaffold along particular directions. In this study, the DA was estimated according to the mean intercept length (MIL) analysis. The MIL is found by sending a line through a 3D image volume containing binarized objects at any 3D orientation, and by dividing the length of the test line through the VOI by the number of times that the line passes through, or intercepts part of, the solid material in any direction. The MIL distribution is calculated by superimposing parallel test lines in different directions on the 3D image. The MIL ellipsoid is calculated by fitting the directional MIL to a directed ellipsoid using a least-square fit. The geometrical degree of anisotropy, DA, is calculated as the complement to one of the ratio between the minimal and the maximal radius of the MIL ellipsoid. Detailed description of the analysis is beyond the scope of this work, but may be found in (18). A DA value of 0 indicates overall scaffold or tissue isotropy. A DA value of 1 indicates overall scaffold or tissue anisotropy.
Mechanical characterization
The mechanical properties of samples were characterized with uniaxial unconstrained compressive tests (24, 25) performed along the axis of the cylindrical specimen with an MTS QTest Elite 10 compression test machine (MTS Systems Corp., Eden Prairie, MN, USA) equipped with an MTS Load Cell, model S-beam, with a 500-N force cell and 2.09 mV/V sensitivity (MTS Systems Corp., Eden Prairie, MN, USA). Tests were performed without preconditioning, at room temperature in air, by lowering the compression bar at 5 mm/min, and by sampling data at 5 Hz. The mechanical properties reported hereafter were estimated as briefly described below.
Compressive Young's modulus (Ec)
The Young's modulus, Ec, measures the elastic mechanical response of the sample to small challenges. Scaffolds with Ec close to the specific bone they have to replace may be expected to provide for an elastic mechanical response mimicking that of the missing bone right after implantation (15). Ec was estimated from the experimental stress-strain curves as the limit to null strain of the uniaxial compressive stress to strain ratio.
Ultimate compressive strength (σB)
The ultimate compressive strength, σB, is the value of the uniaxial compressive stress at which the scaffold breaks. It provides for a measure of the maximal load that the scaffold tolerates without breaking. σB was estimated from the experimental stress-strain curve of each scaffold at the conditions under which the sample broke.
Statistical analysis
Data are reported as means ± standard deviation. Prior to performing the statistical analysis, the Gaussian distribution of data was verified with the Kolmogorov-Smirnov test (26). Statistical significance of differences was determined with Student's t-test with significance set at a p value of <0.05. Statistical tests were performed with Microsoft Excel® software (Microsoft Corp., Seattle, WA, USA).
Pore size distribution was quantitatively characterized in terms of its first 4 moments (27) – i.e., mean
Bone structural similarity score
In this study, the BoSS was intended as a multiparametric tool for comparing the structure of artificial bone substitutes with one another and with bone tissues. A pair of samples was assumed to be structurally similar when the structural distance between them was minimal. The distance between samples along each axis of the 8-dimensional space of the investigated sample properties (ε, Ip, av, β, DA, E, βB), di,h-k, was defined as the absolute difference of the i-th mean property value pi between the h-th and the k-th sample, as follows:

The difference of the pore size distributions f(dp) between the h-th and the k-th sample was accounted for in terms of the dissimilarity index, along the lines of what is suggested in White (29):
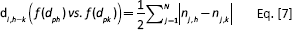
where nj,h and nj,k are the percentage of pores within the j-th class of the h-th and k-th sample, respectively, and N is the number of pore size intervals (or classes). The dissimilarity index ranges from 0 (fully segregated distributions) to 1 (coincident distributions).
With the exception of the pore size distribution, each property difference was scaled with respect to the experimental standard deviation of that property estimated over all the measurements performed, σi, as follows (30):
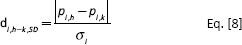
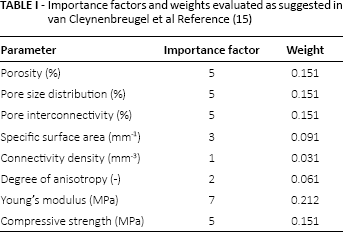
This permitted the minimizing of the bias caused by the different scales of some property values. As suggested by van Cleynenbreugel et al (15), the effect of weighting the property differences to account for the importance of the property for scaffold interactions with cells and tissues was also investigated. As a proof of concept, the importance factor assigned to each property was set as equal to the value suggested in van Cleynenbreugel et al (15). In this investigation, fewer sample properties were characterized and compared than in van Cleynenbreugel et al (15). For this reason, the weight associated to the i-th property, wi, was obtained by normalizing the corresponding importance factor with respect to the sum of factors over all investigated properties and by making them sum up to 1, as shown in Table I. When the weightings were used, the local difference of the i-th property between the h-th and k-th sample could be expressed as follows:
Importance factors and weights evaluated as suggested in van Cleynenbreugel et al Reference (15)
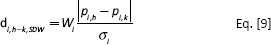
The weighted difference of the pore size distributions between sample pairs was estimated as follows:
Two structural distances were defined that could be used as BoSS. They accounted, each to a different extent, for the differences of the 8 investigated properties. These are the Manhattan distance and the Quadrance. The Manhattan distance, MD, is defined as the sum of the scaled/weighted property differences, as follows (31):

The Quadrance, Q, is defined as the sum of the squared scaled/weighted property differences, as follows (32):

Hereafter, the subscripts SD or SDW are used for the above distances to indicate that the property differences were scaled only, or were also weighted, respectively.
The BoSS criterion compares 2 samples at a time, and is based on the assumption that the shorter the structural distance between the 2 samples, the more similar is their structure. The discriminating capacity of each considered structural distance was evaluated as the ratio of the difference between the maximal and the minimal structural distance values to the minimal, for the samples considered in this study. The feasibility of the definitions of structural distance investigated in this study for serving as BoSS was evaluated with respect to the absolute value of the structural distance they bring (i.e., the lower, the more feasible the distance definition is) and their discriminating capacity (i.e., the efficacy with which the considered structural distances discriminate between sample pairs). Their discriminating capacity was also compared to that of the TBS, the only score currently used in clinics for assessing the changes of bone tissue structure caused by pathological states (14, 33).
For the sake of comparison, the similarity of samples to the ideal scaffold for a bioengineered diaphyseal bone of the tibia was also evaluated in terms of the total score ScV, estimated as proposed by van Cleynenbreugel et al (15). Briefly, a score ranging from 0 to 10 was assigned to each measured property. Its value was obtained by dividing the value of the property of the samples by that assigned to the ideal scaffold, and by normalizing this value to 10. As done in the work by van Cleynenbreugel et al (15), ideal values or limits to admissible values of the considered properties were set as equal to the average values (for av and β) or the lower and upper values (for Ec and σB) experimentally measured for cancellous bone of human tibial condyles. Consequently, the score assigned to the specific surface area was set as equal to 10 for av in excess of 3.95 mm-1, that for the connectivity density, β, was set as equal to 0 for β values higher than 6 mm-3, that for the Young's modulus, Ec, was set as equal to 0 when Ec was outside the 24,500-34,300 MPa range, and that for the ultimate compressive strength, σB, was set equal to 0 when σB was outside the 183-213 MPa range (10).
The score for the pore size distribution was evaluated as the percentage number of pores with size from 100 to 800 µm scaled to 10. In fact, it is generally accepted that 100 mm is the minimal pore size for osteoconduction, and 800 mm is the maximal admissible pore size to prevent weakening of scaffold mechanical properties (15). In van Cleynenbreugel et al (15), ideal scaffolds are assumed to be isotropic, and isotropy is assumed to be a valuable property rather than anisotropy, as done in this study. For this reason, the associated score was evaluated as (1-DA) and normalized to 10. Each score was multiplied by its associated weight, as reported in Table I, and a total score, SvC, ranging from 0 to 10 was obtained as the sum of all weighted scores. SvC = 0 indicates a completely nonideal sample, whereas SvC = 10 indicates a completely ideal sample. The higher SvC is, the more similar the scaffold structure to the ideal scaffold.
Results
Figure 1 shows the rendered digital 3D images of exemplary microstructures of the samples investigated. The samples generally exhibited consistent properties which were in agreement with the literature data, as shown in Figures 2 and 3. Figure 2A and B shows that all samples exhibited a porosity greater than 60% and very high levels of pore interconnectivity. Figure 2C shows that the specific surface area varied by a factor of 2.5, from about 4 to 10 mm-1. The narrow pore HA scaffold (NPHA) exhibited a connectivity density close to 100 mm-3, about 1 order of magnitude higher than the other tested samples, as shown in Figure 2D. Figure 2E shows that both equine trabecular tissues exhibited a degree of anisotropy an order of magnitude higher than the 2 porous HA scaffolds.
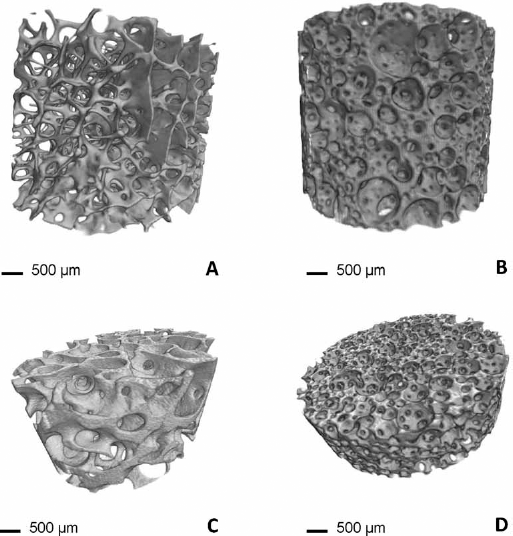
3D rendering of exemplary sample digital images acquired by micro-computed tomography (µCT):
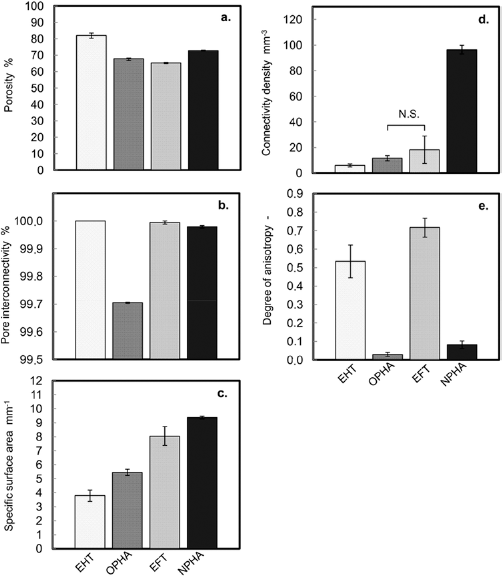
Sample properties estimated by micro-computed tomography (µCT) imaging:
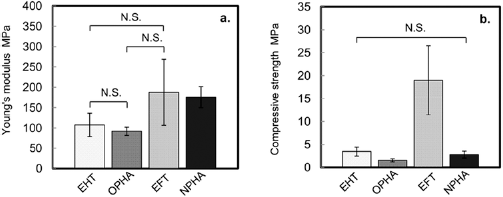
Sample properties estimated by compression tests:
The compressive Young's modulus varied by a factor of 2, from about 100 to 200 MPa, as shown in Figure 3A. Figure 3B shows that the equine femur trabecular tissue exhibited an ultimate compressive strength about an order of magnitude higher than the other samples. In spite of apparent similarities, data analysis revealed that property differences between all sample pairs were statistically significant for 5 to 7 out of the 7 investigated properties shown in Figures 2 and 3.
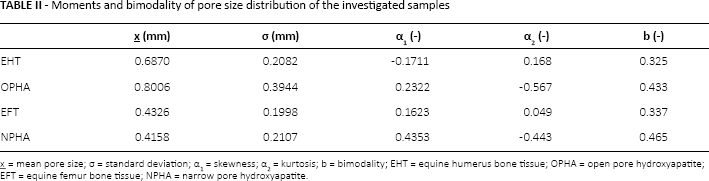
The pore size distributions of the investigated samples are shown in Figure 4, and the values of their first 4 moments and bimodality are reported in Table II. Figure 4 shows that none of the investigated samples exhibited a clear bimodal pore size distribution, as confirmed by the fact that the values of the bimodality b in Table II are all b<0.555 (27). Figure 4A and the smallest skewness in Table II suggest that the equine humerus tissue (EHT) exhibited the greatest symmetrical pore size distribution, albeit slightly skewed toward pores of smaller size, as indicated by its negative skewness. Figure 4A–D and the highest kurtosis values in Table II indicate that the pore size distributions of both equine trabecular tissues exhibited higher peak values than the artificial HA scaffolds, and a larger fraction of pores with size close to the mean pore size. However, Table II shows that EHT exhibited a mean pore size about 1.6 times larger than the equine femur tissue (EFT). Only EHT and the open pore HA scaffold (OPHA) featured pores with sizes greater than 980 µm. Figure 4B and the highest standard deviation and the lowest kurtosis value reported in Table II indicate that OPHA featured the broadest and flattest pore size distribution.
Moments and bimodality of pore size distribution of the investigated samples
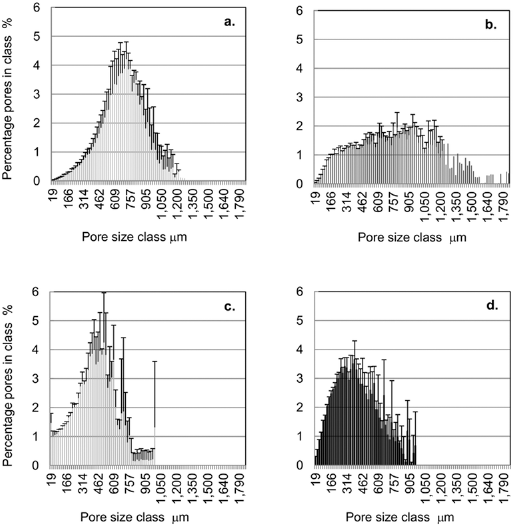
Pore size distribution of the investigated samples:
Table III shows the structural distances between each sample pair estimated in terms of the Manhattan distance, MD, and the Quadrance, Q, either scaled to minimize the bias caused by different property scales (MDSD, QSD) or scaled and weighted for their importance (MDSDW, QSDW). Table III shows that the Manhattan distance, MDSD, generally yielded shorter structural distances than the Quadrance, QSD. However, the Quadrance exhibited a discriminating capacity that was slightly higher (i.e., 44% vs. 34%). Table III also shows that when the property differences were also weighted to account for their importance, both definitions yielded structural distances about an order of magnitude lower than when properties were only scaled. In particular, the weighted Quadrance, QSDW, yielded structural distances about a third of the Manhattan distance, MDSDW. Weighting the property differences enhanced the discriminating capacity of the structural distances at least twofold, and made the weighted Manhattan distance slightly more discriminating than the weighted Quadrance (77% vs. 74%). Independent of the definition of the structural distance, and of the use of scaling and weighting factors, Table III suggests that the structure of the equine trabecular bone tissue was consistently different for different harvesting sites (i.e., femur vs. humerus). Different structural distances were consistently obtained also for the 2 artificial scaffolds. Table III shows that when the property differences were only scaled, the minimal structural distances MDSD and QSD were consistently obtained for the EFT/NPHA and EHT/OPHA pairs. This suggests that a structural similarity exists between equine femur bone and the narrow pore HA (i.e. samples EFT and NPHA), and between equine humerus bone and the open pore HA (i.e., samples EHT and OPHA). Table III shows that when the property differences were scaled and weighted, the minimal similarity distances MDSDW and QSDW were consistently obtained for the EFT/NPHA pair, thus confirming the similarity of these sample structures shown when the property differences were only scaled. The second minimal structural distance was exhibited by the EHT/NPHA pair, although its value was only slightly shorter than that of the EHT/OPHA pair.
Structural distances between sample pairs assessed according to Manhattan distance (MD) or Quadrance (Q)
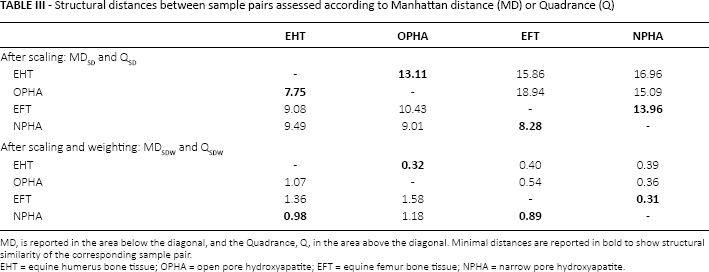
MD, is reported in the area below the diagonal, and the Quadrance, Q, in the area above the diagonal. Minimal distances are reported in bold to show structural similarity of the corresponding sample pair.
EHT = equine humerus bone tissue; OPHA = open pore hydroxyapatite; EFT = equine femur bone tissue; NPHA = narrow pore hydroxyapatite.
In Table IV, the sample scores, SvC, are reported when samples are evaluated with respect to the requirements of a scaffold assumed to be ideal for BTE according to the scoring procedure and the weights suggested in van Cleynenbreugel et al (15). Table IV shows that NPHA is structurally closest to the ideal requirements, whereas the scores of the 2 equine trabecular bone tissues suggests that their structures approximate the ideal scaffold to the same extent.
Weighted and total score (SvC) of each sample
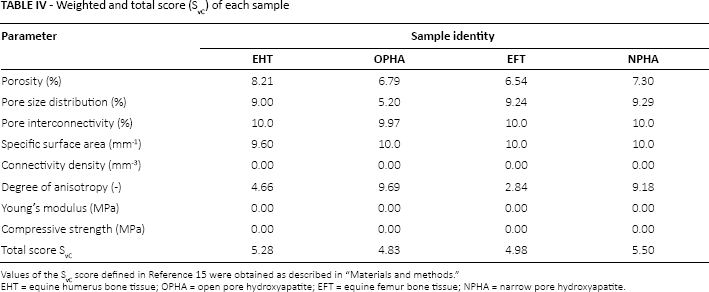
Values of the SvC score defined in Reference 15 were obtained as described in “Materials and methods.”
EHT = equine humerus bone tissue; OPHA = open pore hydroxyapatite; EFT = equine femur bone tissue; NPHA = narrow pore hydroxyapatite.
Discussion and conclusions
Medical imaging techniques such as µCT and nuclear magnetic resonance are currently used to guide the fabrication of grafts and scaffolds that match the volume and macroscopic anatomical shape of the bone piece that needs to be replaced. However, the innovative fabrication techniques that have been introduced in recent years have mainly been used to develop scaffolds (or grafts) with ordered, mostly single-pore, architectures balancing the desired mechanical function and the transport properties enabling biofactor delivery to cells (34). This has advanced our understanding of how the structure of porous scaffolds harnesses the body's healing response, but it has not led to optimal, or even satisfactory, treatments yet (35). Research performed in the last decade has provided, and is still providing, evidence of the important role played by scaffold microscale to nanoscale structure and its mechanical properties, regarding the response of cells and tissue, prior to and after implantation. Structure and mechanical properties of the cellular microenvironment may influence cell proliferation, differentiation and death, play a role in the morphogenesis of some tissues and may even influence the functioning of the immune system of the host (36). In spite of these studies, much is still to be elucidated about the mechanisms of how scaffold structural and mechanical properties – and their interplay with scaffold biochemical and chemical properties, affect graft integration and tissue regeneration. It is generally envisioned that grafts and tissue engineering scaffolds mimicking the natural bone structure hold the greatest promise of success for repairing bone tissue, restoring mechanical function and enabling tissue integration (37).
The aim of this study was to investigate the feasibility of defining a quantitative bone structural similarity score to help select the most suitable scaffold or personalize its design to match the structure of a given bone tissue, thus favoring a successful bone replacement procedure. In spite of the large amount of information on the physical-mechanical properties of synthetic grafts and tissue engineering scaffolds (8), and on their interactions with cells and tissues (38), to the best of the authors’ knowledge, so far only van Cleynenbreugel et al (15) have attempted to define a quantitative score to evaluate scaffold structure and to guide the design of bone grafts or the engineering of a biological bone substitute. In their approach, the scaffold structural properties were scored and weighted somewhat arbitrarily against requirements assumed ideal for BTE scaffolds for the reduction of a diaphyseal defect of the tibia.
In this study, it was assumed that the multiparametric characterization of independent scaffold and tissue structural properties could represent a sound basis for developing a quantitative BoSS to enable the objective evaluation of the extent to which graft or scaffold structure matches the bone that they have to replace. Eight independent sample properties were selected which determine, or are relevant to, its structural and mechanical properties and its capacity to transport nutrients and metabolites to cells and to interact with cells and tissue. For the proof of concept, they were thought of as representing the minimal number of properties to characterize graft or scaffold structure. In particular, high scaffold porosities are generally desirable because they have been shown to promote in vitro the proliferation of osteoblasts and stem cells, and in vivo the recruitment and penetration of osteogenic cells from the surrounding bone tissue and scaffold neovascularization (8). However, too high a porosity may weaken the scaffold's mechanical resistance and may compromise its structural integrity when implanted (8). Pore size distribution influences cell migration and proliferation and the transport of nutrients to (and waste metabolites away from) cells in vitro, and tissue in-growth in vivo (8, 39).
There is general agreement that an ideal scaffold for tissue engineering should exhibit a bimodal pore size distribution with pores from ca. 100 to 800 µm, which should permit osteogenic cells to migrate and proliferate into the scaffold, and pores smaller than ca. 10 µm, which should enable the physiological supply of nutrients and metabolic cues to (and waste metabolites away from) osteogenic cells (8). However, experimental evidence suggests that the optimal pore size distribution depends on the cell type (and size) and the application. In fact, it has been reported that there is an optimum pore size range of 5-15 µm for fibroblast in-growth, of 40-100 µm for osteoid in-growth and of 100-300 µm for bone regeneration (40).
A high pore interconnectivity is key to cell migration, oxygen and nutrients transport, waste product disposal, new blood vessel formation and tissue in-growth (41). Increasingly interconnected pores have been shown to improve chondrocyte proliferation and metabolic activity in chitosan sponges (42), and chondrocyte attachment and proliferation in porous poly(lactic-co-glycolic acid) (PLGA) scaffolds (43). Higher specific surface areas have been shown to foster cell attachment and osteoblast proliferation (44). Higher connectivity density has been related to better bone mechanical performance (45). The degree of anisotropy of trabecular bone is a determinant of its mechanical strength (18). Graft or scaffold anisotropy affects migration, shape and alignment of fibrosarcoma (46) and breast carcinoma cells (47) and even the production of extracellular matrix by human fibroblasts (48). On their part, the mechanical properties of grafts or scaffolds may modulate the host response at macroscopic and cellular levels. In fact, the mismatch in mechanical properties of the graft and the periimplant bone may cause graft failure for stress-shielding (49).
The scaffold Young's modulus has even been shown to influence the rate and the extent to which bone tissue forms within a scaffold (50). In tissue engineering, stiffer scaffolds have been shown to promote adhesion, spreading and proliferation of mesenchymal stem cells, fibroblasts and endothelial cells (51, 52). Engler et al (53) demonstrated that mesenchymal stem cells cultured on polyacrylamide gels could differentiate themselves into neurons, myoblasts and osteoblasts on increasingly stiffer gels.
The selected properties were characterized for 2 exemplary natural bone tissues and synthetic artificial scaffolds differing in their physiologic function or preparation procedure. For the proof of concept, equine tissue was used because large mammals are good preclinical models of human therapies and may benefit themselves from a biomimetic personalized BTE approach. Two structural distances, based on the intersample differences of such properties, were investigated for their capacity to measure structural similarities and to discriminate between sample pairs as a qualifying criterion to serve as a BoSS.
For the possible use in clinics of a quantitative scaffold selection criterion, such as the BoSS, it is required that the properties of the tissue that needs to be replaced (and its man-made substitute) be consistently, quickly and noninvasively characterized. For this reason, 6 out of the 8 investigated properties were noninvasively and nondestructively characterized by high-resolution µCT. In the clinical setting, it may be envisioned that the mechanical properties of the patient's bone tissue may also be estimated from its structural properties as characterized by µCT by means of available empirical correlations linking mechanical properties of a given bone to its structure (54) or by finite-element modeling (15, 55), once the average mechanical properties of the trabecular tissue of a given bone are known (56). Figures 2 and 3 show that the characterization procedure yielded scaffold and tissue property estimates in agreement with those reported in the literature for similar scaffolds and tissues (8, 15, 25, 52, 54, 57–58–59–60), which were also consistent with one another. In fact, samples made of the same material with lower porosity and higher connectivity density exhibited better mechanical performance (24, 54). Samples with narrower pore sizes exhibited higher specific surface area (61) and connectivity density (62). Both natural bone tissues exhibited higher degrees of anisotropy than the artificial scaffolds (25).
Figure 4A–D shows that while all samples exhibited a large fraction of large size pores, only EFT exhibited a second, although very small, fraction of small pores around 10 µm in size. This is inconsistent with what is often required in porous scaffolds for BTE (8), but it is consistent with what is obtained for similar tissues and scaffolds to those used in this study, with higher resolution porosimetric techniques, not suitable for a clinical setting because they are too invasive, expensive or not yet available for clinical use (63).
It could be argued that the resolution of the µCT used for this study was limited to 9.23 µm. However, based on literature information, the pore fraction with sizes below that detected by the µCT may be predicted to be less than 1.3% for bone tissue (63) and less than 0.7% for HA scaffolds (64), thus causing negligible bias in the characterization of the pore size distribution. The introduction in clinics of imaging techniques of higher resolution – e.g., nanocomputed tomography – will definitely improve on the accuracy of the structural distance estimates and the reliability of the BoSS criterion, with no discomfort to patients.
The fact that all or most of the investigated properties were significantly different among the tested samples suggests that a pure statistical comparison does not effectively reveal similarities (or discriminate) between scaffold and/or tissue pairs.
On the contrary, the capacity of the investigated structural distances to measure structural similarity and discriminate between sample pairs was comparable to, or even better than, that of the TBS. Consistent with their definition of distance, MD and Q are not limited in the value they may have, in contrast to the TBS. Nonetheless, QSDW and MDSDW yielded structural distance values comparable to TBS values for human bone tissue (14, 33). Studies on human cadaver vertebrae report discriminating capacities of the TBS up to 43% (33). However, a 17% discriminating capacity has been reported to suffice to discriminate between well-structured and altered trabecular bone tissue (14). The discriminating capacity of the structural distances investigated in this study was in the upper range of the TBS when the property differences were only scaled (i.e., MDSD and QSD), and was about 2 times higher when the property differences were scaled and weighted (i.e., MDSDW and QSDW). Table III shows that all distances, independent of the scaling and weighting, consistently demonstrated that the 2 natural equine bone tissues exhibit different structures. This is consistent with their different anatomical sites and physiological functions in equines. Structural distances may be predicted to be even shorter, and discriminating capacity higher, when the structure of human bone tissues harvested from femur and humerus is compared, for the different physiological function that such bones perform in bipeds. All structural distances showed structural differences also between the 2 artificial HA scaffolds. This is consistent with that expected of scaffolds with mean pore size differing by a factor of 2, as shown in Table II. Table III shows that when the property differences were only scaled, both MDSD and QSD consistently showed the structural similarity of the narrow pore HA scaffold (NPHA) to the equine femur trabecular tissue (EFT), and of the open pore HA scaffold (OPHA) to the equine humerus trabecular tissue (EHT). Along the lines hinted at in van Cleynenbreugel et al (15), Table III suggests that weighting the property differences may effectively enhance the discriminating capacity of the investigated structural distances. However, Tables III and IV show the importance of defining objective criteria to estimate the actual values of the weights. Assigning the weights in an arbitrary fashion makes assessment of similarities dependent on operator skills and may even make the structural distance suggest inconsistent similarities. In fact, in Table III the QSDW values suggest the similarity of NPHA to both EFT and EHT, although the same values clearly suggest that the 2 equine bone tissues are significantly different from a structure point of view.
Taken all together, the results obtained in this study suggest that it is possible to define an objective and quantitative BoSS that permits the demonstration of similarities and discriminates between given bone tissues and artificial scaffolds, and that may guide scaffold selection or fabrication for grafting, in the clinical setting, or for the engineering of personalized biological bone substitutes in vitro. The short intersample distance, high discriminating capacity and resulting sound similarities shown in Table III seem to suggest that the scaled and weighted Quadrance, QSDW, holds promise as a BoSS. Part of this has to be related to the fact that the use of the weights effectively enhances the discriminating capacity of that distance. However, objective criteria would have to be developed to estimate the weights that most effectively bring into account the importance of any given property.
It should be noted that to prove the feasibility of defining a structural similarity score, only a few structural properties of scaffolds and tissues were considered. They were chosen as those clearly acknowledged to contribute to making a scaffold (or graft) similar to a given bone tissue and being independent of other properties. Although important to graft (or scaffold) and tissue behavior, some other properties (e.g., hydraulic permeability, trabecular thickness etc.) have not been explicitly accounted for, because they depend on, or may be gathered from, the considered properties. For instance, hydraulic permeability, a key feature for nutrients and oxygen transport, may be expected to be determined in the first approximation by porosity, pore size distribution and pore interconnectivity (20). Scaffold and tissue mechanical behavior was also characterized only in terms of Young's modulus and stress at break in uniaxial compressive tests, because they determine scaffolds’ and tissues’ capacity to sustain body weight, and the former has been shown to affect cell behavior (50–51–52). The availability in the literature of these property estimates for many artificial scaffolds, grafts and tissues also enabled the validation of the values that were measured against experimental estimates. However, the values of the degree of anisotropy shown in Figure 2E show that the considered scaffolds and tissues studied were not isotropic. This suggests that to account for their capacity to respond to real mechanical challenges, the structural similarity score would have to incorporate properties measuring how scaffolds or tissues respond also to torsion and bending – i.e., along other loading directions.
Another limit to the current BoSS definition is that no biochemical or chemical property was considered on the account of the proven biocompatibility and cytocompatibility and osteointegration capacity (65) of the HA scaffolds used. To permit a thorough comparison of scaffolds made of different biomaterials and to obtain information on how successfully a graft (or scaffold) might heal a bone defect, additional independent properties expressing their biocompatibility and cytocompatibility, their biodegradation kinetics (65), and capacity to interact with neighboring cells and tissues would have to be included in the score. This was beyond the scope of this preliminary study.
A systematic study of all measurable properties of available artificial grafts and scaffold and of bone tissues harvested from different anatomical sites of individuals varying by sex and age might permit a demonstration of those independent properties affecting their behavior to the greatest extent that should be included in the BoSS. Although theoretically possible, it is difficult to foresee that a structural similarity distance, such as a BoSS, between an artificial and a natural tissue would be null – i.e., that the 2 structures would be identical. A systematic study such as that prospected above might also permit the narrowing down of the range of values that the BoSS may practically have and defining a BoSS threshold below which an artificial scaffold or graft and a bone tissue might be considered structurally similar. In spite of the current limits and the work that still needs to be done, the results obtained thus far show that defining a BoSS is feasible and that it might help in the preliminary screening of available grafts or scaffolds, and to personalize and fine-tune graft or scaffold structural properties for the replacement of a given bone tissue. The BoSS could also help biomaterial designers exploit the possibility of fabricating scaffolds hierarchically structured as the natural bone from the nanoscale to the milliscale offered by innovative fabrication technologies such as solid free-form fabrication or bioplotting, as such or combined with more traditional techniques (34).
Footnotes
Acknowledgement
The authors wish to thank Dr. Paolo Giannoni (Department of Experimental Biology, University of Genova, Genova, Italy) for his invaluable comments on the manuscript.
Financial support: This study was cofunded by the Italian Ministry of Instruction and University (MIUR; project PRIN 2010, MIND). One of the authors (G.F.D.L.) is a recipient of an ARUE grant from the European Commission, assigned by Region Calabria.
Conflict of interest: The authors declare no competing financial interest.