
Abstract
This study explores the effect of using dental brushes with or without metacrylate-based modeling resins on long-term color stability and surface topographies of resin-based composites. This study examined the effects of two variables: (1) the type of brush used (Art brush, Micro-brush, or Mylar strip) and (2) the application of a modeling resin (applied or not applied). The specimens were artificially aged through 10,000 cycles of thermocycling and subsequently immersed in coffee for 30 days. Measurements of color and surface roughness were taken at baseline and after the aging, using a non-contact profilometer for surface roughness and a spectrophotometer for color. Data were analyzed using paired t-tests and one-way ANOVA. Resin-based composites smoothed with dental brushes or micro brushes without modeling resins exhibited lower color change (ΔE) than other groups. Paired t-tests revealed significant differences in average surface roughness (Ra) and valley depth (Rv) for each surfacing technique before and after aging (p ⩽ 0.01). The root means square average of the profile heights (Rq) significantly increased in the control and micro-brush groups (p ⩽ 0.01). In conclusion, the use of brushes in resin-based composites placement does not increase the susceptibility to staining. Instead, the inclusion of resin modeling contributes to discoloration over time.
Introduction
In the dynamic world of cosmetic dentistry, pursuing a perfect smile when using direct resin-based composites in the esthetic zone is often seen as a blend of art and science. To achieve outstanding esthetic results, dentists must expertly select the color of restorative materials and skillfully apply the resin-based composite, integrating art and science in their approach. 1 However, placing resin-based composites is a delicate process due to their low wettability and stickiness. 2 Placement errors, such as the lack of margination and polishing, can impact their mechanical properties, color stability, and surface characteristics. 3 Nevertheless, dental practitioners have devised several techniques to streamline this process and improve resin-based composite handling.4,5 Among the array of tools and techniques available to enhance esthetic outcomes, dental brushes stand out as a link between dentistry and art. 4
Dental brushes are invaluable in smoothing out the final layer of resin-based composites before curing.3,6 It is advisable to utilize dental brushes for the application of this layer in order to replicate the enamel surface texture and enhance the optical properties of the restoration. Ideally, the placement of this layer should start cervically and extend toward the incisal part of the tooth.3,6 They also provide precision and control for exact application and shaping, crucial for creating natural-looking surfaces, especially in cosmetic procedures. 7 These brushes ensure improved esthetics, enabling a refined finish that mimics natural teeth. Additionally, it reduces the time needed for finishing and polishing, thereby increasing efficiency in dental practices. 8
These brushes are often employed with methacrylate-based solutions, known as “wetting resin” or “ modeling resins.” 9 When resin-based composite brushes are soaked in modeling resins, they aid in the placement and shaping of the material, ensuring an ideal morphology and a smooth finish. 10 Modeling resins serve as lubricants to prevent composite materials from sticking to handheld dental tools, easing the shaping and smoothness of the last layer of resin-based composites before polymerization.9,11 The impact of the modeling resins on the bond and mechanical performance of resin-based composites has been the focus of investigations.9,11 Other studies seek to investigate the safety of these materials as certain additive substances found within their composition have shown to possess effects that can mimic estrogen and damage genetic material.12,13 Yet, the effect of these materials on the long-term color stability and surface roughness is not well known.
Hence, this study aimed to investigate the impact of using dental brushes, with and without adding methacrylate-based modeling resins, on the long-term color stability and roughness of resin-based composites after artificial aging. The central null hypothesis posited that there would be no significant difference in color change and surface topographies among resin-based composites treated with dental brushes alone and those treated with brushes in combination with modeling resins.
Methods
Study design and sample size calculation
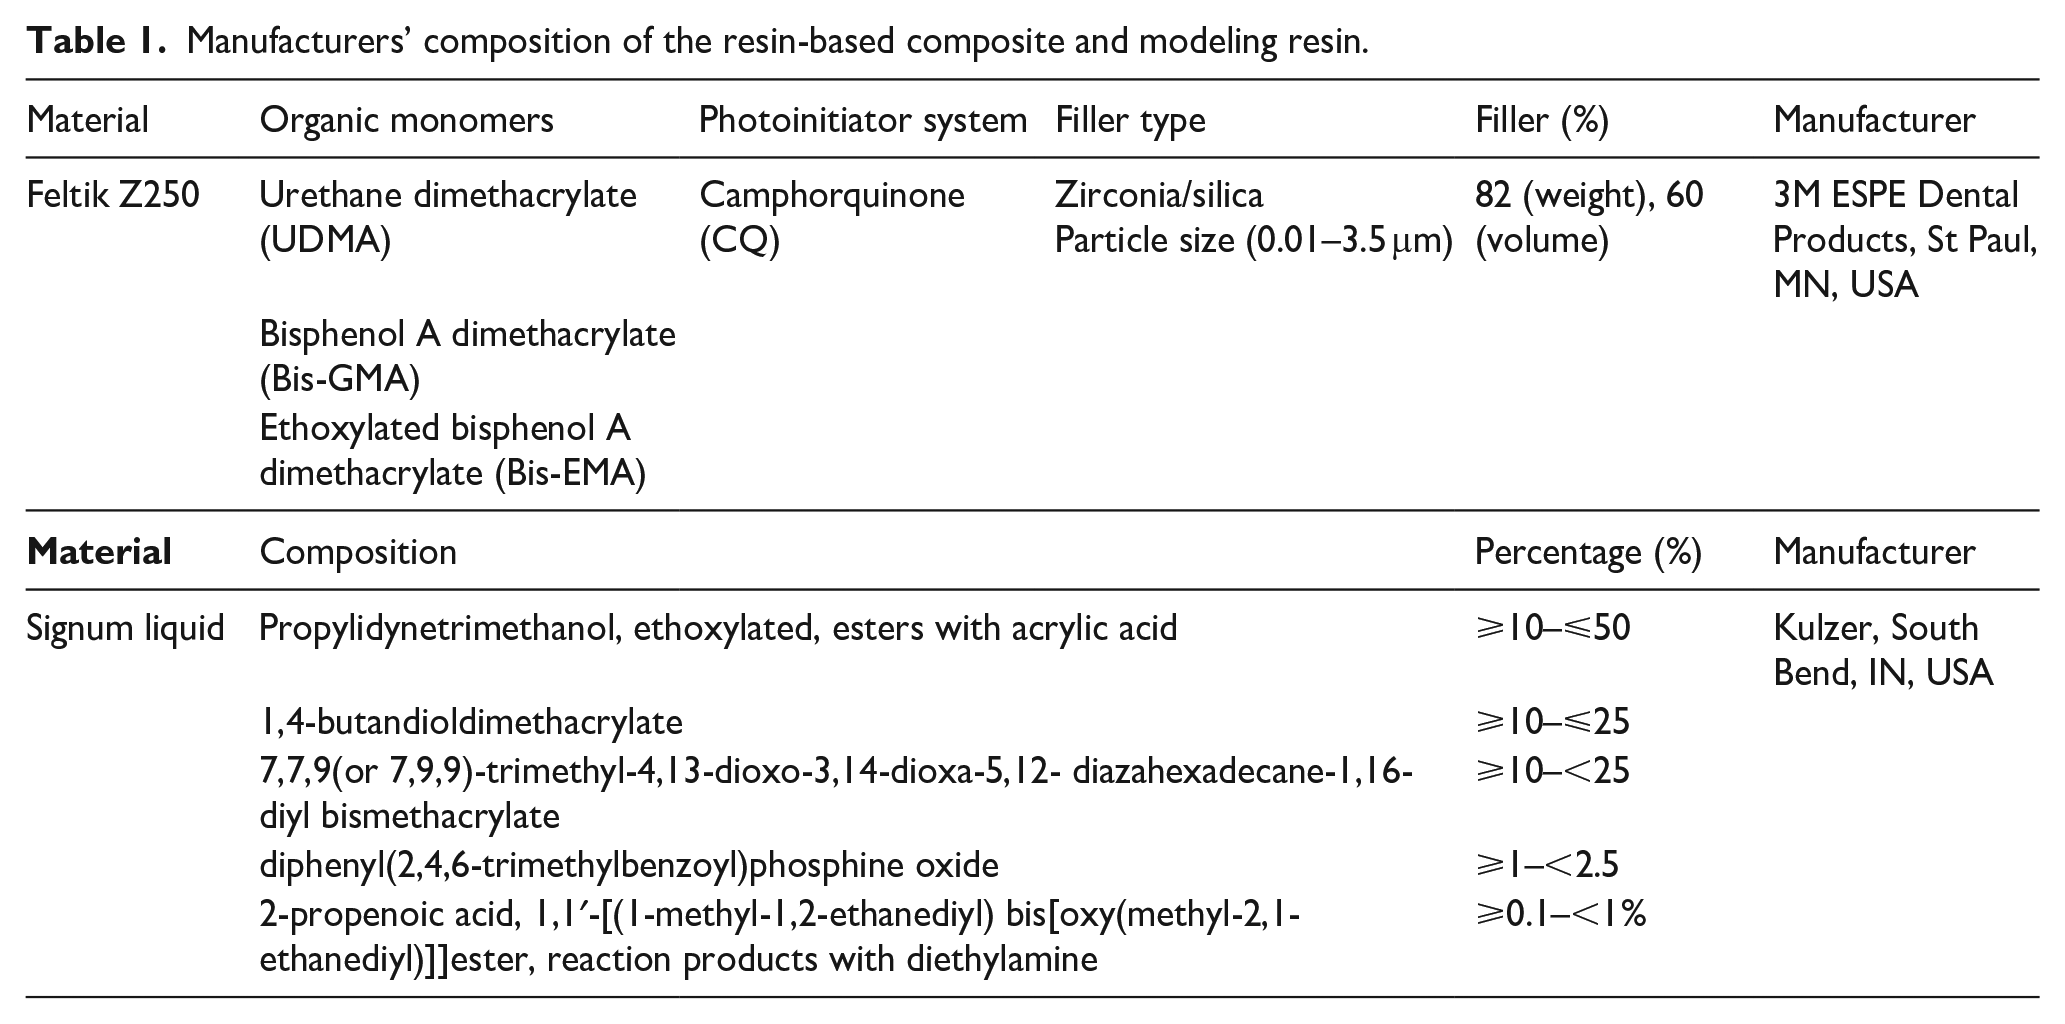
The study design included three main groups of resin-based composite (3M™ ESPE Filtek™ Z250, Maplewood, MN, USA) surfaced via three surfacing techniques: (1) mylar strip as a control, (2) micro-brush, and (3) art brush. The mylar strip control group was divided into two subgroups, polished and unpolished. The two experimental groups were divided into two subgroups, as the restorations were placed with or without modeling resin (Signum liquid, Kulzer, South Bend, IN, USA). The independent variables investigated were color change (ΔE00) and topography changes (Ra, Rq, and Rv), which were measured before and after thermocycling and immersion in coffee. The composition of the resin-based composite and modeling resin are presented in Table 1.
Manufacturers’ composition of the resin-based composite and modeling resin.
A priori sample size calculation was carried out using G*Power 3, a statistical tool for computing power analyses for a variety of statistical tests. This calculation to establish the sample size is necessary for a one-way ANOVA test comparing the groups’ mean scores. The significance level was set at p < 0.05. The results indicated a minimum required total sample size of 10 samples per group to detect large effect sizes (f = 0.4). Power will be set at 80%.
Sample preparation
The resin-based composite restorations were prepared in a circular Teflon mold (10 mm diameter and thickness of 2 mm) with a mylar strip at the bottom of the samples (n = 10/group). The top surface was surfaced and flattened using either (1) mylar strip, (2) micro-brush, or (3) art brush. The resin-based composites were then cured (quartz-tungsten-halogen (QTH), Ivoclar Vivadent LEDition, Schaan, Liechtenstein) from the two sides for 30 s per side. The mylar strip group was either polished or unpolished. Each was placed with or without modeling resin for the micro-brush and art brush groups. When the resin-based composite is placed using a micro-brush and art brush, finishing and polishing procedures are achieved following the restoration placement. Therefore, all the micro-brush and art brush groups were polished, and no group was kept unpolished. The polishing protocol involved the use of coarse, medium, and soft disks (3M™ Sof-Lex™ Extra-Thin Contouring and Polishing Discs Kit, 2380, Maplewood, MN, USA), polishing points, and polishing with a diamond paste and cotton wheel. 14 Sample preparation was standardized and performed by the same individual to ensure consistency.
Representative samples per group were unpolished to visualize the amount of micro-brush and art brush remnants on the samples without polishing under a scanning electron microscope (SEM).
Thermocycling and staining
Following the collection of baseline color and surface roughness values, the study adhered to established protocols.15,16 Thermocycling (Thermocycler THE-1100—SDMechatronik GmbH, Feldkirchen-Westerham, Germany) was performed in distilled water for 10,000 cycles at 5°C and 55°C with dwell times of 15 s. Subsequently, the samples were immersed in staining solutions (coffee; Nestle, Araras, Brazil) for 30 days. The coffee was prepared by mixing one teaspoon with 180 ml of heated water at 80°C. Fresh coffee replaced the old one daily until the 30 days were completed. This aging protocol simulates 3 years of clinical service.
Color assessment
Before exposure to thermocycling and staining, all specimens were subjected to color measurements and considered as a baseline using a color reflectance spectrophotometer (X-Rite Color Eye 7000A, Grand Rapids, Michigan, USA) with computer software (SpectraMagic NX, RM2002QC, Konica Minolta Corp., Ramsey, Japan). According to the manufacturer’s instructions, the spectrophotometer was calibrated before starting any measurement session. All measurements were made with samples resting on a standard white background plate (no. 21633347, Konica Minolta Corp., Ramsey, NJ) with the lights on. Each specimen was set in the viewport of the spectrophotometer, and measurements of CIE L*a*b* values of each sample were obtained. Each measurement was repeated three times, and the mean values of the CIE L*a*b*data were calculated as described previously17,18 using the CIED2000 equation 19 :
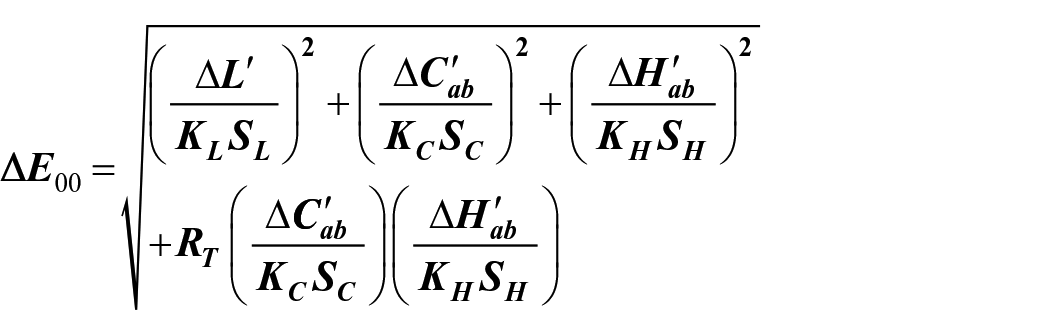
Then, the specimens were subjected to thermocycling and staining as described above. After removing the samples from the staining solution and allowing them to dry, the second color evaluation followed the previously described procedure. The disparities in the individual coordinate parameters between the baseline (control) and the samples immersed in coloring solutions were determined by calculating the (∆E00) where the CIE L*a*b parameters for the samples after thermocycling and staining were subtracted from the baseline readings.
Assessment of surface roughness parameters
For measuring the surface roughness of the specimens before and after the thermocycling-staining challenge, a non-contact profilometer (Contour Gt-K1 optical profiler; Bruker Nano, Inc., Tucson, AZ) was employed. 20 The specimens underwent radial scanning at various points, with a resolution of 0.01 mm, and this process was repeated five times. The average surface roughness (Ra), the root means square average of the profile heights (Rq), and the minimum valley of roughness profile (Rv) were then calculated for each specimen.
Scanning electron microscope (SEM)
After the simulated aging, two representative samples from each group were selected for examination using scanning electron microscopy (SEM). In addition, four additional groups were added in this assay, which were resin-based composites surfaced using art brush and micro-brush with and without modeling resin without polishing the surface. These groups were added to visualize and compare the remnants between the polishing and unpolished samples. The samples were prepared by mounting and applying a gold-sputtered coating (Cressington Sputter Coater 108auto, Ted Pella Inc, Redding, CA, USA). The surface morphology of the resin-based composites was then observed using SEM (JEOL JSM-6390LA, Tokyo, Japan) at an acceleration voltage of 20,000 kV. Representative images were captured at magnifications of ×50–200. 21
Statistical analysis
To independently compare the surface roughness parameters before and after the thermocycling-staining challenge within each group. Additionally, the mean values of the changes associated with the color and surface roughness parameters among the examined groups were compared using a one-way ANOVA and Tukey multiple comparison tests. A 5% significance level was used. The data were analyzed using Sigma Plot 12.0 (SYSTAT, Chicago, IL, USA).
Results
There was a significant difference among the group concerning the ΔE00 values when the one-way ANOVA was applied (p ⩽ 0.001; power of analysis = 100%). Generally, after thermocycling and staining, resin-based composites surfaced using micro-brushes without modeling resins were associated with less color change than the other groups (Figure 1). The ΔE00 values of the art brush with modeling resin group and the composites surfaced using mylar strips without polishing (6.76 ± 1.36) were significantly higher (p ⩾ 0.05) compared to the ones surfaced using art brush with no modeling resin (4.18 ± 1.18) and micro brush without modeling resin (4.04 ± 1.05). No significant difference was found amongst the micro-brush and art brush groups’ surfaces with or without modeling resins (p ⩾ 0.05; power of analysis = 100%). When the mylar strip group’s specimens were polished (5.51 ± 1.10), no significant difference was observed compared to the micro-brush and art brush groups (p ⩾ 0.05; power of analysis = 100%).
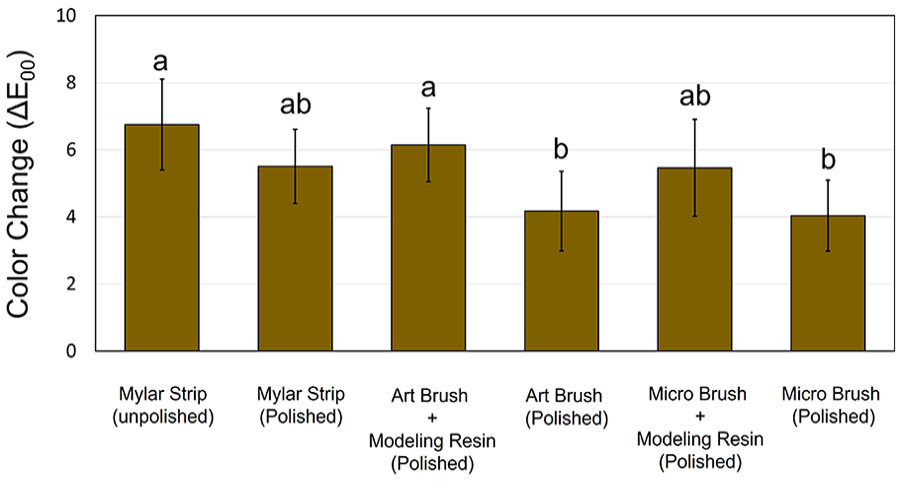
Color stability of the resin-based composite specimens (n = 10) subjected to thermocycling followed by staining in coffee for 28 days. Dissimilar letters indicate a significant difference (p ⩽ 0.05).
In Figure 2(a), the average surface roughness (Ra) in µm was investigated before and after the thermocycling-staining challenge. When a paired t-test was applied, a significant difference was found concerning each surfacing technique before and after the challenge (p ⩽ 0.01), as all the tested groups exhibited increased Ra values after the thermocycling-staining challenge. The difference between the surface roughness before and after the thermocycling and staining challenge was calculated (ΔRa) and one-way ANOVA was applied (Figure 2). A significant difference was observed between the unpolished mylar strip group compared to the micro-brush with no modeling resin group (p ⩽ 0.05; power of analysis ⩾ 0.8). The lowest ΔRa value was observed in the unpolished mylar strip group (0.02 ± 0.02), while the highest was observed in the micro-brush group with no modeling resin (0.12 ± 0.07).
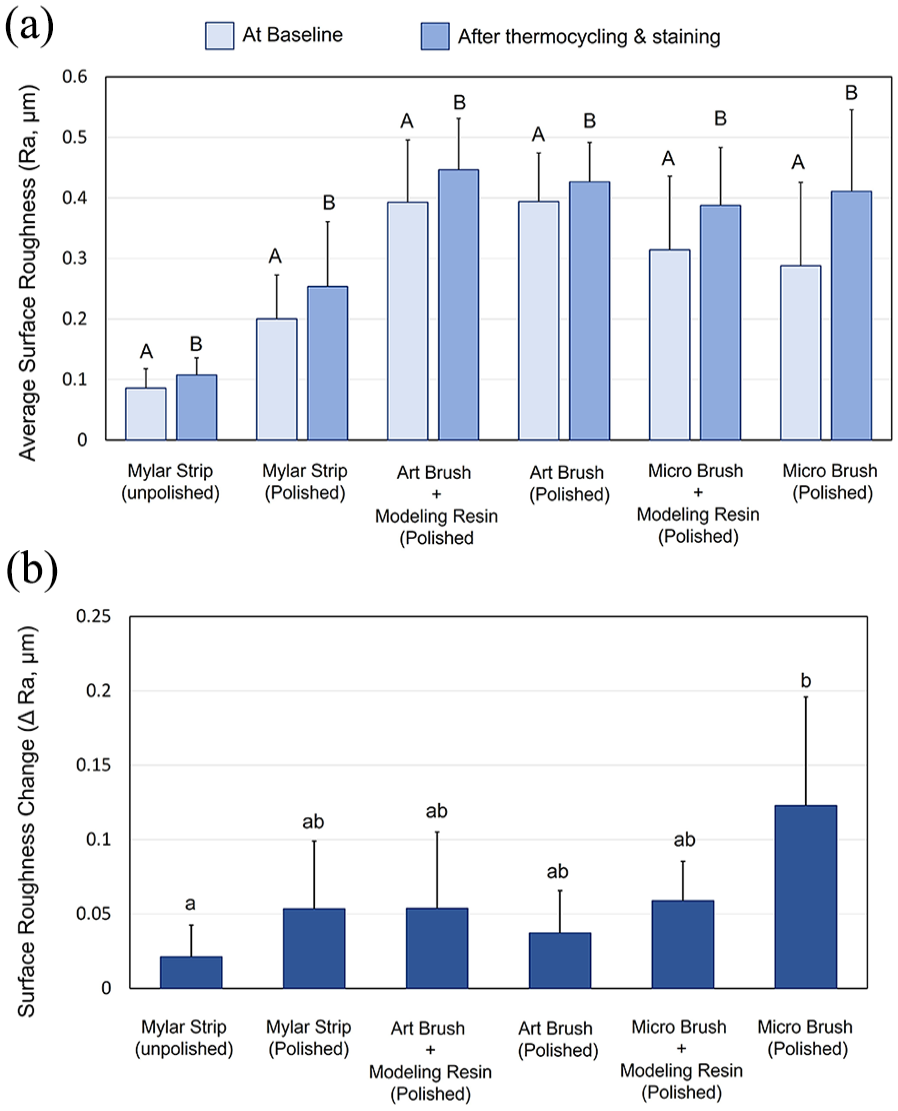
The resin-based composite specimens’ average surface roughness (Ra) (n = 10). (a) The Ra values at baseline and following the thermocycling-staining challenge. Paired t-test was applied to investigate any significant changes before and after the thermocycling-staining challenge in each tested group. (b) One-way ANOVA was used to compare the difference in surface roughness (ΔRa) between the tested groups. Dissimilar letters indicate a significant difference (p ⩽ 0.05).
Figure 3(a) illustrates the Rq values in µm before and after the thermocycling and staining challenge. When the paired t-test was applied (Figure 3(a)), a significant increase in the Rq values was observed in all the groups (p ⩽ 0.05; power of analysis ⩾ 0.8), except when art brush was used. In Figure 3(b), the ΔRq value was calculated and one-way ANOVA was applied. No significant difference was detected between the investigated groups with the lowest values observed among the art brush groups with (0.03 ± 0.12) and without modeling resin (0.02 ± 0.17).
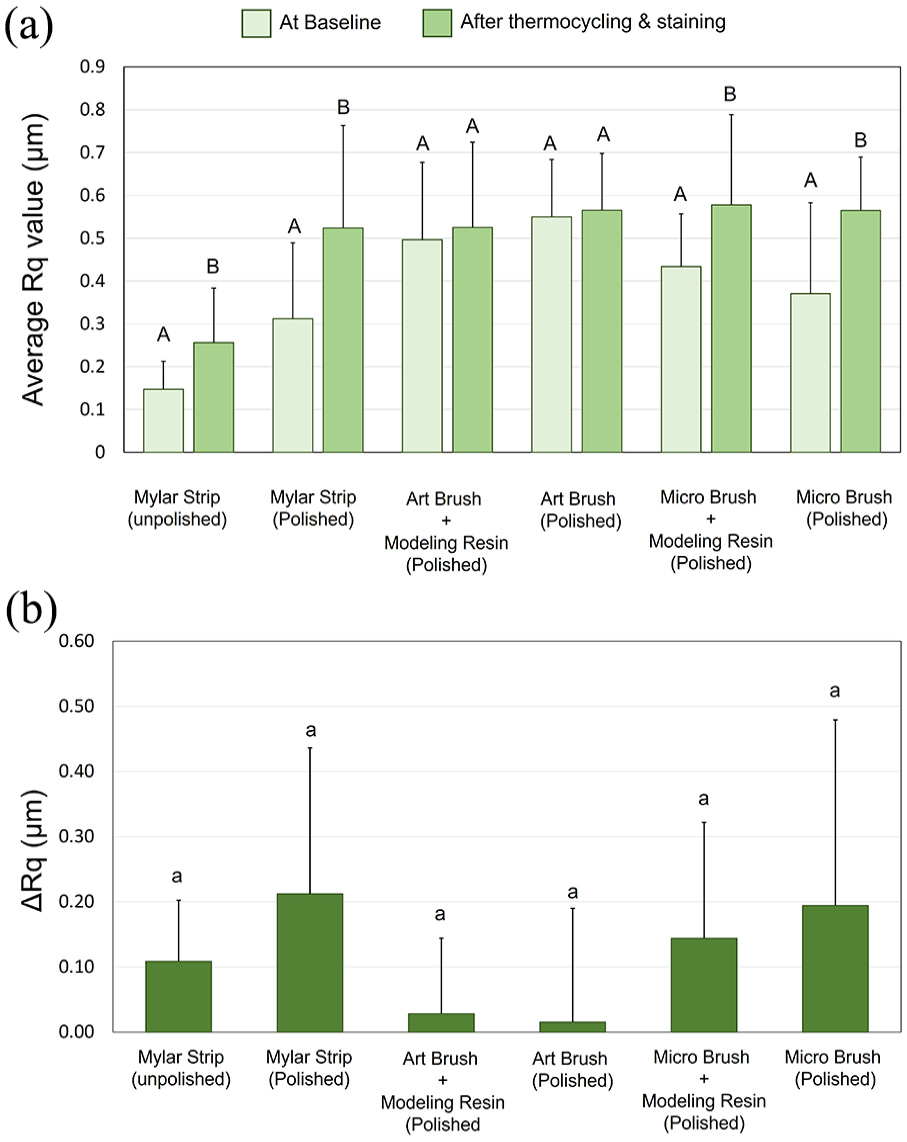
The root means square average of the profile heights (Rq) of the resin-based composite specimens (n = 10). (a) The Rq values at baseline and following the thermocycling-staining challenge. Paired t-test was applied to investigate any significant changes before and after the thermocycling-staining challenge in each tested group. (b) One-way ANOVA was applied to compare the difference in surface roughness (ΔRq) between the tested groups. Dissimilar letters indicate significant difference (p ⩽ 0.05).
Finally, the Rv and ΔRv values were investigated in Figure 4. Figure 4(a) reveals that all the groups accepted a significant increase in the Rv values following the thermocycling-staining challenge (p ⩽ 0.0001; power of analysis ⩾ 0.8). Then, the ΔRv values were calculated and one-way ANOVA was applied (Figure 4(b)). There was a significant difference between the art brush group with modeling resin (5.06 ± 1.93) and the specimens surfaced with mylar strip followed by polishing (9.86 ± 4.51) and the micro-brush without modeling resin (9.28 ± 1.61) (p ⩽ 0.05; power of analysis ⩾ 0.8).
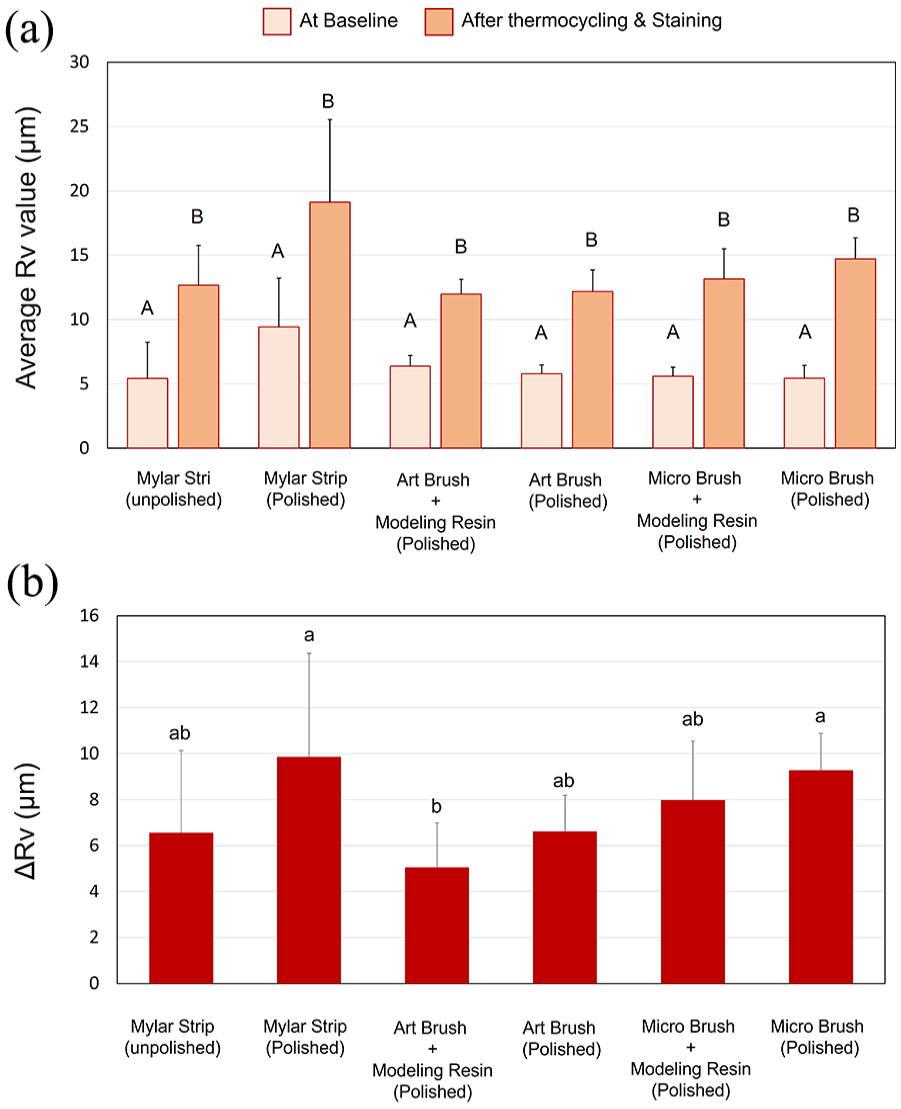
The minimum valley of roughness profile (Rv) of the resin-based composite specimens (n = 10). (a) The Rv values at baseline and following the thermocycling-staining challenge. Paired t-test was applied to investigate any significant changes before and after the thermocycling-staining challenge in each tested group. (b) One-way ANOVA was applied to compare the difference in surface roughness (ΔRv) between the tested groups. Dissimilar letters indicate significant difference (p ⩽ 0.05).
Figure 5 displays a qualitative representative photo for the surface roughness of the tested groups. Despite the differences in Ra, Rq, and Rv values shown in Figures 2 to 4, the overall increased surface topography changes were lowest in the mylar strip group (a), followed by the mylar strip (polished) group (b). The other remaining groups surfaced with art brush with (c) and without (d) modeling resins and micro-brush with (e) and without (f) modeling resin revealing comparable surface topography changes.
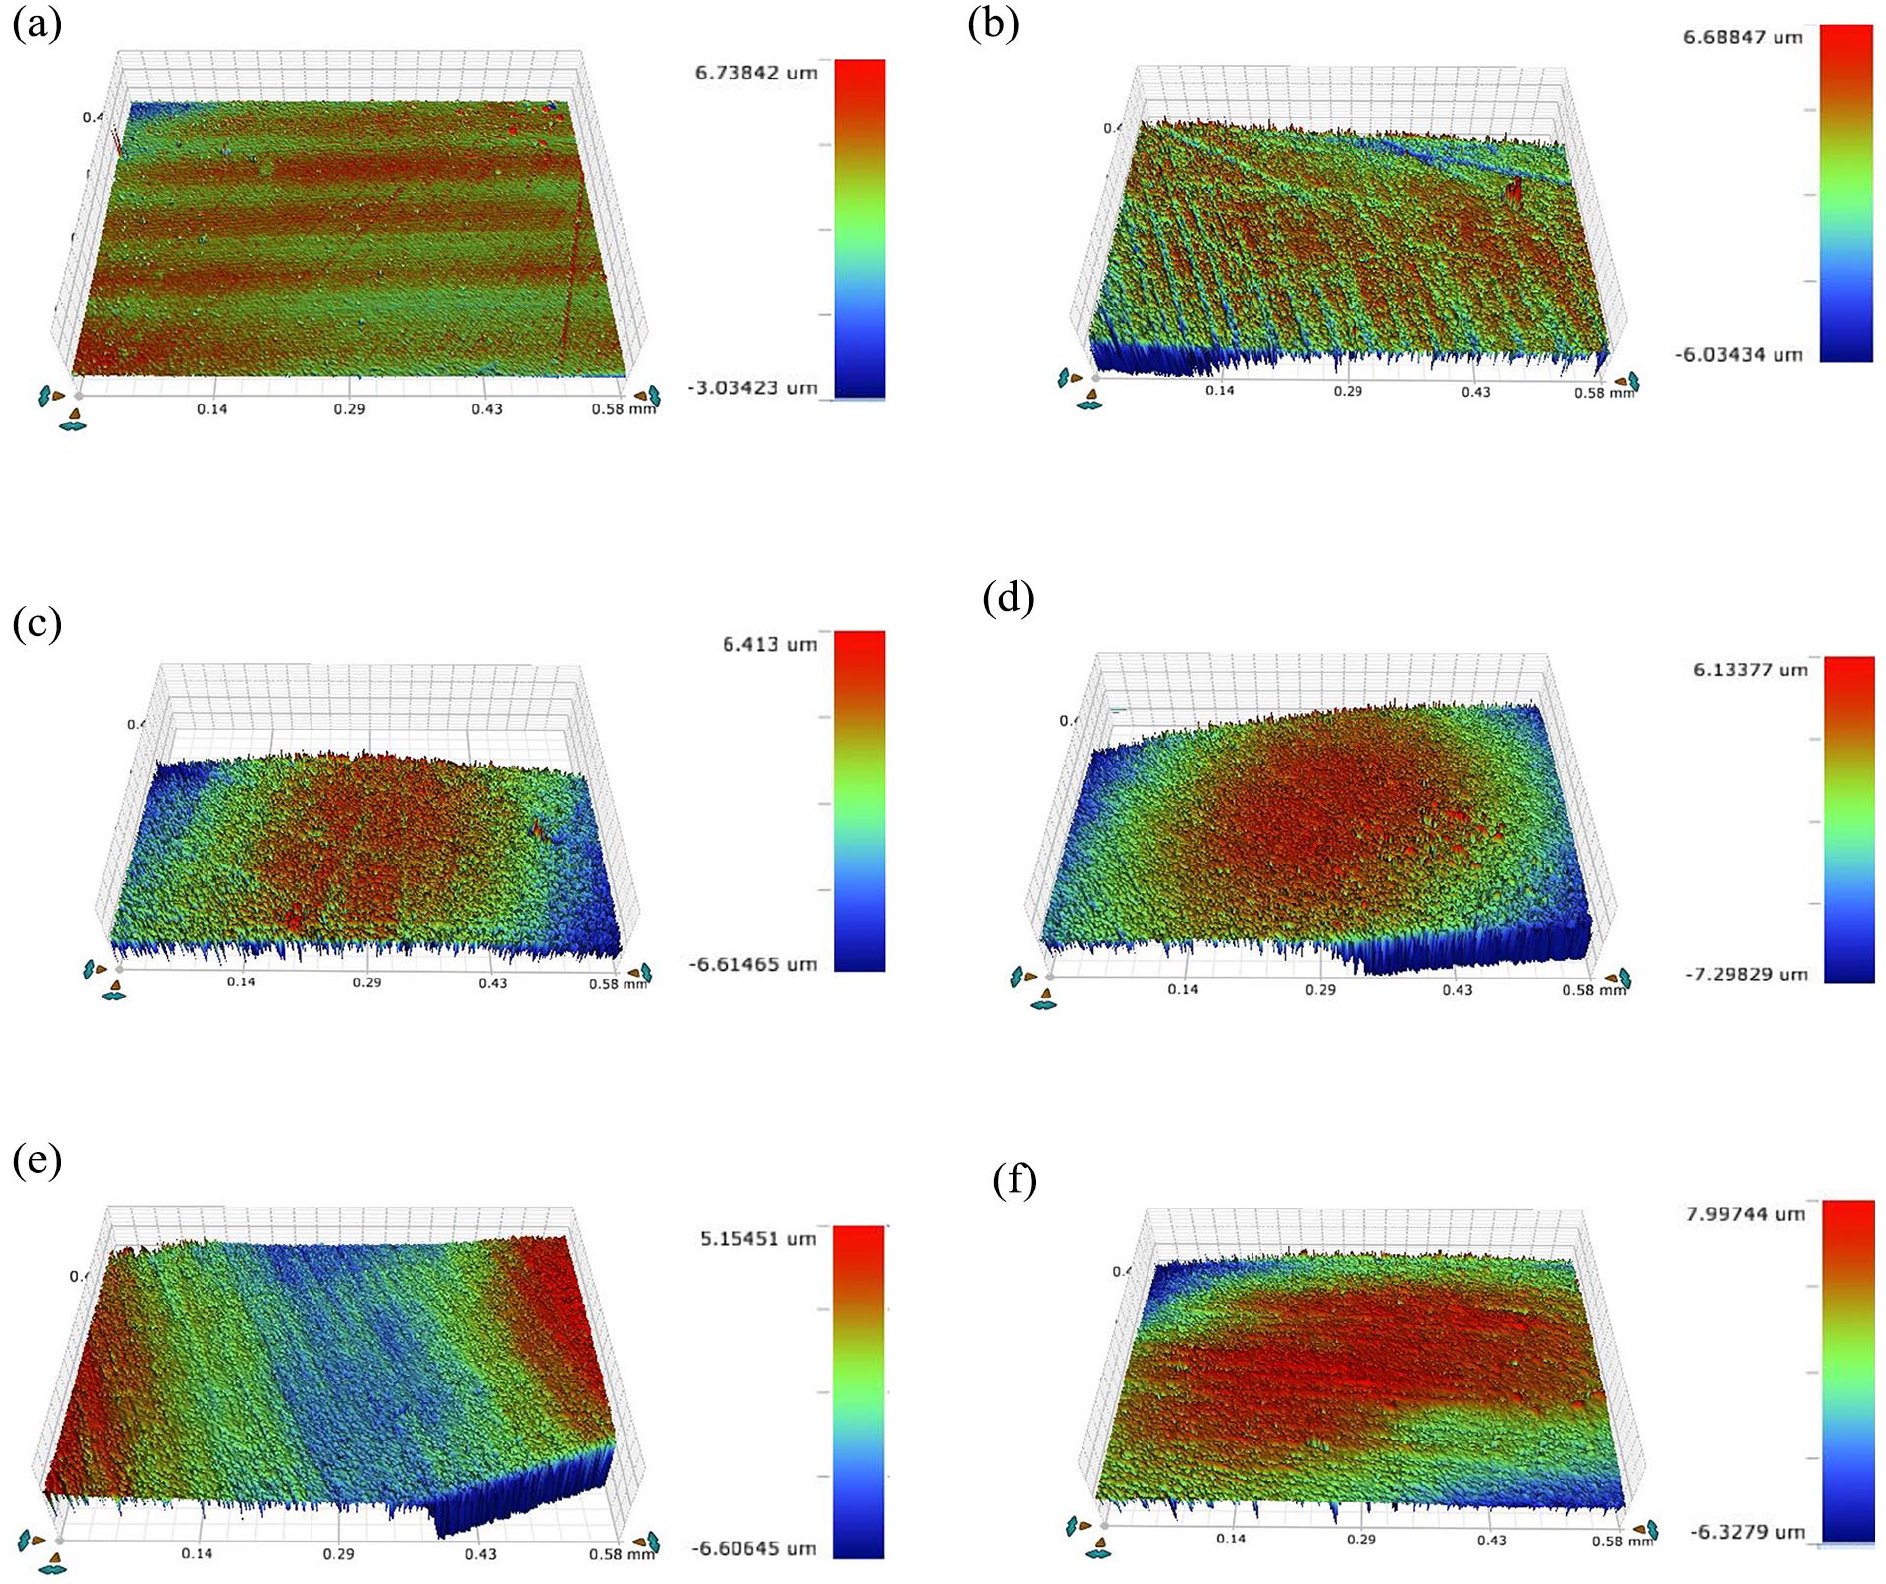
Representative scanning images for the tested groups taken by the non-contact profilometer device. (a) Mylar strip (unpolished), (b) Mylar strip (polished), (c) Art brush (polished), (d) Art brush with modeling resin (polished), (e) Micro-brush (polished), and (f) Micro-brush with modeling resin (polished).
Figure 6 provides SEM images illustrating the distinction between unpolished (Figure 6(a)–(d)) and polished specimens (Figure 6(e)–(j)). Using an art brush and micro-brush for surfacing resin-based composites left brush remnants on the restoration’s surface (Figure 6(a)–(d)). It was crucial to finish and polish these specimens to eliminate these remnants and ensure a smooth surface with minimal topographic discrepancies (Figure 6(g)–(j)). Notably, polishing the restoration after using the art brush and micro-brush resulted in a surface appearance comparable to the control (Figure 6(e) and (f)).
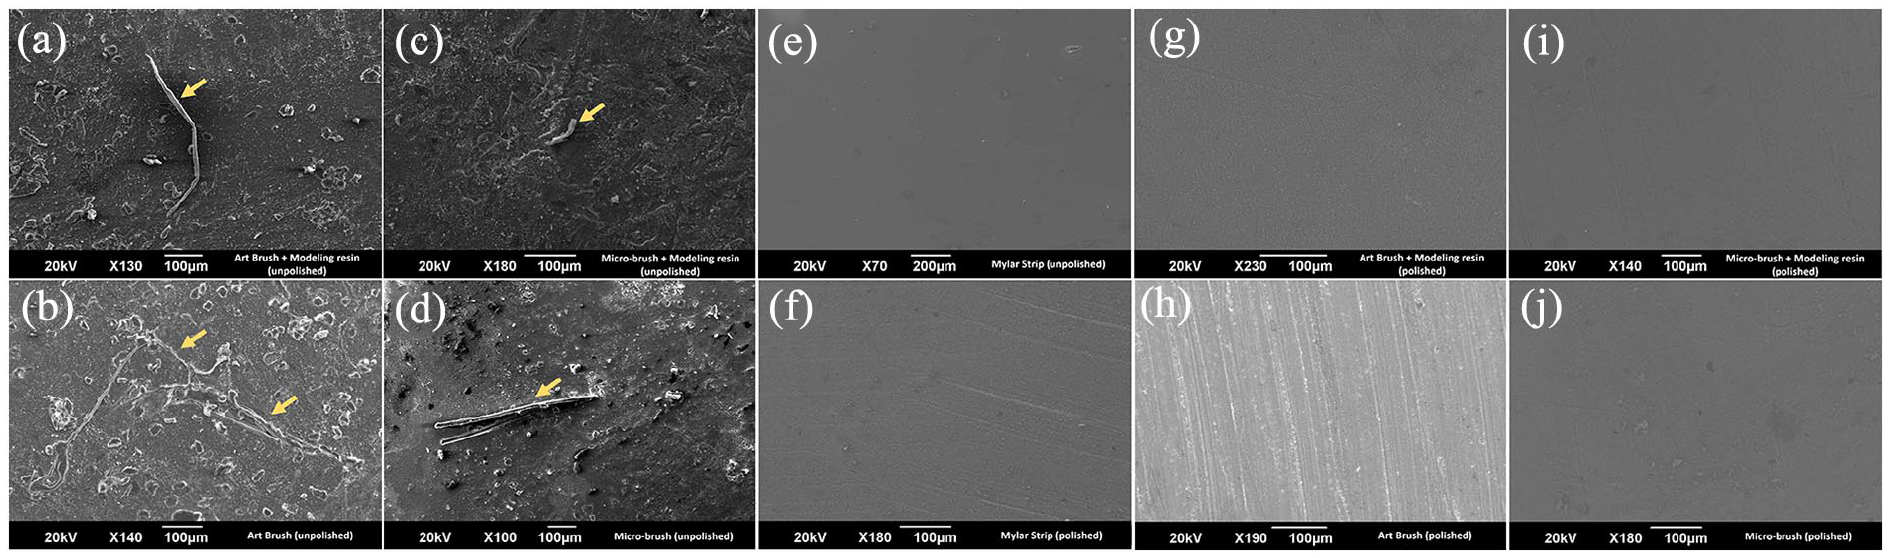
Scanning electron microscope (SEM) images of resin-based composite specimens surfaced using art brush and micro-brush, both with and without modeling resin, but without any polishing. The images also include the six tested groups (n = 2). Unpolished specimens surfaced with the art brush and micro-brush (a–d) exhibited significant surface discrepancies. Notably, remnants of the brush can be observed on the surface of the specimens (indicated by yellow arrows). Polished specimens (e–j) displayed smoother surfaces without any visible brush remnants.
Discussion
Staining and color mismatch stand as the leading causes for replacing anterior direct composite restorations. 22 Given the high esthetic expectations for such restorations, dentists seek to use techniques and materials that help to reach patient expectations for an improved esthetic result. However, it is critical to consider the long-term effects of these choices to ensure lasting satisfaction and durability of the restorations as composites can undergo degradation over time due to various factors. 23 Surface characteristics, including smoothness or roughness of the restoration surface, play a significant role in the degradation of composites. 24 Topographic alterations and increased surface roughness of a restoration enhance the likelihood of plaque accumulation, staining, and oral microbe attachment. This, in turn, can lead to degradation and the development of secondary caries.25,26 Thus, it is crucial to ensure that composites have a smooth surface by properly finishing and polishing the final restoration with minimal topography changes to promote the longevity of the restoration. 24
Our results showed a significant difference among the different groups regarding surface roughness and color difference. Therefore, the null hypothesis was rejected. The aging by thermocycling simulates 1 year of clinical challenge, and the immersion in coffee in our study simulates the aging of specimens for 24 months, resulting in a total of 3 years of aging, which is deemed reasonable as resin-based composite restorations are anticipated to exhibit noticeable color changes within that timeframe. 27 Moreover, the choice of coffee as a chromatic agent has been demonstrated to induce more color changes than any other chromatic liquid.14,17
While previous reports examined the application of modeling resin between multiple layers or on the top of the outer resin-based composite layer, our study chose the latter approach to study the surface properties. Furthermore, previous studies focused on mechanical properties, including tensile and flexural strength testing, surface hardness, color stability, monomer elution, and water uptake. 9 Moreover, few studies specifically addressed color stability and surface roughness.13,28,29 In our study, we emphasize the long-term impact on color and resistance to staining because the appearance of restorations is crucial for evaluating the overall success and durability of the resin-based composite material. 30
Regarding the color change, our results suggest that using art and micro-brushes without modeling resins results in less color change compared to other groups. Specifically, the groups employing modeling resins exhibited color changes similar to those using the mylar strip without polishing. Notably, the mylar strip group displayed the highest color change, as expected. This outcome is attributed to the presence of the oxygen-inhibited layer, which was not removed by polishing. The oxygen inhibits the polymerization reaction, forming a polymer chain that is more susceptible to staining and wear.31,32 In our study, modeling resin produced outcomes similar to those of the oxygen-inhibited layer, even after polishing. Therefore, based on our findings in highly esthetic areas, it is advisable to minimize the use of modeling resins. Additionally, the use of Mylar strips should be followed by finishing and polishing to enhance the longevity and color stability of resin-based restorations.
Another possible explanation for the color change of specimens surfaced with modeling resin could be attribute to the chemical composition of these resinous liquids. It has been claimed that because modeling resins consist primarily of hydrophobic methacrylate-based resins that are not soluble in water and typically contain little or no organic fillers, minimal impact is expected to be observed on the overall structure of the resin-based composite. 12 However, it was found that when modeling resins are used during the modeling process, changes in the chemical and mechanical properties of the resin-based were observed.33,34 This is because the incorporation of modeling resin compounds into the sculptured resin-based composite can disrupt its structure. 33 As a result, many manufacturers do not recommend using these resin blends together.
Our study revealed that after thermocycling and staining, surface roughness (Ra) analysis showed a significant increase in all tested groups. Notably, the mylar strip group exhibited the lowest ΔRa value, indicating minimal surface roughness change. When analyzing the root mean square average (Rq) and the minimum valley of roughness profile (Rv), the art brush group with and without modeling resin showed the lowest ΔRq and ΔRv values, suggesting relatively stable surface characteristics. Interestingly, the incorporation of modeling resin did not yield any additional benefits concerning surface roughness or color stability. This contradicts the findings of a previous study, where they observed that modeling resin did not affect surface roughness and reduced color changes in resin-based composite samples. 29 The variation observed between our results could be attributed to differences in the composition of the modeling resin. Despite using the same resin-based composite material, the influence of brushing changes introduced in the mentioned study cannot be overlooked. The brushing process might have abraded the modeling resin, potentially leading to a more chemically stable outer surface.
Prior research has indicated that the impact of modeling resin on the surface properties of resin-based composites is contingent on the specific material.9,13 Additionally, a comparative study examining modeling resin and filled adhesive resins concluded that modeling resin or liquid was the singular substance with the ability to significantly improve both the mechanical properties of the composite and its stability over time. 13 Hence, our study intentionally focused on a single type of resin-based composite, one light-curing unit, and modeling resin to minimize variables, allowing for the isolated investigation of the surfacing technique’s effects. The findings of this study support the importance of proper surfacing techniques to ensure good surface characteristics and color stability of resin-based composite restorations. Micro-brushes and art brushes can be valuable tools in shaping restorations’ occlusal and facial surfaces.
Additionally, utilizing SEM images in our study allowed for a closer examination of the surface characteristics of the restorations. The SEM images revealed remnants of micro-brush and art brush bristles on the unpolished samples when compared to polished samples. However, we conducted color stability and topographical tests on polished samples, aligning with the established standard of care that emphasizes finishing and polishing resin composite. Our findings underscore the importance of finishing and polishing after using microbrushes or art brushes to enhance the esthetics and longevity of resin-based restorations, especially in highly esthetic areas.
Additional research is essential to examine the long-term impacts of various surfacing techniques on the clinical efficacy and durability of resin-based composite restorations. Future investigations should include a comparative analysis between polished and unpolished resin-based composite groups to ascertain whether polishing effectively removes remnants from brushes. Moreover, a broader spectrum of resin-based composite materials and surfacing protocols should be evaluated to understand their effects comprehensively. Understanding the potential consequences of using certain surfacing protocols is essential for clinicians to make informed decisions and ensure the long-term success of dental restorations.
Conclusion
Dentists are encouraged to carefully evaluate the long-term impact of their material and technique choices, aiming for solutions that ensure durability and esthetic integrity over time. Using dental or micro brushes for applying composites does not raise the risk of staining. Instead, it is the use of resin modeling that leads to discoloration as time progresses. Attention to the impact of techniques and materials selection on the long-term appearance of the composites would significantly contribute to minimizing the need for future replacements.
Footnotes
Acknowledgements
The authors would like to thank Imam Abdulrahman bin Faisal University and Prince Norah bint Abdulrahman University for the use of equipment and facilities. The authors acknowledge the funding provided by Princess Nourah bint Abdulrahman University Researchers Supporting Project number (PNURSP2024R350), Princess Nourah bint Abdulrahman University, Riyadh, Saudi Arabia
Author contributions
Conceptualization, A.A.B., F.A., A.O.A., and E.I.; methodology, A.A.B., F.A., A.A., W.A., and T.A.; software, F.A., A.A., W.A., and T.A.; validation, F.A., A.A., W.A., and T.A.; formal analysis, A.A.B., F.A., A.O.A., and E.I.; investigation, A.A.B., F.A., A.A., W.A., and T.A.; resources, A.A.B., F.A., A.A., W.A., and T.A.; data curation, A.A., F.A., A.O.A., and E.I.; writing—original draft preparation, A.A.B., F.A., M.S.M., A.O.A., and E.I.; writing—review and editing, A.A.B., F.A., M.S.M., A.O.A., and E.I.; visualization, A.A.B., F.A., M.S.M., A.O.A., and E.I.; supervision, A.A.B., A.O.A., M.S.M., and E.I.; project administration, A.A.B., A.O.A., and E.I.; funding acquisition, A.A.B., F.A., A.A., W.A., and T.A. All authors have read and agreed to the published version of the manuscript.
Data availability statement
The data presented in this study are available on request from the corresponding author.
Declaration of conflicting interests
The author(s) declared no potential conflicts of interest with respect to the research, authorship, and/or publication of this article.
Funding
The author(s) disclosed receipt of the following financial support for the research, authorship, and/or publication of this article: This research was funded by Princess Nourah bint Abdulrahman University Researchers Supporting Project number (PNURSP2024R350), Princess Nourah bint Abdulrahman University, Riyadh, Saudi Arabia
Institutional review board statement
Not applicable.