
Abstract
Objective:
To assess the effect of bleaching on surface roughness and gloss of different CAD/CAM ceramic materials.
Methods:
The ceramic materials included IPS e.max CAD (lithium disilicate), VITA ENAMIC (polymer infiltrated ceramic), and Celtra Duo CAD (zirconia reinforced lithium silicate). Samples of each material were randomly divided into four groups (n = 10); a control group immersed in distilled water, the second and third groups were treated with 20% carbamide peroxide (20% CP) and 35% carbamide peroxide (35% CP) bleaching agents for 4 h/day and 60 min/day respectively for 7 days. The fourth group was treated with 40% hydrogen peroxide (40% HP) applied twice, each turn for 20 min. After treatment, the surface roughness (using 3D non-contact profilometry) and surface gloss were assessed followed by imaging with a scanning electron microscope. The data were analyzed using multiple linear regression and Kruskal-Wallis one-way ANOVA tests (α = 0.05).
Results:
The surface roughness (p = 0.157) and gloss (p = 0.073) of IPS e.max CAD were not significantly affected by the different bleaching treatments. Similarly, no significant effect on surface roughness (p = 0.162) and gloss (p = 0.965) were shown for Celtra Duo CAD. On the other hand, VITA ENAMIC was significantly affected when treated with 20% CP and 35% CP showing increased roughness (p = 0.001) and gloss (p = 0.008).
Conclusions:
Home bleaching treatments (20% CP and 35% CP) significantly affected the surface roughness and gloss of VITA ENAMIC while IPS e.max CAD and Celtra Duo CAD were not affected by the different bleaching treatments.
Introduction
Esthetic dental treatment is one of the fastest growing fields in dentistry. Nowadays patients are increasingly seeking whiter teeth and perfectly-looking smiles. Dental bleaching is considered one of the most conservative and effective methods that have been used to achieve whiter teeth since the late 1980s. 1 In addition, the use of tooth-colored restorative materials to restore teeth and perfect smiles is frequently sought by patients especially restorations that can be fabricated and delivered in 1 day through digital intra-oral scanning and chair-side CAD/CAM techniques. 2
The most common dental bleaching agent is hydrogen peroxide (H2O2) which is delivered either as hydrogen peroxide or carbamide peroxide (CH6N2O3). Other less commonly used agents include sodium percarbonate and sodium chlorite. 3 Hydrogen peroxide whitens the teeth by degrading large organic molecules into smaller lighter color molecules through oxidation reaction by free radicals. 1 Bleaching agents can be available over the counter in various forms such as whitening strips, gels, and tray-based products. They can also be provided professionally by dentists either as in-office power bleaching or supervised tray-based home bleaching. 1 The efficiency of a bleaching agent depends mainly on its hydrogen peroxide concentration. In-office power bleaching is considered the most efficient approach resulting in tooth whitening within 30–60 min since hydrogen peroxide (HP) in concentrations as high as 40% can be applied. Home bleaching products involve the use of carbamide peroxide (CP) in concentrations ranging from 10% to 35%. They are less efficient than in-office bleaching since a 10% carbamide peroxide gel can provide a maximum of only 3.6%HP and thus requires a longer time of application to whiten teeth 3,4; usually 2–4 h/day or overnight for a few days to achieve a noticeable result. 1
The effect of bleaching on dental tissues and restorative materials is considered a critical issue that has been widely assessed. Although the data are conflicting, bleaching has been shown by many studies to adversely affect enamel’s surface at the microstructural level resulting in demineralization,5,6 increased roughness,7,8 and decreased microhardness.7,9 Concerning tooth-colored direct restorative materials, it has been shown that 10% CP and 6.5% HP significantly decreased the gloss of a number of resin-composites including an ormocer. 10 Surface roughness of a resin-composite was not affected with the application of either 10% or 15% CP, 11 however, 35% HP and 16% CP resulted in surface roughness of a resin-composite to increase significantly when the material’s surface was not protected by a sealant. 7 It has been concluded from different studies that the surface effects of bleaching agents on resin-composites are material- and time-dependent.8,12,13 On the other hand, the surface roughness of glass ionomers has been shown to be adversely affected even at low CP concentrations.11,13
Concerning ceramics, many studies have been conducted mainly on conventional materials. Although they are considered very inert, the free radicals of bleaching agents may diffuse into the surface of a ceramic material resulting in the dissolution of its glassy components and alteration of its surface physical properties. 14 A number of studies showed that the effects of bleaching on surface properties such as surface roughness and microhardness of different ceramic materials are not significant.11,15–18 On the other hand, some studies have shown a significant negative effect on surface roughness,13,14,19–24 gloss, 14 and microhardness 25 suggesting that these restorations should be carefully protected during bleaching procedures. The effects concerning surface roughness have been shown to be influenced by the type of surface treatment of the ceramic prior to the bleaching treatment (e.g. overglazed, autoglazed, polished, and refinished surfaces).26–28
Surface roughness is a critical property for dental materials since increased roughness is associated with increased bacterial adhesion and biofilm maturation. 29 With regard to ceramics, the increase in surface roughness has been shown to negatively affect their translucency, 30 biaxial flexure strength, 31 and the abrasive wear performance.32,33 Gloss is another critical surface property that measures the extent of reflection of the incident light on the surface which affects the extent of surface luster. Gloss is greatly influenced by surface topography; thus, it is often assessed together with surface roughness,34–37 however, it is affected by other factors such as the angle of the incident light and the refractive index of the material. It is very important for an esthetic restorative material to have a similar gloss value to enamel and to ensure that its gloss is not affected by the challenging circumstances of the oral environment and treatments such as bleaching.
Chair-side CAD/CAM technology was first introduced in dentistry in the mid-1980s which made it possible to fabricate and deliver ceramic restorations during a single dental visit. The early CAD/CAM ceramic blocks comprised feldspathic ceramic materials but nowadays stronger materials are used such as those based on lithium disilicate (LDS). With the increased demands for more conservative preparations and prepless restorations, polymer infiltrated ceramic materials (PIC) combining polymers and glassy ceramics have been introduced that showed improved fatigue resistance compared to other ceramics 38 allowing them to be fabricated in a very low thickness. More recently, zirconia reinforced lithium silicate (ZLS) combining lithium silicate and zirconia was introduced aiming to provide a material that offers the esthetic properties of LSD combined with the mechanical strength and transformation toughening properties of zirconia. 39
By observing data in the literature, it appears that the effect of bleaching on various surface properties of different ceramics is still not conclusive. For that reason, and with the evolution of new ceramic materials, this study was conducted with the aim to assess the effect of three different types of highly concentrated bleaching agents on the surface roughness and gloss of different CAD/CAM ceramic and hybrid ceramic materials. The bleaching agents included 40% hydrogen peroxide in-office bleaching (40% HP), 20% carbamide peroxide home bleaching (20% CP), and 35% carbamide peroxide home bleaching (35% CP). The ceramic materials included LDS, ZLS, and PIC. The primary null hypothesis to be tested is that there would be no significant effect of different bleaching agents on the surface roughness and gloss of the tested CAD/CAM ceramic materials. A secondary null hypothesis is that there would be no significant effect of the type of ceramic material and the type of bleaching agent on the surface roughness and gloss.
Methods
Test materials
This study was approved by the Research Ethics Committee of the Faculty of Dentistry at King Abdulaziz University (Ref. No. 20-12-19). Tested materials included three CAD/CAM ceramics: IPS e.max CAD, VITA ENAMIC, and Celtra Duo which represent LDS, PIC, and ZLS respectively. Information regarding materials’ composition and manufacturers’ details are summarized in Table 1.
The composition and manufacturer details of the tested ceramic materials.

Sample preparation and experimental design
Samples of the different ceramic materials were produced using a low-speed precision cutting saw cooled with water (TECHCUT 4, Allied High Tech Product, Pacifica Place, Rancho Dominguez, USA). The blocks of the CAD/CAM ceramic materials were cut into slices with approximately 2 mm thickness providing a total of 120 samples (40 samples for each material). Refining of the edges of the samples was carried out using red and yellow high-speed wheel-shaped diamond burs with water coolant (Meisinger, Germany). One surface of each specimen was polished using a grinding-polishing machine (MetaServ 250, BUEHLER, Waukegan Road, Lake Bluff, Illinois, USA) using silicon carbide papers with three grit sizes (P60, P400, and P2500) sequentially (MicroCut Discs, PSA Backed, Buehler, USA). The machine operated at a speed of 250 rpm with water coolant. Samples were hand-held against each polishing paper for 1 min until a visibly glossy surface was attained. Finishing and polishing of all samples was carried out by one operator. Samples of LDS were then crystallized according to the manufacturer’s recommended program at 850°C temperature for about 20 min (Programat P310, Ivoclar Vivadent, Schaan AG, Liechtenstein).
Samples of each ceramic material were randomly divided into four groups (n = 10). One group acted as a control while the other three groups were treated with different bleaching agents.
Experimental procedure
The three experimental groups of each material received treatment on their polished surfaces using a different bleaching agent for each group. The bleaching agents used were 20% CP, 35% CP, and 40% HP. The control group was stored in distilled water. Information about the bleaching agents as provided by the manufacturer is provided in Table 2. The pH of the different bleaching agents was verified using a benchtop pH/ISE meter (Orion Star A214, Thermo Scientific, Chelmsford, MA, USA). The device was calibrated using pH 4, 7, and 10 buffer solutions (Orion Application Solution, Thermo Scientific, Chelmsford, MA, USA). The measurement was repeated three times for each bleaching agent and the values were averaged.
Manufacturers’ details and composition of the tested materials and bleaching agents.

The bleaching agents were applied according to the manufacturer’s recommendation by a single operator at room temperature (25°C). 20% CP and 35% CP were applied twice per day for 7 days. 20% CP was applied each time for a period of 4 h while 35% CP was applied for 60 min. Two successive applications of 40% HP were carried out for 1 day; the period of each application was 20 min. The bleaching gels were applied using a brush distributing the material evenly (0.5–1 mm-thick layer) over the polished surface. After each application of the bleaching agents, the samples were thoroughly rinsed for 10 s with water and then stored in distilled water until the next application.
The control and experimental groups were then assessed for surface roughness and gloss. For surface topography assessment, two samples from each group were examined using a scanning electron microscope (SEM). Samples were cleaned with air/water spray for 10 s and dried with compressed air before analyses.
Surface profilometry
Surface roughness assessment and imaging were performed using non-contact 3D surface profilometry (Contour GT-K 3D Optical microscope, Bruker, Tucson, AZ, USA) using an electromagnetic wave source in the form of broadband light. The technique involves vertical scan interferometry with Gaussian regression filter which is considered efficient for measuring objects with variable surface topography with differences in pixel height of more than 135 nm. The test parameters included 5× Michelson lens magnification, 1 mm × 1 mm field of view, thresholding value of 4, and 1× scan speed. The settings of the device were controlled through Vision 64 Control and Analysis software (Bruker, Tucson, AZ, USA). The samples were centralized on the stage of the optical microscope using a jig and adjusted manually until a clear image appeared on the monitor. Each sample was scanned across its surface three times. The three measurements were then averaged to calculate the Ra surface roughness value.
Gloss analysis
The measurements of gloss were done using a calibrated glossmeter (VONO-CURVE, Rhopoint Instruments, Envlro21 Park, Queensway Avenue South, St Leonards on Sea, East Sussex, TN38 8AG). The samples were centralized over the reading window and two readings were taken for each sample at 60° following the ISO 2813 specifications for ceramics materials. 40
SEM
To get qualitative data about the sample surfaces, SEM images were taken. Two samples of each group were gold coated and inspected in a scanning electron microscope (Eto bro, Jeol 6610LV, Tokyo, Japan) at 5000× and 10,000× magnifications. The device operated at 15 kV.
Statistical analysis
Sample size calculation was based on a standard deviation value of 0.1 µm, a minimum expected difference between comparison groups of 0.2 µm, and 95% study power. A sample size of 10 was determined to be adequate. The data were analyzed using IBM SPSS Statistics software version 20 for Windows (IBM Corporation, USA). The normality of the roughness and gloss data was assessed using the Shapiro-Wilk test showing non-normal distribution (p < 0.001). Accordingly, the data were analyzed using Kruskal-Wallis non-parametric test. Pairwise comparisons were performed using the Mann-Whitney U test followed by Bonferroni correction. Multiple linear regression was used to test if the ceramic type and bleaching procedure significantly predicted roughness and gloss values. All tests were conducted at a significance level of 5%. Spearman’s correlation analysis was performed to assess the association between surface roughness and gloss data.
Results
The mean pH values for the different bleaching agents were 6.53 (±0.09), 6.15 (±0.24), and 7.44 (±0.12) for 20% CP, 35% CP, and 40% HP respectively. Data for surface roughness (Ra) and gloss (GU) values for the different test groups are summarized in Table 3.
Surface roughness (Ra) and gloss (GU) values of the different ceramic materials and test groups.
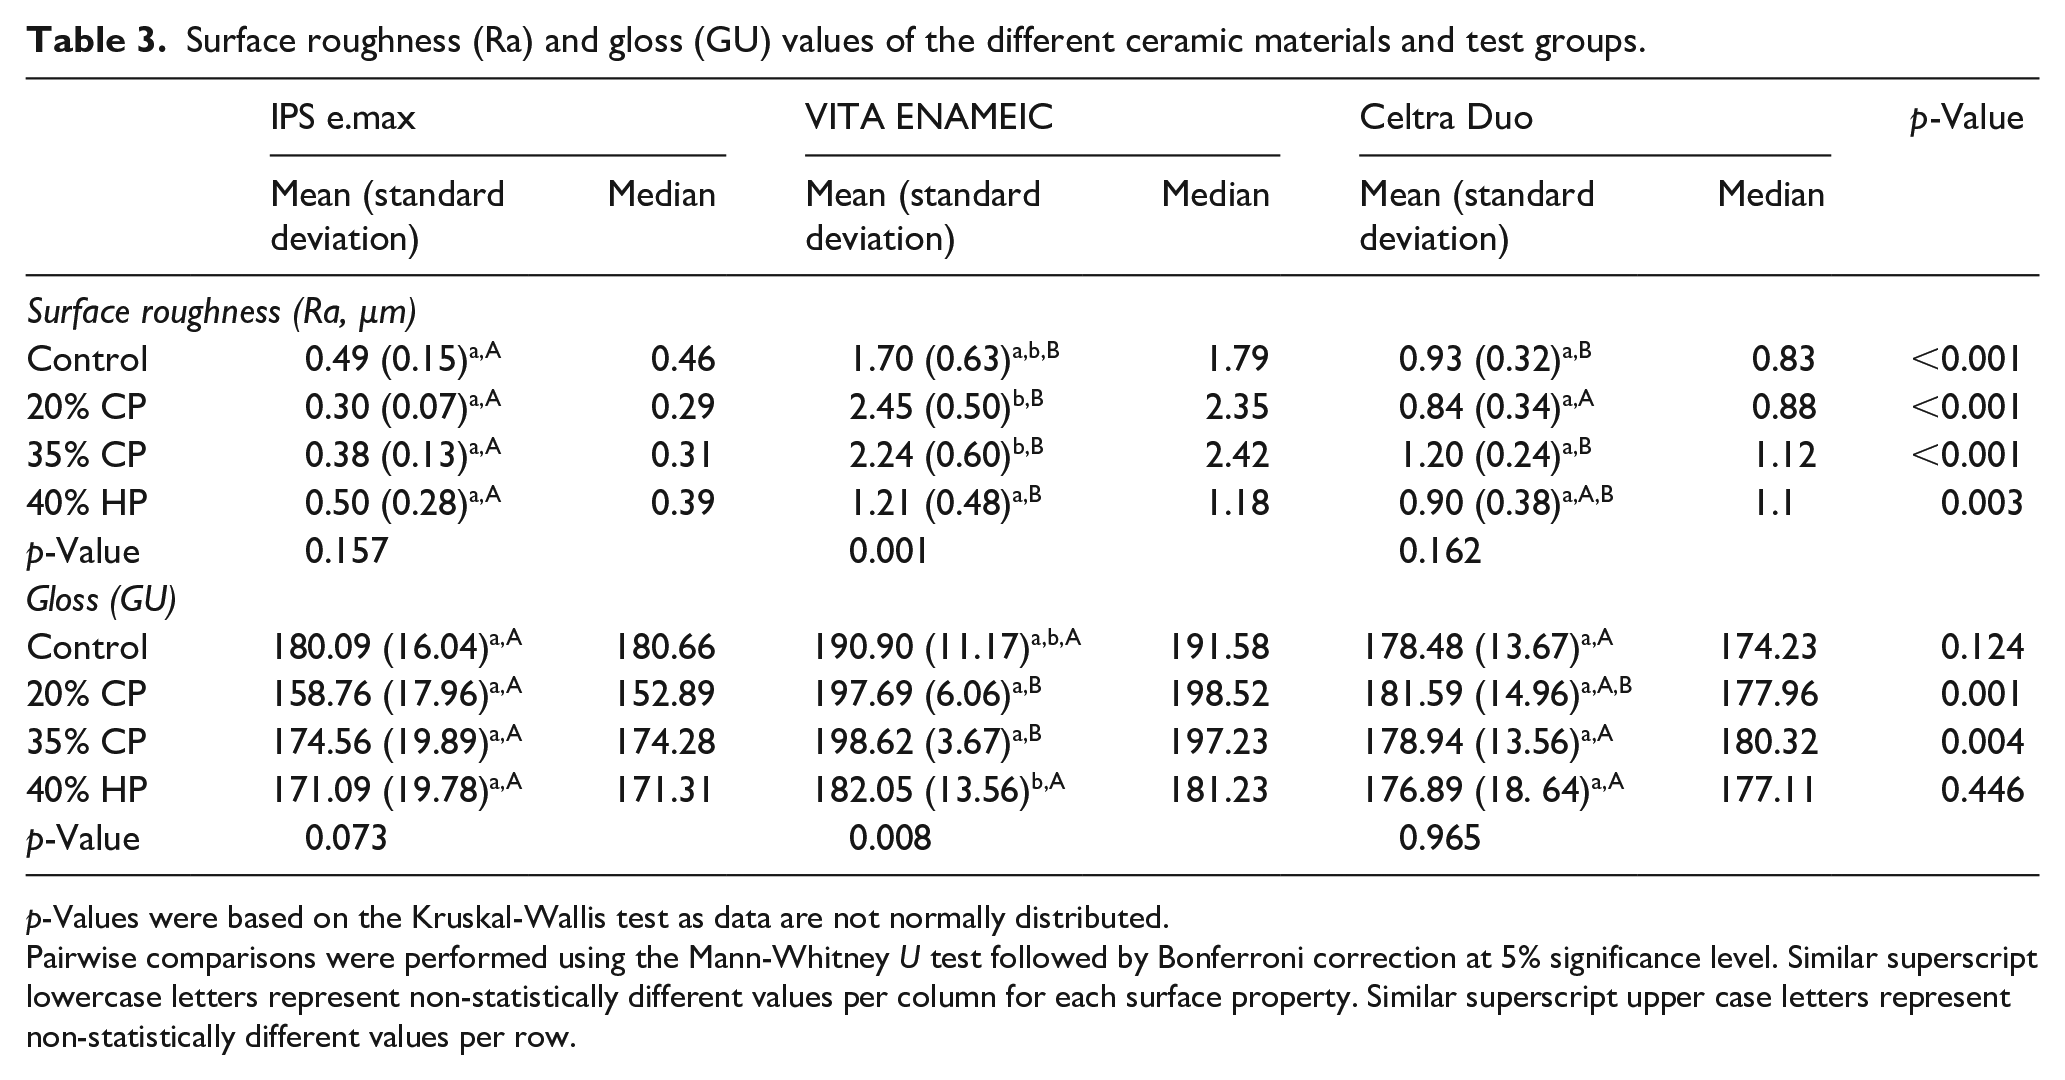
p-Values were based on the Kruskal-Wallis test as data are not normally distributed.
Pairwise comparisons were performed using the Mann-Whitney U test followed by Bonferroni correction at 5% significance level. Similar superscript lowercase letters represent non-statistically different values per column for each surface property. Similar superscript upper case letters represent non-statistically different values per row.
Surface roughness
The mean surface roughness (Ra) values for different ceramics in ascending order were 0.42 (±0.19) for LDS, 0.97 (±0.34) for ZLS, and 1.90 (±0.72) for PIC. Multiple linear regression showed that the overall regression was statistically significant (R2 = 0.734, F = 10.9, and p < 0.001). It was shown that the type of ceramic material significantly predicted roughness (β = 0.291, p = 0.001) while the bleaching procedure did not significantly predict roughness values (β = 0.086, p = 0.331).
Concerning the effect of bleaching, ZLS (p = 0.162) and LDS (p = 0.157) did not demonstrate any significant differences between the different test groups. On the other hand, the effect of bleaching treatment was significant for PIC (p = 0.001). 20% CP (adjusted p = 0.001) and 35% CP (adjusted p = 0.008) showed significantly higher Ra values than 40% HP. The 3D profilometer images of the different materials and test groups are shown in Figure 1.

Representative 3D surface-profilometer images of lithium disilicate (a–d), polymer infiltrated ceramic (e–h), and zirconia reinforced lithium silicate (i–l). From left to right: images represent the control (first column), 20% CP (second column), 35% CP (third column), and 40% HP (fourth column) groups. CP and HP stand for carbamide peroxide and hydrogen peroxide respectively.
The scanning electron microscope images (Figure 2) did not show specific surface alterations among the samples of LDS and ZLS. PIC on the other hand showed that the surface topography of the samples treated with 20% CP and 35% CP was obviously rougher compared to the control and to the 40% HP treated samples which is consistent with the Ra values.

Scanning electron microscope images at 10,000× for lithium disilicate (a–d), polymer infiltrated ceramic (e–h), and zirconia reinforced lithium silicate (i–l). From left to right: images represent the control (first column), 20% CP (second column), 35% CP (third column), and 40% HP (fourth column) groups. CP and HP stand for carbamide peroxide and hydrogen peroxide respectively.
Gloss
The mean gloss (GU) values for different ceramics in ascending order were 171.13 (±19.45) for LDS, 178.97 (±14.84) for ZLS, and 192.32 (±11.31) for PIC. Multiple linear regression for gloss values showed that the overall regression was statistically significant (R2 = 0.033, F = 4.005, and p = 0.048). It was shown that the type of ceramic material significantly predicted gloss values (β = 0.181, p = 0.048) while they were not significantly predicted by bleaching procedures (β = 0.153, p = 0.093).
Regarding the effect of bleaching, both LDS and ZLS were not significantly affected (p = 0.073 and 0.965 respectively). However, a significant effect was shown for PIC (p = 0.008). Both 20% CP (adjusted p = 0.031) and 35% CP (adjusted p = 0.014) bleaching groups showed significantly higher gloss values compared to 40% HP. The Spearman’s correlation coefficient was 0.461 indicating a non-significant association between surface roughness and gloss values.
Discussion
The primary null hypothesis was partly rejected because the effect of the different bleaching treatments on surface roughness and gloss of LDS and ZLS was insignificant while these properties were significantly affected when PIC was treated with 20% CP and 35% CP. Surface roughness and gloss were affected significantly by the type of the ceramic material while the effect of the bleaching agent was insignificant, thus the secondary null hypothesis was also partly rejected.
Surface roughness in the present study was quantified using the Ra parameter assessed by the white light interferometer profilometry technique. Ra represents the arithmetic mean of absolute profile heights in relation to the mean height within the evaluated length of a sample at a nanometer scale. Although there are other parameters for assessing surface roughness, Ra is the most commonly used parameter as it gives reliable data for monitoring and comparing the surface finish. The increase in Ra value above a certain threshold has been shown to be related to biofilm adherence to the surfaces of dental restorative materials. 29 The interferometry data were verified and complemented by SEM imaging at different magnifications showing the surface topography. White light interferometry has the advantage of scanning a larger surface area of a sample at considerably higher speed and axial resolution as compared to other metrology tools such as atomic force microscopy. It is a non-destructive technique as it is based on light reflection which does not require physical contact with the measured surface such as that required in mechanically based techniques. 41
The significant increase in surface roughness of PIC after treatment with the home bleaching agents (20% CP and 35% CP) as compared to the in-office bleaching agent (40% HP) conforms with the findings of an earlier study. 24 Although the hydrogen peroxide concentration of home bleaching is much lower than that of in-office bleaching agents, the increased roughening effect could be attributed to the increased time of contact with PIC increasing the chance of the erosive action of the free radicals to take place. In addition, the significant increase in surface roughness demonstrated by the home bleaching products could be due to their slightly lower initial pH compared to the highly buffered two-barrel in-office bleaching system used in the current study. 42 The lower pH would increase the diffusion coefficient and absorption of the home bleaching gel into the resin component of the PIC similar to the effect observed in a previous study when resin-composites were immersed in acidic drinks. 43 Consequently, greater penetration and oxidative degradation of the polymeric matrix by the peroxide could have taken place with subsequent exposure of the rough glassy network of the PIC on the surface. A similar effect was observed for some types of resin-composites when treated with home bleaching agents. In a study where a microhybrid resin composite was bleached with 35% CP for 21 days, a significant increase in surface roughness was observed compared to the control while a microfilled resin composite was not affected. 8 The surface roughness of PIC in the current study tended to be lower in the 40% HP group compared to the control. Although the difference was not statistically significant, it could be explained by the lower pH of distilled water compared to the 40% HP bleaching agent.
In the current study, the surface roughness of LDS was shown to be insignificantly influenced by the different bleaching agents. This is in contrast with a recent study that showed that surface roughness of glazed LDS significantly increased after treatment with 16% CP for 6 h/day for 7 days. 7 This could be explained by that the surface of LDS samples in the current study has only been finished and polished without overglazing. An overglazed surface has been shown to be more susceptible to bleaching agents than polished21,26 or autoglazed 27 ceramic surfaces. In a study assessing the effect of 16% CP on the surface roughness of feldspathic and fluorapatite-leucite glass-ceramic, it was shown that the surface roughness of the refinished surfaces was not affected which is consistent with our study. 28 By comparing our results to the findings of studies that used glazed surfaces, it would be hypothesized that finishing and polishing of LDS would be more advantageous over glazing in terms of improving the material’s susceptibility to the roughening effect of bleaching agents, however, further testing is required to ascertain this. Regarding ZLS, our results suggest that the surface roughness of this material is not influenced by the carried-out bleaching treatments. There are no previous studies that assessed this aspect of the material. A recent study assessed the change in surface roughness of multiple CAD/CAM materials when immersed in a low-pH solution of hydrochloric acid. 44 The study showed that the surface roughness of both LDS and zirconia was not significantly affected while PIC, feldspathic, and leucite reinforced ceramics showed a significant increase in roughness which is consistent with the results of the current study. Although bleaching agents cannot be compared with hydrochloric acid, these findings may reflect greater hydrolytic and chemical stability of polycrystalline ceramics compared to glassy and polymer matrix ceramics.
When the total surface roughness values of the different materials were compared regardless of the bleaching treatment applied, LDS showed the smoothest surface followed by ZLS while PIC showed the roughest surface. This was also evident by the SEM topography. This finding is in line with an earlier study that showed a significantly higher Ra value of PIC compared to both LDS and ZLS. 30 This is attributed to the heterogeneous structure of PIC composed of ceramic and polymer phases which would challenge the polishability of this material. The average Ra values of LDS and ZLD were within the clinically acceptable abrasive wear threshold (1.5 µm), 33 however, PIC showed higher Ra values which suggests that this material should be carefully finished and polished using the manufacturer recommended finishing and polishing protocol.
Concerning the effect of the bleaching on the surface gloss of the different ceramics, no significant effect was shown except for PIC when treated with 20% CP and 35% CP which is in accordance with the surface roughness findings. However, the data of gloss measurements did not show an inverse correlation with surface roughness as expected. Although some studies have demonstrated an inverse correlation between roughness and gloss,14,35 this relation was not apparent in many studies in the literature,23,36,37 which suggests that these two variables do not necessarily correlate all the time when roughness is expressed using the Ra parameter. The increase in the gloss of PIC after bleaching with 20% CP and 35% CP could be due to a change in the refractive index of its surface caused by the degradation of the polymeric matrix and exposure of the ceramic network structure.
The findings of the current study suggest that home bleaching with carbamide peroxide should be avoided when restorations made out of PIC are present in the mouth since it would significantly affect their roughness and gloss. In-office bleaching would be safer with these materials. In case of accidental or unavoidable exposure to carbamide peroxide bleaching agents during home bleaching procedures, it is recommended to polish PIC restorations.
Although the results from in vitro testing in the current study would give insight into the surface susceptibility of different CAD/CAM ceramics to bleaching procedures, the methodology utilized would not closely simulate the in vivo dental bleaching since the presence of saliva and tooth brushing following bleaching would make the situation more challenging. Also, it would be of interest to assess the effect of bleaching on LDS and ZLS when surfaces are finished and polished compared to glazed surfaces and to compare that to studies that were conducted on conventional ceramics.
Conclusions
Within the limitations of this current study, it was concluded that:
The surface roughness and gloss of LDS and ZLS were not significantly affected by the different bleaching treatments while PIC showed a significant increase of both properties induced by 20% CP and 35% CP home bleaching treatments.
Among the materials tested, surface roughness and gloss were significantly affected by the type of ceramic material rather than the type of bleaching treatment.
Footnotes
Acknowledgements
The authors are grateful to the Advanced Dental Research Laboratory Centre of King Abdulaziz University (Jeddah, Saudi Arabia) and to all involved personnel who contributed in this research.
Declaration of conflicting interests
The author(s) declared no potential conflicts of interest with respect to the research, authorship, and/or publication of this article.
Funding
The author(s) received no financial support for the research, authorship, and/or publication of this article.