
Abstract
Objective:
To develop a low shrinkage, hydrophobic, degradation-resistant, antimicrobial dental composite using a fluorinated acrylate, and a difunctional oxirane.
Methods:
The effects of a fluorinated acrylate (2-(perfluorooctyl)ethyl acrylate; PFOEA), a difunctional oxirane (EPALLOY™ 5001; EP5001), and a three-component initiator system (camphorquinone/ethyl 4-dimethylaminobenzoate/4-Isopropyl-4′-methyldiphenyl iodonium Tetrakis (pentafluorophenyl) borate; CQ/EDMAB/Borate) on bisphenol A glycidyl dimethacrylate: triethylene glycol dimethacrylate (BisGMA:TEGDMA) composite surface hardness, degree of monomer-to-polymer conversion, hydrophobicity, translucency, mechanical properties, polymerization shrinkage and shrinkage stress, degradation, water imbibition, and antimicrobial properties were determined.
Results:
Overall the experimental composites had comparable mechanical properties and lower volumetric polymerization shrinkage and shrinkage stress as compared to BisGMA:TEGDMA controls. Addition of PFOEA increased composite hydrophobicity, but it decreased degree of cure, ultimate transverse strength, and translucency. It also decreased polymerization shrinkage and shrinkage stress. The use of the CQ/EDMAB/Borate initiator system was beneficial for the cure and mechanical properties of the 30% w/w PFOEA group. However, it decreased the hydrophobicity and translucency of those composites. The addition of EP5001, at the low concentration used in this work, did not contribute to reduced polymerization volumetric shrinkage or antimicrobial properties, but it did reduce shrinkage stress.
Conclusions:
A mechanically viable hydrophobic composite system with reduced polymerization shrinkage and shrinkage stress has been developed by adding PFOEA and EP5001. However, the addition of EP5001 did not render the composite antimicrobial due to the low concentration used. Further research is needed to determine the lowest concentration at which EP5001 provides antimicrobial activity. The composites developed here have the potential to improve longevity of traditional BisGMA:TEGDMA composite systems.
Introduction
Current direct dental composite resin restorations routinely fall short of expected clinical lifespans primarily due to secondary caries and restoration fracture.1,2 Both of these are directly related to the effects of polymerization shrinkage and related shrinkage stress, and resin degradation.
Polymerization stress can lead to microgaps that allow for leakage of saliva and bacteria, creating an opportunity for marginal staining and a nidus for secondary caries and eventual failure of the restoration, and composites have been shown to lose up to 2% of their initial mass in-vitro through elution and degradation, which can occur via hydrolysis and esterases.3,4 The released degradation by-products have been shown to modulate the proliferation and activity of intraoral bacteria such as Streptococcus mutans, a principal agent of caries development.5,6 This, in turn, has been shown to increase levels of degradation by-products due to the increased level of esterase and acid release from the bacteria, thus compounding the issue and leading to carious cavitations.7,8
Previously, an
Thus, the objective of this work was to develop a low-shrinkage, hydrophobic, degradation-resistant, antimicrobial dental composite using a fluorinated acrylate and the difunctional oxirane EP5001. Specifically, the aims were to determine the effects of adding a fluorinated acrylate and EP5001 to BisGMA:TEGDMA composites on surface hardness, cure, mechanical, shrinkage, hydrophobic, degradation, and antimicrobial properties. The hypotheses tested were that the addition of a fluorinated acrylate increases hydrophobicity and decreases composite degradation without decreasing degree of cure or mechanical properties, and the addition of EP5001 decreases polymerization shrinkage and cure stress and imparts antimicrobial activity.
Fluorinated polymers have been used in microelectronic instruments, automobile, and aviation technology for their hydrophobicity, and thermal and chemical stability stemming from the fluorine groups. This chemistry has been applied to acrylates and has been shown to significantly increase contact angle of a hydrophilic epoxy from 67° to 98°. 12 In this work, this chemistry was applied to the BisGMA:TEGDMA system via the addition of 2-(perfluorooctyl) ethyl acrylate (PFOEA), with the aim of obtaining similar improvements.
Methods
Varying concentrations of EPALLOY™ 5001 (EP5001, 0 or 5% w/w of monomer blend, CVC Thermoset Specialties) and fluorinated acrylate 2-(perfluorooctyl)ethyl acrylate (PFOEA, 0, 25, or 30% w/w of monomer blend, Oakwood Chemical) were added to a 70:30 bisphenol A glycidyl dimethacrylate:triethylene glycol dimethacrylate (BisGMA:TEGDMA, Sigma Aldrich) monomer blend and an initiator system consisting of ethyl 4-dimethylaminobenzoate (EDMAB, 0 or 1.5% w/w of monomer blend, Sigma Aldrich), camphorquinone (CQ, 0.1875 or 1% w/w of monomer blend, Sigma-Aldrich), and 4-isopropyl-4′methyldiphenyliodonium tetrakis (pentafluorophenyl) borate (Borate, 0 or 9% w/w of monomer blend, Tokyo Chemical Industry) or N,N-dimethylaminoethyl methacrylate (2% w/w, DMAEMA, Sigma Aldrich). All composites were filled to 70% w/w with 0.7 µm acrylate-silanated barium glass filler (DM Healthcare). The control was a 70:30 BisGMA:TEGDMA composite system with an initiator system of 1% w/w CQ and 2% w/w DMAEMA (Table 1).
Composite group formulations. All groups contain 70:30 BisGMA:TEGDMA and 70% w/w 0.7 µm acrylate-silanated barium glass filler.
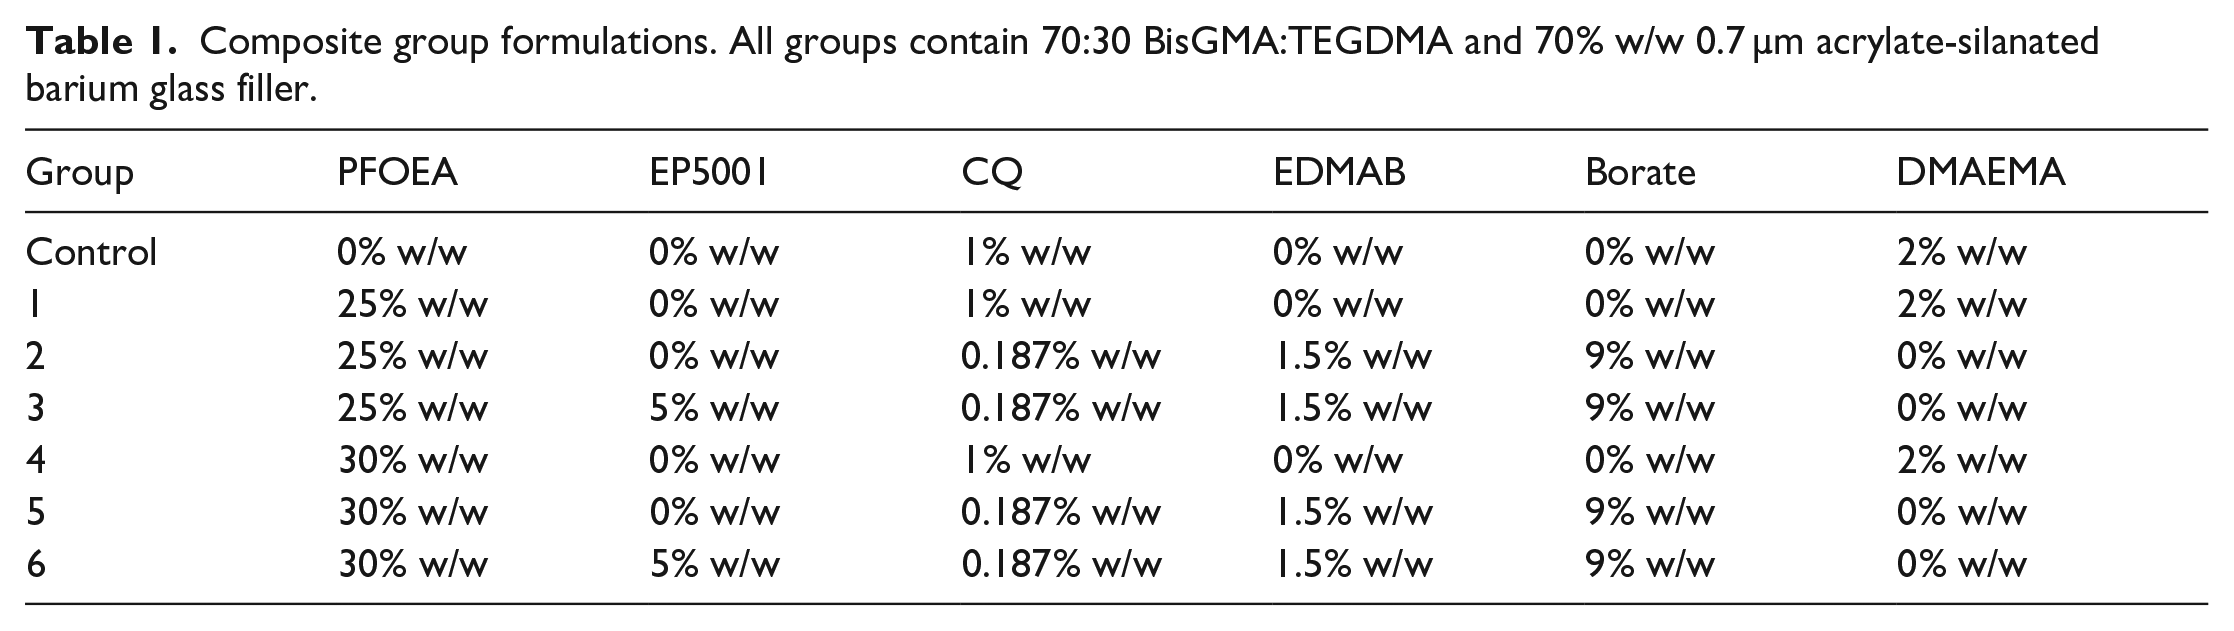
The filled monomer blends were placed in disk-shaped molds (3/8″ diameter × 1/16″ thick) between two glass slides and light-cured for 20 s on each side using a handheld light (Ultradent Valo® LED curing lamp, Ultradent Products, Inc.). Surface hardness (Rockwell15T hardness), degree of monomer-to-polymer conversion (near infrared Fourier Transform Infrared spectrometry, NIR), hydrophobicity (contact angle measurements), mechanical properties (three-point bend test), volumetric shrinkage (Acuvol), shrinkage stress (Bisco Class 1 Cavity Polymerization Stress Tester), degradation and antimicrobial activity against S. mutans, S. sanguinis, A. viscosus, and C. albicans were determined.
Surface hardness (Rockwell15T Hardness)
A Rockwell15T Hardness Tester (Wilson 3JR) was used to measure surface hardness with a 15 T ballpoint indenter of diameter 1/16″ immediately after light-curing and after 24 h of storage in deionized water at 37.5°C to measure the “dark cure” of the oxirane monomer (n = 5). Three indentations were applied to different areas of each specimen to gage evenness of cure.
Degree of monomer-to-polymer conversion (Near Infrared FTIR, NIR)
A near infrared Fourier Transform Infrared Spectrometer (NIR, Nicolet 6700 FT-IR) was used to measure the degree of conversion (DoC) of the specimens (n = 5) by measuring the reduction of the C=C acrylate peak at ~6165 cm−1 and the oxirane ring peak (in samples with EP5001) at ~4530 cm−1. 13 The heights of the absorption peaks were divided by the specimen thickness, and those values (Abs) were used to calculate the DoC using Formula 1.

Hydrophobicity (contact angle measurements)
Three 50 µL droplets of deionized water were placed on the specimen (n = 5), images of the droplets were taken 15 s after placement using a VCA1000 video contact angle instrument (AST Products, Billerica, MA), and contact angles were determined.
Translucency
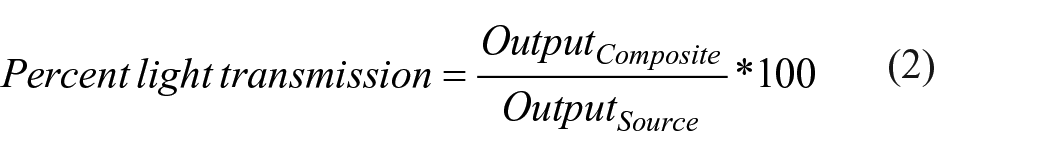
Percent light transmission through the specimens were determined as a measure of translucency (n = 5). The power intensity of a blue LED curing light was first measured using a power intensity meter (Litex). Then the composite specimen (3/8″ diameter × 1/16″ thick) was placed over the sensor and the output re-measured through the disk. The percent light transmission was calculated using Formula 2.
Mechanical properties (three-point bend test)
Cured specimens (n = 15) measuring 2 mm × 2 mm × 25 mm were stored in deionized water at 37.5°C for 24 h prior to testing. Modulus and ultimate transverse strength were determined using an Instron/MTS 1125 ReNew universal mechanical test instrument in three-point bending mode at a crosshead speed of 1 mm/min. 14
Polymerization shrinkage (Acuvol)
To measure volumetric shrinkage, a drop of the filled monomer blend was placed in the Acuvol II (Bisco, Schaumburg, IL) and then light cured for 40 s (n = 5). The initial and final volumes of the drop were measured, and the volumetric shrinkage calculated.
Shrinkage stress (Bisco polymerization stress tester)
Composites (n = 5) were bonded with Z-Primer Plus and All-Bond 3 (Bisco Inc.) to the stage of a Bisco Polymerization Stress Tester (simulated Class 1 cavity) and light cured for 40 s. The shrinkage stress generated during cure were measured until a plateau was reached.
Water imbibition and degradation
Composite disks (n = 15) were weighed (Mi) and then submerged in 5 mL of deionized water at 67°C for 2 and 4 weeks. At each time period, a set of disks (n = 5) was removed from the water bath, blotted dry, and weighed immediately (Mw). The disks were then placed in a desiccated incubator at 100°C for 24 h and weighed again at 24-h intervals until the mass stopped decreasing (Mf). Percent water imbibition was determined using Formula 3 and percent degradation was determined using Formula 4.


In vitro antimicrobial properties (ring inhibition assay)
The four microbes (S. mutans, S. sanguinis, A. viscosus, and C. albicans) were obtained from the American Type Culture Collection (ATCC, Manassas, VA). Sterile phosphate-buffered saline (PBS) and Peridex (Proctor & Gamble, Cincinnati, OH) served as negative and positive controls, respectively. A ring inhibition assay 15 was used to examine the antimicrobial potential of the control and experimental composites. Overnight (16 h) microbial cultures were prepared using Mueller-Hinton broth (MHB; Difco Laboratories, Detroit, MI). Agar plates were prepared using MHB containing 1.5% bacto agar, which was poured into 100 mm Petri dishes. The agar plates were inoculated by streaking the entire surface of the plate using a sterile swab that was saturated with the overnight culture. Plates were allowed to dry for approximately 5 min. The liquid specimens (controls) were aliquoted to filter disks (6 mm in diameter, AP Prefilter Filter Paper, Lot No. H8KM39502, Millipore Corporation, Bedford, MA; 50 µL/disk), which were then placed on the nutrient agar. The solid composite specimens were positioned on the agar surface. The agar plates were inverted and incubated at 37°C. Plates with and without inoculations were included to monitor the normal growth of the microbes. Inhibitory effects of the test agents on the microorganisms were examined by measuring the diameter of the inhibition zone after incubation for 24 or 48 h. The experiments were performed in triplicate.
Statistical analysis
All sample sizes that were used were shown to have enough statistical power from our previous studies.9,11 All data were analyzed using the analysis of variance (ANOVA) and Neuman-Keuls post hoc test to determine statistical significance between groups at a p < 0.05 level.
Results
Surface hardness (Rockwell15T Hardness)
Figure 1 shows the Rockwell15T Hardnesses of the control and experimental composites immediately and 24 h after light cure. All composites showed significant increases (p < 0.05) in hardness after 24 h. The control BisGMA:TEGDMA composites (79.5 ± 0.7 RHN immediately after cure and 84.1 ± 0.6 RHN at 24 h) had significantly higher Rockwell15T Hardnesses (p < 0.05) than all other groups at the same time point (76.4–78.4 RHN immediately after cure and 81.1–82.2 RHN at 24 h).

Rockwell15T Hardnesses of the control and experimental composites immediately (black bars) and 24 h (gray bars) after light cure. #: Significantly greater (p < 0.05) after 24 h in the same group. *: Significantly greater (p < 0.05) than all other groups at the same time point. Same lower-case letters signify statistical equivalence among groups immediately after cure. All 24-h Rockwell15T hardnesses of the experimental groups were statistically equivalent.
Right after light-curing, the change in the initiator system from CQ/DMAEMA to CQ/EDMAB/Borate did not affect surface hardness for the 25% w/w PFOEA group (both ~78.2 RHN), but it did increase hardness for the 30% w/w PFOEA group (76.4 ± 1.6–78.4 ± 1.4 RHN, p < 0.05). The addition of 5% w/w EP5001 significantly decreased hardness in the 25% w/w PFOEA group (78.2 ± 1.2 RHN to 76.8 ± 1.6 RHN), but not in the 30% w/w PFOEA + CQ/EDMAB/Borate initiator group (both ~78 RHN). However, when compared to the 30% w/w PFOEA group with the CQ/DMAEMA initiator system, there was a significant increase in hardness (76.4 ± 1.5 RHN to 77.7 ± 1.0 RHN). The CQ/EDMAB/Borate initiator system seems to be more effective in the 30% w/w PFOEA composites. Finally, right after cure, increase in PFOEA concentration from 0 to 30% w/w decreased surface hardness when the CQ/DMAEMA initiator system was used (79.5 ± 0.7 RHN to 78.3 ± 0.6 RHN to 76.4 ± 1.5 RHN for the control, 25% w/w PFOEA and 30% w/w PFOEA groups, respectively, p < 0.05), but not when the CQ/EDMAB/Borate initiator system was used (~78 RHN for both 25% w/w and 30% w/w PFOEA groups). However, at 24 h, none of the experimental groups had significant differences in hardness from each other (81.1–82.2 RHN vs 84.1 ± 0.6 RHN for the control group). Regardless, while statistically significant differences were observed, because those differences were relatively small in the overall range of hardnesses, they may not translate to differences in other properties.
Degree of monomer-to-polymer conversion (NIR)
The hardness data immediately after cure did not correlate well with the NIR data. Figure 2 shows the monomer-to-polymer C=C degrees of conversion (DoC) of controls and experimental composites. While the control group was significantly harder than all other groups at the same time points, it had similar C=C DoC to that of the 25% w/w PFOEA + 5% w/w EP5001, 30% w/w PFOEA + CQ/EDMAB/Borate initiator system and 30% w/w PFOEA + 5% w/w EP5001 groups (60% vs 61% ± 2% vs 60% ± 5% vs 57% ± 2%, respectively). The control group did have higher C=C DoC than other groups (51.6%–55.0%, p < 0.05). The use of the CQ/EDMAB/Borate initiator system did not make any difference in C=C DoC in composites without EP5001. Surprisingly, the addition of EP5001 significantly increased C=C DoC for the 25% w/w PFOEA composites but not for the 30% w/w PFOEA composites. Finally, the addition of PFOEA significantly decreased the C=C DoC from that of the control group, but there was no difference between the 25% w/w and 30% w/w PFOEA groups with the CQ/DMAEMA initiator system (60% ± 0% vs 54% ± 5% vs 55% ± 2%, respectively). However, the CQ/EDMAB/Borate initiator system increased the C=C DoC when PFOEA was increased from 25% to 30% w/w (52% ± 3% vs 60% ± 5%, respectively).
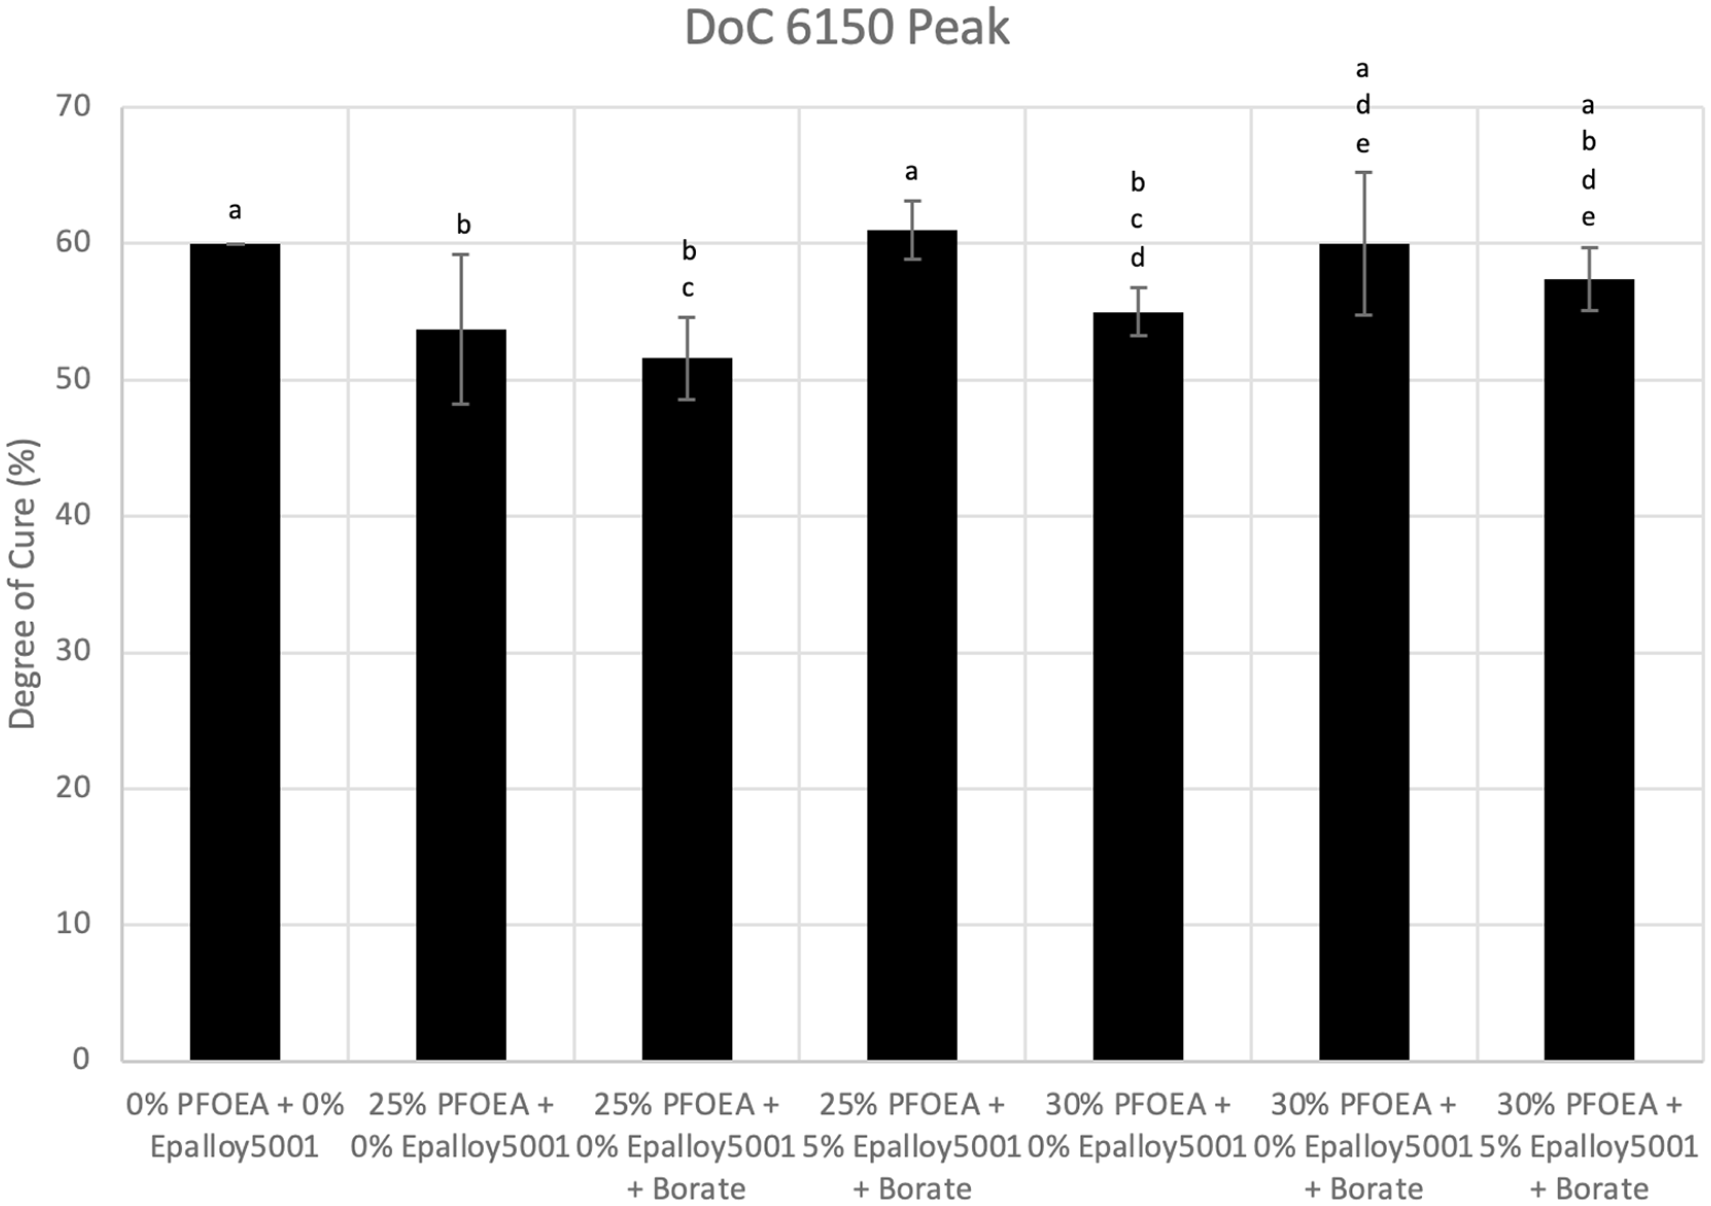
Monomer-to-polymer C=C degrees of conversion of controls (DoC) and experimental composites. Same letters signify statistical equivalence among groups.
Figure 3 shows the monomer-to-polymer oxirane DoC of experimental composites with EP5001. All EP5001-containing groups cured well at >90% DoC. There was no difference between the 25% w/w and 30% w/w PFOEA groups (93% ± 3% vs 94% ± 5%, respectively). All groups had adequate C=C DoC and very high oxirane conversions, indicating that they cured well.

Monomer-to-polymer oxirane DoC of experimental composites with EP5001. There was no statistical difference between the two groups.
Hydrophobicity (contact angle measurements)
Figure 4 shows the contact angles of control and experimental composites. All composites became significantly (p < 0.05) more hydrophilic over 24 h, with the exception of the 30% w/w PFOEA groups. All groups were significantly more hydrophobic than the control group at each time point (95°−108° vs 83°, respectively immediately after cure and 85°−107° vs 72° ± 3° after 24 h).
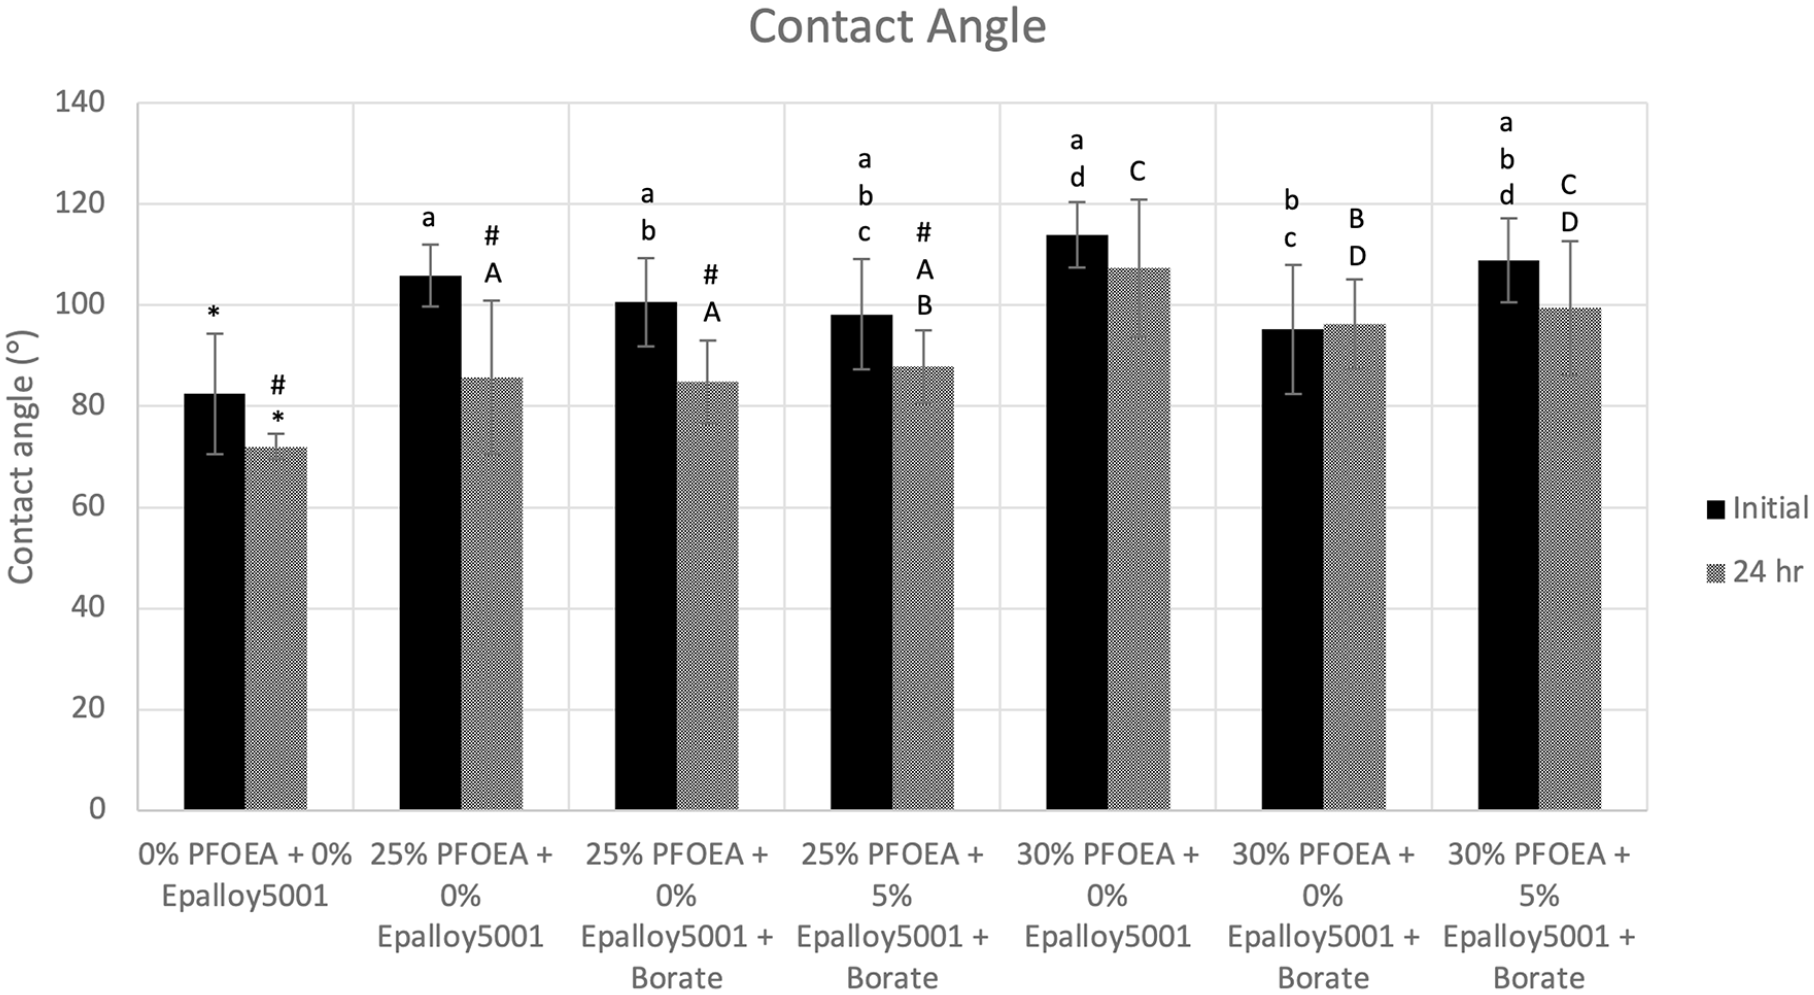
Contact angles of control and experimental composites immediately and 24 h after light curing. #: Significantly more hydrophilic (p < 0.05) after 24 h for the same group. *: Significantly more hydrophilic (p < 0.05) than all other groups at the same time point. Same lower-case letters signify statistical equivalence among groups immediately after cure. Same upper-case letters signify statistical equivalence among groups at the 24-h time point.
Contact angles significantly increased with the addition of PFOEA. However, immediately after cure, the increase of PFOEA concentration from 25% to 30% w/w did not significantly increase hydrophobicity except for the group containing 5% w/w EP5001. Regardless, at 24 h, 30% w/w PFOEA groups were significantly more hydrophobic than their corresponding 25% w/w groups (96°–107° vs 85°–88°, respectively). Groups containing 30% w/w PFOEA had the greatest contact angles and remained greater than 90° after 24 h (107° ± 14° for the CQ/DMAEMA group, 96° ± 9° for the CQ/EDMAB/Borate group, 99° ± 13° for the 5% w/w EP5001 group).
For the 25% w/w PFOEA groups, the initiator system and the addition of EP5001 did not affect hydrophobicity at each time point. Conversely, for the 30% w/w PFOEA group, the change in the initiator system from CQ/DMAEMA to CQ/EDMAB/Borate significantly decreased contact angle at both time points (114° ± 7° vs 95° ± 13°, respectively immediately after cure and 107° ± 14° vs 96° ± 9°, respectively at 24 h). The addition of EP5001 significantly increased contact angle immediately after cure for the 30% w/w PFOEA groups, but not at 24 h (95° ± 13° vs 109° ± 8°, respectively immediately after cure and 96° ± 9° vs 99° ± 13°, respectively at 24 h).
Translucency
Figure 5 shows percent light transmission of the control and experimental specimens measured using a power intensity meter. The control group transmitted significantly more light than all other groups (p < 0.05). Increase in PFOEA concentration significantly decreased the light transmission through the specimens (27.2% ± 0% vs 11.8% ± 2.4% vs 9.0% ± 0% for the control, 25% w/w PFOEA + CQ/DMAEMA and 30% w/w PFOEA + CQ/DMAEMA groups, respectively). The change in the initiator system from CQ/DMAEMA to CQ/EDMAB/Borate significantly decreased light transmission for both PFOEA groups (11.8% ± 0%–4.5% ± 0% for the 25% w/w PFOEA groups and 9.0% ± 0%–4.5% ± 0% for the 30% w/w PFOEA groups, respectively). There was no further decrease in light transmission when EP5001 was added.

Translucency as measured using percent light transmission through the control and experimental specimens. *: Significantly different from all other groups (p < 0.05).
Mechanical properties (three-point bend test)
Modulus
Figure 6 shows the moduli of the control and experimental composites as measured using a three-point bend test. Addition of PFOEA to the control group did not significantly (p < 0.05) affect the moduli of the CQ/DMAEMA groups (7836 ± 528 MPa for the control group vs 8395 ± 1348 MPa and 7675 ± 894 MPa for the 25% w/w and 30% w/w PFOEA with CQ/DMAEMA groups, respectively). The change in the initiator system from CQ/DMAEMA to CQ/EDMAB/Borate significantly increased the moduli for both PFOEA groups (8395 ± 1348–9694 ± 861 MPa for the 25% w/w PFOEA groups and 7675 ± 894–9759 ± 952 MPa for the 30% w/w PFOEA groups, respectively). The addition of EP5001 did not affect modulus in both PFOEA groups.

Moduli of the control and experimental composites as measured using a three-point bend test. Same letters signify statistical equivalence among groups.
Ultimate transverse strength (UTS)
Figure 7 shows the ultimate transverse strengths (UTS) of the control and experimental composites as measured using a three-point bend test. Increase in PFOEA concentration significantly (p < 0.05) decreased UTS from 105 ± 15 MPa for the control group to 86 ± 7 MPa for the 25% w/w PFOEA with CQ/DMAEMA group and to 68 ± 13 MPa for the 30% w/w PFOEA with CQ/DMAEMA group. The change in the initiator system from CQ/DMAEMA to CQ/EDMAB/Borate significantly increased UTS for the 30% w/w PFOEA group only (68.4 ± 13–88 ± 8 MPa, respectively). The addition of EP5001 did not affect UTS in both PFOEA groups.

The ultimate transverse strengths (UTS) of the control and experimental composites as measured using a three-point bend test. *: Significantly different from all other groups (p < 0.05).
Polymerization shrinkage (Acuvol)
Figure 8 shows the polymerization volumetric shrinkages of the control and experimental composites. All composites exhibited significantly (p < 0.05) lower volumetric polymerization shrinkage than the control (3.80% ± 0.17%). Addition of PFOEA significantly decreased shrinkage, but there was no difference between the 20% w/w and 30% w/w PFOEA groups with CQ/DMAEMA. The change in the initiator system and the addition of EP5001 did not affect shrinkage.

The volumetric polymerization shrinkages of the control and experimental composites. *: Significantly different from all other groups (p < 0.05).
Shrinkage stress (bisco polymerization stress tester)
Figure 9 shows the polymerization shrinkage stresses of the control and experimental composites. Shrinkage stress data correlated to the volumetric shrinkage data. Addition of PFOEA significantly (p < 0.05) decreased shrinkage stress as compared to the control group (2.17 ± 0.33 MPa). Shrinkage stress also decreased significantly between the 25% PFOEA group with the Borate initiator system (1.54 ± 0.30 MPa), and that which also included Epalloy (1.14 ± 0.20 MPa). The 30% PFOEA + Epalloy group (1.00 ± 0.15 MPa) also demonstrated significantly reduced shrinkage stress compared with the 30% PFOEA group with 0% Epalloy and the traditional initiator system (1.45 ± 0.25 MPa). So Epalloy decreased shrinkage stress in 25% PFOEA groups, and the combination of Epalloy and the Borate initiator system caused a similar effect in the 30% PFOEA groups.

The polymerization shrinkage stresses of the control and experimental composites. *: Significantly different from all other groups (p < 0.05).
Water imbibition and degradation
Figure 10 shows water imbibition of the control and experimental composites as measured using mass gain. Only the control group had a significant increase in mass gain between 2 and 4 weeks (2.10% ± 0.12%–2.79% ± 0.37%), likely reflecting its hydrophilicity. Interestingly, there was no decrease in mass gain with the addition of PFOEA alone at both time points. However, the change in initiator system from CQ/DMAEMA to CQ/EDMAB/Borate initiator system decreased mass gain after 4 weeks. The addition of EP5001 did not significantly affect mass gain.

The percent mass gain (water imbibition) of the control and experimental composites after 2 (black bars) and 4 weeks (gray bars). Same lower-case letters signify statistical equivalence among groups at the 2-week time point. Same upper-case letters signify statistical equivalence among groups at the 4-week time point.
Figure 11 shows the degradation of the control and experimental composites as measured via mass loss. All composites demonstrated significantly (p < 0.05) less degradation than the control (3.38% ± 1.21%) at the 2-week timepoint. At the 4-week timepoint, however, there was no significant difference between any of the groups, nor was there any difference between the 2- and 4-week data, indicating no continued loss of mass between the two timepoints.

The percent mass loss (degradation) of the control and experimental composites after 2 (black bars) and 4 (gray bars) weeks. *: Significantly greater than all other groups.
In vitro antimicrobial properties (ring inhibition assay)
The ring inhibition assay was not able to detect any antimicrobial activity in any of the groups. This is most likely due to the low concentration of EP5001 used in this work as compared to the previous work using OASys composites (5% w/w vs 25% w/w, respectively). 11
Discussion
Previously, the CQ/EDMAB/Borate initiator system and EP5001 were investigated within an Oxirane/Acrylate interpenetrating network resin System (OASys) to establish their property effects.9,11 However, despite the improvements in degree of cure and antimicrobial properties, OASys composites were weaker and more hydrophilic than control BisGMA:TEGDMA composites. Thus, in this work, we investigated whether the familiar BisGMA:TEGDMA resin system could be made hydrophobic, degradation-resistant, and antimicrobial without sacrificing mechanical properties by determining the effects of the CQ/EDMAB/Borate initiator system, EP5001, and PFOEA.
In general, despite statistical differences in surface hardness among groups, all composite formulations cured well. This was confirmed with all groups having NIR C=C DoCs greater than 50%, and the 25% w/w PFOEA + 5% w/w EP5001, 30% w/w PFOEA + CQ/EDMAB/Borate and 30% w/w PFOEA + 5% w/w EP5001 groups having similar C=C DoC’s to that of the controls. In addition, in groups with EP5001, oxirane DoCs were greater than 90%. This is despite the controls being significantly harder than all groups at each time point.
Increasing PFOEA concentration from 0% w/w to 30% w/w decreased Rockwell15T Hardness, but only immediately after cure. After 24 h, there were no differences among the experimental groups. This generally correlated with the NIR and UTS data, in that both the 25% w/w and 30% w/w PFOEA groups had lower C=C DoC and UTS than controls, with slight variations. However, the addition of PFOEA did not affect moduli.
More importantly, when PFOEA was added, the composites became significantly more hydrophobic than control composites at each time point. It should be noted that only PFOEA concentrations of 25 and 30% w/w were included in this study, as the lower concentrations did not produce composites with increased hydrophobicity. Further increase of PFOEA from 25% w/w to 30% w/w did not increase contact angle immediately after cure, however due to a drop in contact angle in the 25% w/w PFOEA groups over the 24-h period, the contact angles in the 25% w/w PFOEA groups were significantly smaller than those in the 30% w/w PFOEA groups at 24 h.
Xie et al. reported that PFEMA, a similar fluorinated polyacrylate polymer containing epoxy groups, showed a significant increase in contact angle of resins with the stepwise addition of up to 10% w/w of the fluorinated acrylate. Additionally, an increase in PFEMA was associated with a decrease in water absorption, a difference which became more pronounced with longer follow-up, up to 10 days. 12 In this work, overall improvements in hydrophobicity were most pronounced in groups with 30% w/w PFOEA, which had contact angles greater than 90°. This hydrophobicity should reduce water uptake and therefore degradation by hydrolysis.
Interestingly, the addition of PFOEA did not significantly affect water imbibition. However, it significantly decreased mass loss at the 2-week timepoint from 3.38% ± 1.21% for the control to a range of 0.45%−1.24% for the other groups. Unfortunately, no effect was noted at the 4-week timepoint, nor any difference between the 25% and 30% w/w groups. This may be due the short time period tested and may indicate that the mass loss may be due to elution rather than degradation. It probably also indicates that 4 weeks is too short of a time period to be able to measure significant degradation.
Finally, adding PFOEA also decreased composite translucency, polymerization shrinkage and shrinkage stress. Increasing PFOEA concentration from 25% w/w to 30% w/w further decreased composite translucency. This could be due to possible phase separation caused by the hydrophobicity of PFOEA as evidenced by an increase in opacity and decrease in polymerization shrinkage. This effect may be similar to that of Septodont N’Durance® composites that were reported to have a hydrophobic central group that led to phase separation during polymerization and produced a small expansion that partially offset the polymerization shrinkage. 16
Based on these results, the hypothesis that the addition of a fluorinated acrylate increases hydrophobicity and decreases composite degradation without decreasing degree of cure, translucency, or mechanical properties is partially true. It decreased degree of cure, ultimate transverse strength, and translucency. It also unexpectedly decreased polymerization shrinkage and shrinkage stress.
To isolate the effects of the initiator system from that of EP5001, composites with the CQ/EDMAB/Borate initiator system and without EP5001 were tested. The CQ/EDMAB/Borate initiator system was the same system that was successfully used for OASys resins.9,11 The Borate diaryliodionium salt relies on camphorquinone and an amine, EDMAB, to sensitize it to the blue light of a conventional dental curing light. The change from the CQ/DMAEMA initiator system to the CQ/EDMAB/Borate initiator system significantly affected surface hardness and mechanical properties. It increased the Rockwell15T Hardness of the 30% w/w PFOEA group immediately after cure (76.4 ± 1.6–78.4 ± 1.4 RHN), the modulus of both the 25% w/w and 30% w/w PFOEA groups (8395 ± 1348–9694 ± 861 MPa for the 25% w/w PFOEA groups and 7675 ± 894–9759 ± 952 MPa for the 30% w/w PFOEA groups, respectively), and the UTS for the 30% w/w PFOEA group (68 ± 13–88 ± 8 MPa). Interestingly, the change in the initiator did not increase C=C DoC. Regardless, the CQ/EDMAB/Borate initiator system seems to be more effective in the 30% w/w PFOEA composites.
These results also correlated with the contact angle data. The change from the CQ/DMAEMA initiator system to the CQ/EDMAB/Borate initiator system did not significantly alter contact angle of the 25% w/w PFOEA group, but it did significantly decrease contact angle of the 30% w/w PFOEA group. This is surprising since the C=C DoCs were not significantly different between groups with the CQ/DMAEMA initiator system and those with the CQ/EDMAB/Borate initiator system within each PFOEA group.
The change from the CQ/DMAEMA initiator system to the CQ/EDMAB/Borate initiator system also significantly decreased translucency (11.8% ± 2.4%–4.5% ± 0% in the 25% w/w PFOEA group and 9.0% ± 0%–4.5% ± 0% in the 30% w/w PFOEA group), but it did not affect polymerization volumetric shrinkage or shrinkage stress. The decrease in translucency may indicate that the PFOEA is phase separating more from the BisGMA/TEGDMA because it is curing better and maybe faster, that is, the PFOEA may be polymerizing with itself more than with the dimethacrylates. This correlates to the increased C=C DoC and may also explain the drop in contact angle of the 30% w/w PFOEA from those that used the CQ/DMAEMA to those that used the CQ/EDMAB/Borate initiator systems. The increased phase separation may be preventing the PFOEA from showing at the surface of the resin and hence decreasing contact angle.
The change to the CQ/EDMAB/Borate initiator system, however, significantly decreased water imbibition in both the 25% and 30% w/w groups, despite the contact angle not changing for the 25% w/w PFOEA + CQ/EDMAB/Borate group and a drop in the contact angle for the 30% w/w PFOEA + CQ/EDMAB/Borate group. It seems that, while the surface may not be more hydrophobic, the bulk of the resin, even with the phase separation, may still be more hydrophobic. Nonetheless, this did not translate to an effect on degradation, probably due the short time periods tested.
Based on these results, the use of the CQ/EDMAB/Borate initiator system was beneficial to the surface hardness and mechanical properties of the 30% w/w PFOEA group. However, it decreased the hydrophobicity and translucency of those composites. Nonetheless, this initiator is required for cure in composites containing EP5001.
The addition of 5% w/w EP5001 only decreased Rockwell15T Hardness of the 25% w/w PFOEA group immediately after cure (78.3 ± 1.2–76.8 ± 1.6 RHN). Otherwise, there was no effect. Interestingly, NIR results do not correlate with this, and instead, there was a significant increase in C=C DoC in the 25% w/w PFOEA group (51.6% ± 3.0%–61.0% ± 2.1%). Furthermore, the high oxirane DoC did not seem to have an effect on surface hardness. There was also no effect on modulus or UTS. This lack of correlation could be due to the fact that the observed difference in Rockwell15T Hardness, though statistically different, is actually small.
Our previous published results show that EP5001 was associated with a decrease in mechanical properties when incorporated in OASys resins. However, those composites used a much higher EP5001 concentration of 25% w/w, while only 5% w/w was used here to reduce its detrimental effects on mechanical properties. Unfortunately, this low concentration of EP5001 did not show any antimicrobial activity via the zone of inhibition assay. While it did not significantly reduce polymerization volumetric shrinkage through its ring-opening polymerization that can cause an expansion to counteract shrinkage inherent in methacrylate/acrylate polymerization, it was associated with reduced shrinkage stress. 17 This effect was previously observed at higher oxirane concentrations in unfilled OASys resins, but with concomitant compromises to mechanical properties. 9
Finally, while the addition of EP5001 significantly increased contact angle of the 30% w/w PFOEA group immediately after cure (95.2° ± 13°–109° ± 8.3°), the 24-h contact angle of the 30% w/w PFOEA + 5% w/w EP5001group dropped to 99.5° ± 13.3° and was not significantly different from that of the 30% w/w PFOEA group without EP5001. There was also no significant effect on composite translucency, degradation, or water imbibition.
Based on these results, the hypotheses that the addition of EP5001 would decrease polymerization volumetric shrinkage and impart antimicrobial activity are not true. However, the hypothesis that it would decrease shrinkage stress was true, and it was observed both in combination with the 25% w/w PFOEA and the 30% w/w PFOEA + Borate groups. It should be noted that these lower shrinkage stresses were not due to the composites having lower modulus, or due to large decreases in degrees of conversion. These are true decreases in shrinkage stresses. While it may not seem significantly beneficial to add EP5001 from these results, it is most probably due to the low concentration used. Thus, composites with higher EP5001 concentrations need to be further tested.
Now that a mechanically viable hydrophobic composite system with reduced polymerization shrinkage and shrinkage stress has been developed, it needs to be tested using a more sensitive contact inhibition test. In addition, a similar composite with a higher EP5001concentration needs to be tested to determine the minimal concentration needed for antimicrobial activity. Additionally, this composite system remains to be investigated in a commercial system at higher filler loadings.
Conclusions
Methacrylate-based composites are ubiquitous in modern dentistry, though they frequently fall short of their suggested clinical lifespans. There is potential for improvement on existing systems, particularly in the areas of reducing shrinkage, degradation, and susceptibility to microbial attack. The addition of a fluorinated acrylate has been shown here to be effective in increasing hydrophobicity and decreasing polymerization shrinkage and shrinkage stress of the BisGMA:TEGDMA system. Modification of the initiator system from CQ/DMAEMA to CQ/EDMAB/Borate increased surface hardness and mechanical properties, and decreased water imbibition. Addition of a low concentration of a difunctional oxirane was insufficient to reduce polymerization volumetric shrinkage and produce antimicrobial activity. It did contribute to reduced polymerization shrinkage stress. Addition of a fluorinated acrylate and the modified initiator system both reduced optical properties by decreasing translucency of the composite. Thus, further development with increased EP5001 concentration and longer degradation times is needed to apply these promising low-shrinkage, hydrophobic, and degradation-resistant properties to a commercial composite system.
Footnotes
Contributorship
CB researched literature, developed the research proposal, conducted testing and data analysis, and wrote the manuscript. CB was involved in specimen fabrication and testing, and data analysis. YL and WZ conducted antimicrobial testing. KW conceived the study, oversaw data collection and analysis, and provided revisions to the manuscript.
Declaration of conflicting interests
The author(s) declared no potential conflicts of interest with respect to the research, authorship, and/or publication of this article.
Funding
The author(s) disclosed receipt of the following financial support for the research, authorship, and/or publication of this article: This work was supported by a grant from the National Institute of Dental and Craniofacial Research, Grant/Award Number: U01DE023778.
Guarantor
KW.