
Abstract
Objective:
The aim of this study was to investigate the surface microhardness and roughness properties of a modified glass ionomer cement formed by adding different ratios of Chitosan, when exposed to saliva and acid erosive gastric acid cycle environments.
Methods:
Chitosan was added to conventional glass ionomer liquid at volumes of 5% and 10%. The chitosan-modified glass ionomer was used for the experimental group, and traditional glass ionomer formed the control group. All the groups were separated into two subgroups. One of these subgroups was subjected to a gastric acid erosive cycle. The other subgroup was immersed in artificial saliva. Microhardness, surface roughness with optical profilometer and AFM measurements of all the samples were taken. Qualitative surface topographic evaluations were made using a SEM. The data were analyzed by Kruskal-Wallis and Mann Whitney U-test for pairwise comparisons of the groups at the 0.05 level of significance.
Results:
The addition of chitosan to GIC had a positive effect on the microhardness values. The gastric acid erosive cycle application negatively affected the microhardness and surface roughness properties of the sample groups.
Conclusion:
The chitosan-modified glass ionomer cement samples showed clinically acceptable surface roughness values. Although the results of the addition of the biopolymer, chitosan, to GIC are promising, there is a need for further in-vivo studies.
Introduction
The use of traditional glass ionomer cement (GIC) has significant advantages such as the capability to bond alone to dental enamel and dentin tissue, to release fluoride, to inhibit the formation of caries, and to show antibacterial properties by creating a low pH environment. However, the use of GIC is limited by some disadvantages of poor mechanical properties such as fragile structure and poor long-term performance under forces, early humidity sensitivity, insufficient microhardness and resistance to wear.1,2
With the spread of the concept of Atraumatic Restorative Treatment (ART) since its introduction in the 1990s, the use of GIC has increased. It has been reported that during the application of ART, bacteria remaining alive under the restorations could continue to live and cause the failure of the restoration of caries left within the cavity.3,4 Therefore, it has become necessary for the antibacterial efficacy of GIC used in ART to be increased. Research still needs to be conducted on increasing the physical and antibacterial properties of GIC.5–8 Chitosan is a natural biopolymer derived from chitin. Due to various biological properties, chitosan, which is a biologically compatible biopolymer, is used in various applications in dentistry.6–8 Although chitosan has antibacterial properties, it is important that the addition of chitosan to glass ionomer cement does not compromise the basic physical properties of the structure.5–8
Gastroesophageal reflux (GER) is explained as leakage of the gastric stomach contents to the esophagus. That gastroesophageal reflux disease (GERD) causes dental erosion in children was reported as a consensus decision by pediatric gastroenterologists in 2009. 9 A strong correlation has been determined between GERD and dental erosion in both children and adults. 10
The microhardness and surface roughness of dental restorative materials are important. The surface roughness of dental materials is affected by many factors, both intrinsic and extrinsic. Rough surfaces cause more plaque accumulation than smoother surfaces and the material is more easily worn. 11 An enhance in the surface roughness of restorative materials is a preparatory factor for microbial colonization and is a risk for intra-oral diseases which could develop in the future. 12 Previous studies in the literature have investigated the antibacterial properties of GICs, 13 comparative microleakage values, 14 and dentin bonding strength.7,15 However, there has been no previous study that has investigated microhardness values of CH-modified GICs, and the effects of gastric acid or other intrinsic and extrinsic acids on this modified GIC.
The aim of this study was to investigate the surface microhardness and roughness of GIC samples modified with 0, 5, and 10 wt% chitosan before and after exposure to artificial saliva and gastric acid erosive cycles.
Methods
The content of glass ionomer cement (GIC) (GC Fuji IX GP EXTRA, GC Corporation, Tokyo, Japan) and low molecular weight chitosan (CH) (SKU-448869, Sigma-Aldrich, St Louis, AL, USA) used in this study are presented in Table 1. Groups were formed as the GIC and two study groups of GIC modified with the addition of 5% and 10% CH respectively.
The content of the material used and the manufacturers.

To obtain the study groups samples, 20 mg CH (Sigma-Aldrich, St Louis, AL, USA) was dissolved in 10 ml 1% acetic acid solution. Then, for the sample group of 5% CH modified GIC, 0.32 ml of chitosan dissolved in acetic acid was added to 8 g (6.4 ml) GC Fuji IX GP EXTRA cement liquid (GC Corporation, Tokyo, Japan). For the 10% CH modified GIC, a 0.64 ml CH solution was added to 6.4 ml GIC liquid.
Each sample of the groups used in the study was prepared in the ratio of 3.4 g powder/1.0 g liquid and was mixed for approximately 25–30 s at 23 ± 1°C. The working time for each sample was around 2 min. In all the groups used in the study, powder-liquid ratio and environmental conditions were performed in accordance with the manufacturer’s instructions. Each sample was then transferred to a previously prepared plexiglass mold 3 mm thick and 5 mm in diameter. The mixed cement was placed into the mold by slightly overfilling them and then two glass plates were placed on top and at the bottom of the mold, in order to prevent the adhesion of GIC to glass slab. The glass plates were held firmly during setting to avoid the presence of air bubble and to obtain a smooth surface. The GIC samples were removed from the mold after at least 6 min from the start of mixing. To prevent sample damage and microcracks on its surface, it was allowed to mature in a humid environment before being removed from the mold. Care was taken to remove all samples from the plexiglass mold at a similar time interval. Each sample obtained was examined macroscopically. Any samples with defective surfaces, cracks, or fractures were excluded from the study (see supplemental image 1 and 2). All the samples were prepared by a single researcher. The size of the group and the number of samples were calculated with 80% power taking as reference the microhardness average, 16 standard deviation and p-value in 95% confidence interval (CI).
A total of 96 samples were equally divided into three groups (i.e. 5% CH-GIC, 10% CH-GIC, and a GIC control group). Samples in each group were randomly halved, and three samples from each of the six sub-groups were randomly selected for the GAEC application. The remaining 13 samples from each sub-group were respectively placed in acid and artificial saliva. After 10 days, three samples from each of the 13-sample sub-groups were randomly selected for the GAEC application, and the remaining ten samples from each sub-group were used for the study (Figure 1).

Workflow of samples belonging to each group used in the study.
The formulation of artificial saliva was prepared as described by Klimek et al. 17 HCl/pepsin solution was prepared by dissolving 5 mg/ml NaCl in distilled water. The pH of the solution until reaching a pH meter to 1.6 (pH meter 526/538, WTW, Germany) was performed with measurement was adjusted with HCl. After that, by adding 1.5 mg/ml pepsin (4800 U/ml; P-6887, pepsin from pig gastric mucosa, 3200 U/mg, Sigma-Aldrich, Seelze, Germany) to the HCl solution, the final solution was prepared for the GAEC.
One sample from each of the groups was placed in a test tube containing 5ml artificial saliva. The samples from the GIC, 5% CH modified GIC, and 10% CH modified GIC groups were left at room temperature (23 ± 1°C) for 10 days. The artificial saliva solution in the tubes was replaced daily with freshly prepared artificial saliva.
Each sample of the groups used in the study was exposed to 5 ml gastric acid in test tubes for 60 s, were washed for 5 s in distilled water, and then placed in glass test tubes containing artificial saliva for at least 30 min. This cycle was repeated 6× a day for 10 days.
For the microhardness test, each sample of the control and study groups was applied with the Vickers microhardness test, with surface hardness measurements taken with a Buehler MMT-3 digital microhardness tester (Lake Bluff, IL, USA) before and after exposure to the GAEC. The measurements of the surface microhardness of the samples were taken at room temperature (23 ± 1°C) by applying a 300 g weight for 15 s, and the values were recorded as Vickers hardness units. A total of five measurements were done on the central region not to be closer than 1 mm to each other or to the edges. The average of this five results were accepted as a single value for each sample.
Ra values of the samples in the surface roughness test were determined by using smooth glossy surface and the surfaces were obtained by placing the glass plate on the surface of the samples. Paired-samples selected randomly from the initial groups left in the artificial saliva and those exposed to the GAEC were measured for surface roughness with the three-dimensional surface profile revealed on the optic profilometer device (Phaze View/Zee Scope, France). GetPhase software was used for the analysis. The surface roughness measurement of each sample was done on 1 mm2 area. For a single analysis, 15 images were taken by shifting 25 µm and these were combined over each other. A 5 × NA = 0.13 lens was used in the analyses.
For the surface roughness test, two-dimensional and three-dimensional images were obtained with Atomic Force Microscope Veeco Multimode 8 (Santa Barbara, CA, USA) from two different regions of randomly chosen samples from each of the initial measurement, exposure to artificial saliva only and exposure to gastric acid erosive cycle groups of the control and study groups. Images were obtained from 20 × 20 µm at the scan speed of approximately 1 Hz with the contactless Tapping Mode. Vibration frequency was determined as approximately 300 kHz. Mean surface roughness values (Ra) were determined for each sample.
The scanning electron microscope (SEM) analysis was made with a Quanta FEG 650 SEM (FEI Co., Hillsboro, OR, USA). The surface topography of the samples was evaluated according to the images of ×60 and ×5000 magnification. The samples were made conductive by coating with approximately 1 nm Au for 30 s with Q150R ES device (Quorum Technologies, East Sussex, UK) before SEM investigations.
Data obtained in the study were analyzed statistically using SPSS version 23.0 software (SPSS Inc., Chicago, IL, USA). Categorical measurements were stated as number (n) and percentage (%), and continuous data were presented as mean ± standard deviation (SD), or median, minimum, and maximum values. In the comparisons between groups of continuous variables, conformity to normal distribution was assessed, and for variables not showing parametric distribution, the Kruskal-Wallis test was applied. In paired comparisons between the groups, the Mann Whitney U-test was used on the results of the post-hoc analysis. The Wilcoxon test was applied to the comparisons of results that emerged after repeated use of the blocks. A value of p < 0.05 was accepted as statistically significant in all the tests.
Results
The Vickers microhardness test results of the samples are presented in Table 2. According to the Vickers microhardness test results of this study, the highest microhardness value was in the sample of the 10% CH modified GIC group (83.5 ± 5.5) exposed to artificial saliva only. The lowest microhardness value was determined in the GIC group with no modification that was exposed to the gastric acid erosive cycle (50.4 ± 2.1).
Results of Vickers microhardness test (n = 10).

p: Kruskal-Wallis; p*Wilcoxon signed ranks test.
The statistical difference between groups was shown as bold italic (p ≤ 0.05).
The results of the microhardness test of all the sample groups are shown in Figure 2. From the graph, it can be seen that the microhardness values of all the cement were high in the artificial saliva environment, and in the groups exposed to GAEC, the Vickers microhardness values were lowest.
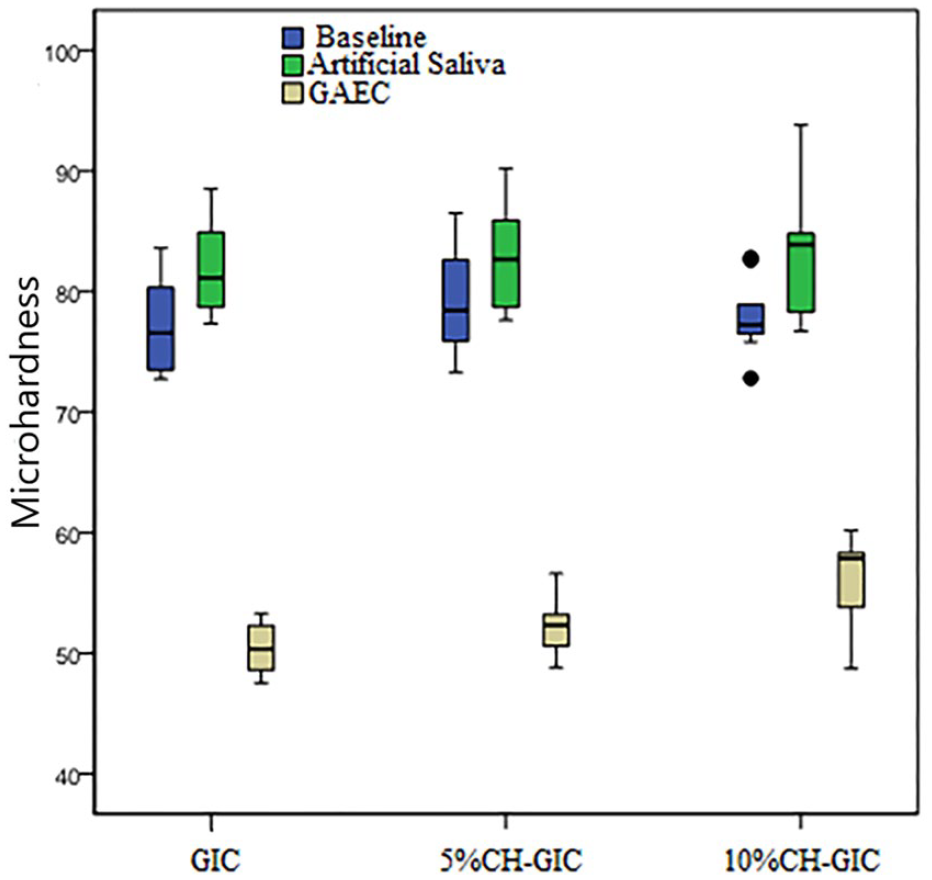
Box-plot of the microhardness test results of the samples belonging to the groups used in the study.
There was a statistically significant difference between the sample groups with GAEC (p ⩽ 0.05). It was determined that there was no statistically significant difference between the microhardness mean values of baseline and artificial saliva in the sample groups (p ⩾ 0.05). Post-hoc comparisons between groups for GAEC; 10% CH modified GIC and GIC p = 0.007; 10% CH modified GIC and 5% CH modified GIC p = 0.0001; GIC and 5% CH modified GIC were determined as p = 0.294. Binary comparisons of baseline-artificial saliva, baseline-GAEC and artificial saliva–GAEC environments of the control and experimental groups used in the study were made with the Wilcoxon Signed Ranks test. It was determined that there was a statistically significant difference between all sample groups (p ⩽ 0.05).
The mean optic profilometer surface roughness values (Ra) of the samples from each of the initial measurements, exposure to artificial saliva for 10 days, and exposure to GAEC 6× a day for 10 days groups of the control and study groups, are presented in Table 3 and Figure 3.
Results of optic profilometer surface roughness (Ra, nm).

p: Kruskal-Wallis; p*: Wilcoxon Signed Ranks Test.
The statistical difference between groups was shown as bold italic (p ≤ 0.05).

Box-plot of surface roughness test results obtained using an optical profilometer.
According to the surface roughness test results, no statistically significant difference was determined between the sample groups of the control and study groups exposed to the GAEC (p > 0.05). A statistically significant difference was determined between the initial measurements group and the groups exposed to artificial saliva only (p < 0.05). The highest surface roughness value was in the 10% chitosan modified GIC group (40.2 ± 4.6 nm) and the lowest value was in the GIC group (24.4 ± 4.2 nm).
The three-dimensional images obtained with the optic profilometer of a sample from each group with the closest surface roughness value to the mean value of that group are shown in Figure 4.

3D images of surface roughness test results obtained from samples using an optical profilometer.
The mean surface roughness results obtained from three-dimensional AFM images taken by screening a 20 × 20 µm area from the initial samples and those exposed to artificial saliva, and GAEC are shown in Figure 5. In the analysis of the AFM results, the addition of CH to the content of GC Fuji IX GP EXTRA cement was seen to have reduced the surface roughness values (Figure 6).
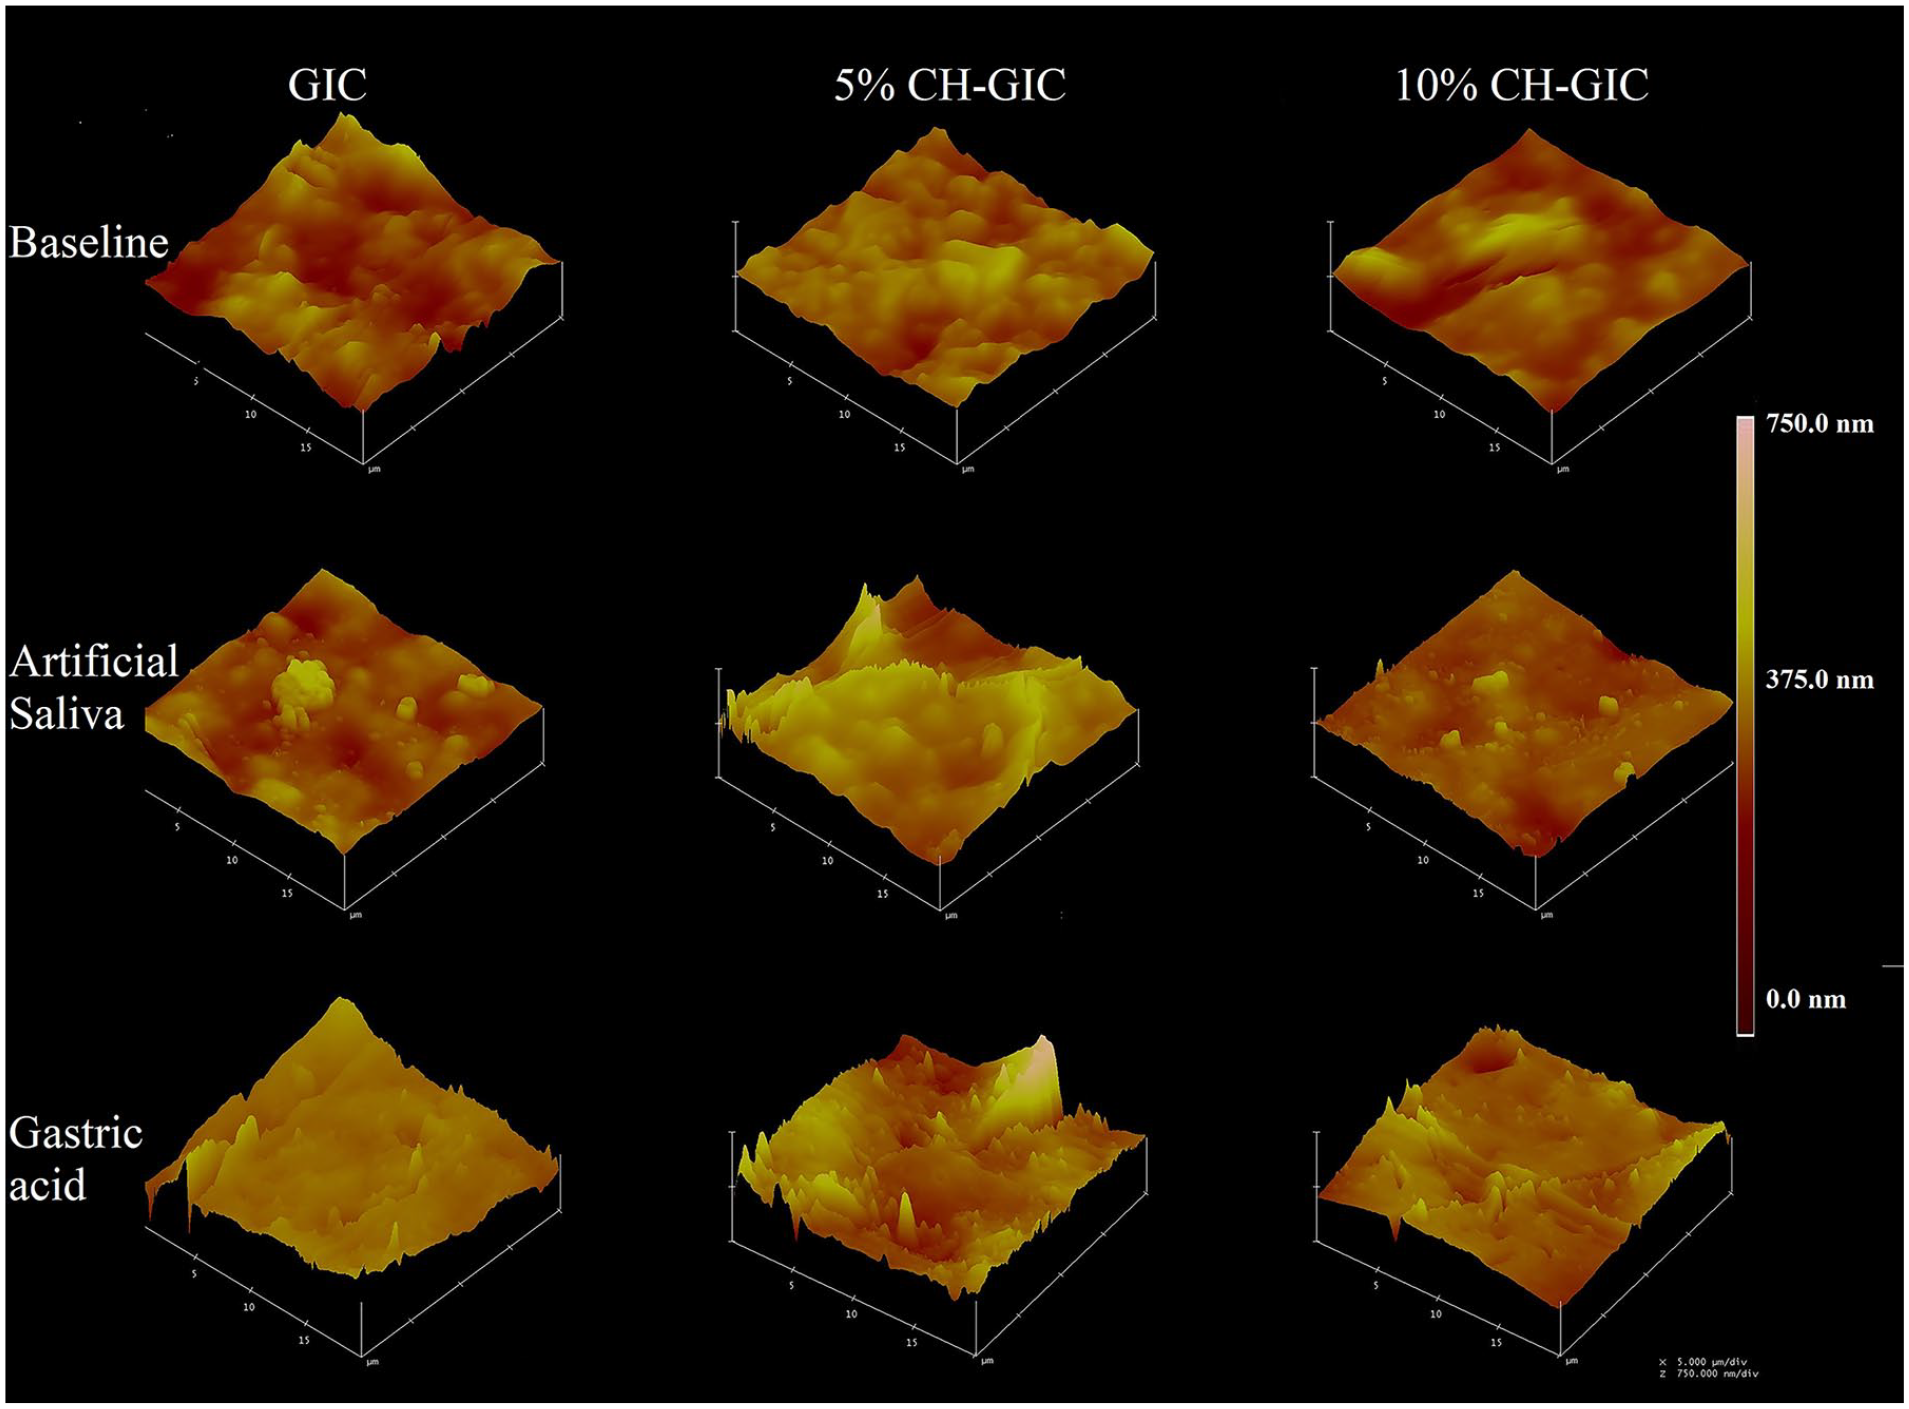
3D images of the samples used in the study obtained by AFM test.

Bar graph of the surface roughness (Ra) results obtained by AFM test of the samples used in the study.
The surface topography of the samples from each of the first measurement, exposure to artificial saliva and exposure to GAEC groups of the control and study groups were evaluated on images of ×60 and ×5000 magnification. The SEM images of the groups were presented in Figures 7 and 8, microcracks and pores were observed in all the sample groups. The surface irregularity was observed to be greater in the groups applied with GEAC.

SEM images of the samples belonging to the groups used in the study obtained with ×60 magnification. (a) GIC, (b) 5% chitosan modified GIC, (c) 10% chitosan modified GIC. (1) Baseline, (2)Artificial saliva, (3) Gastric acid.
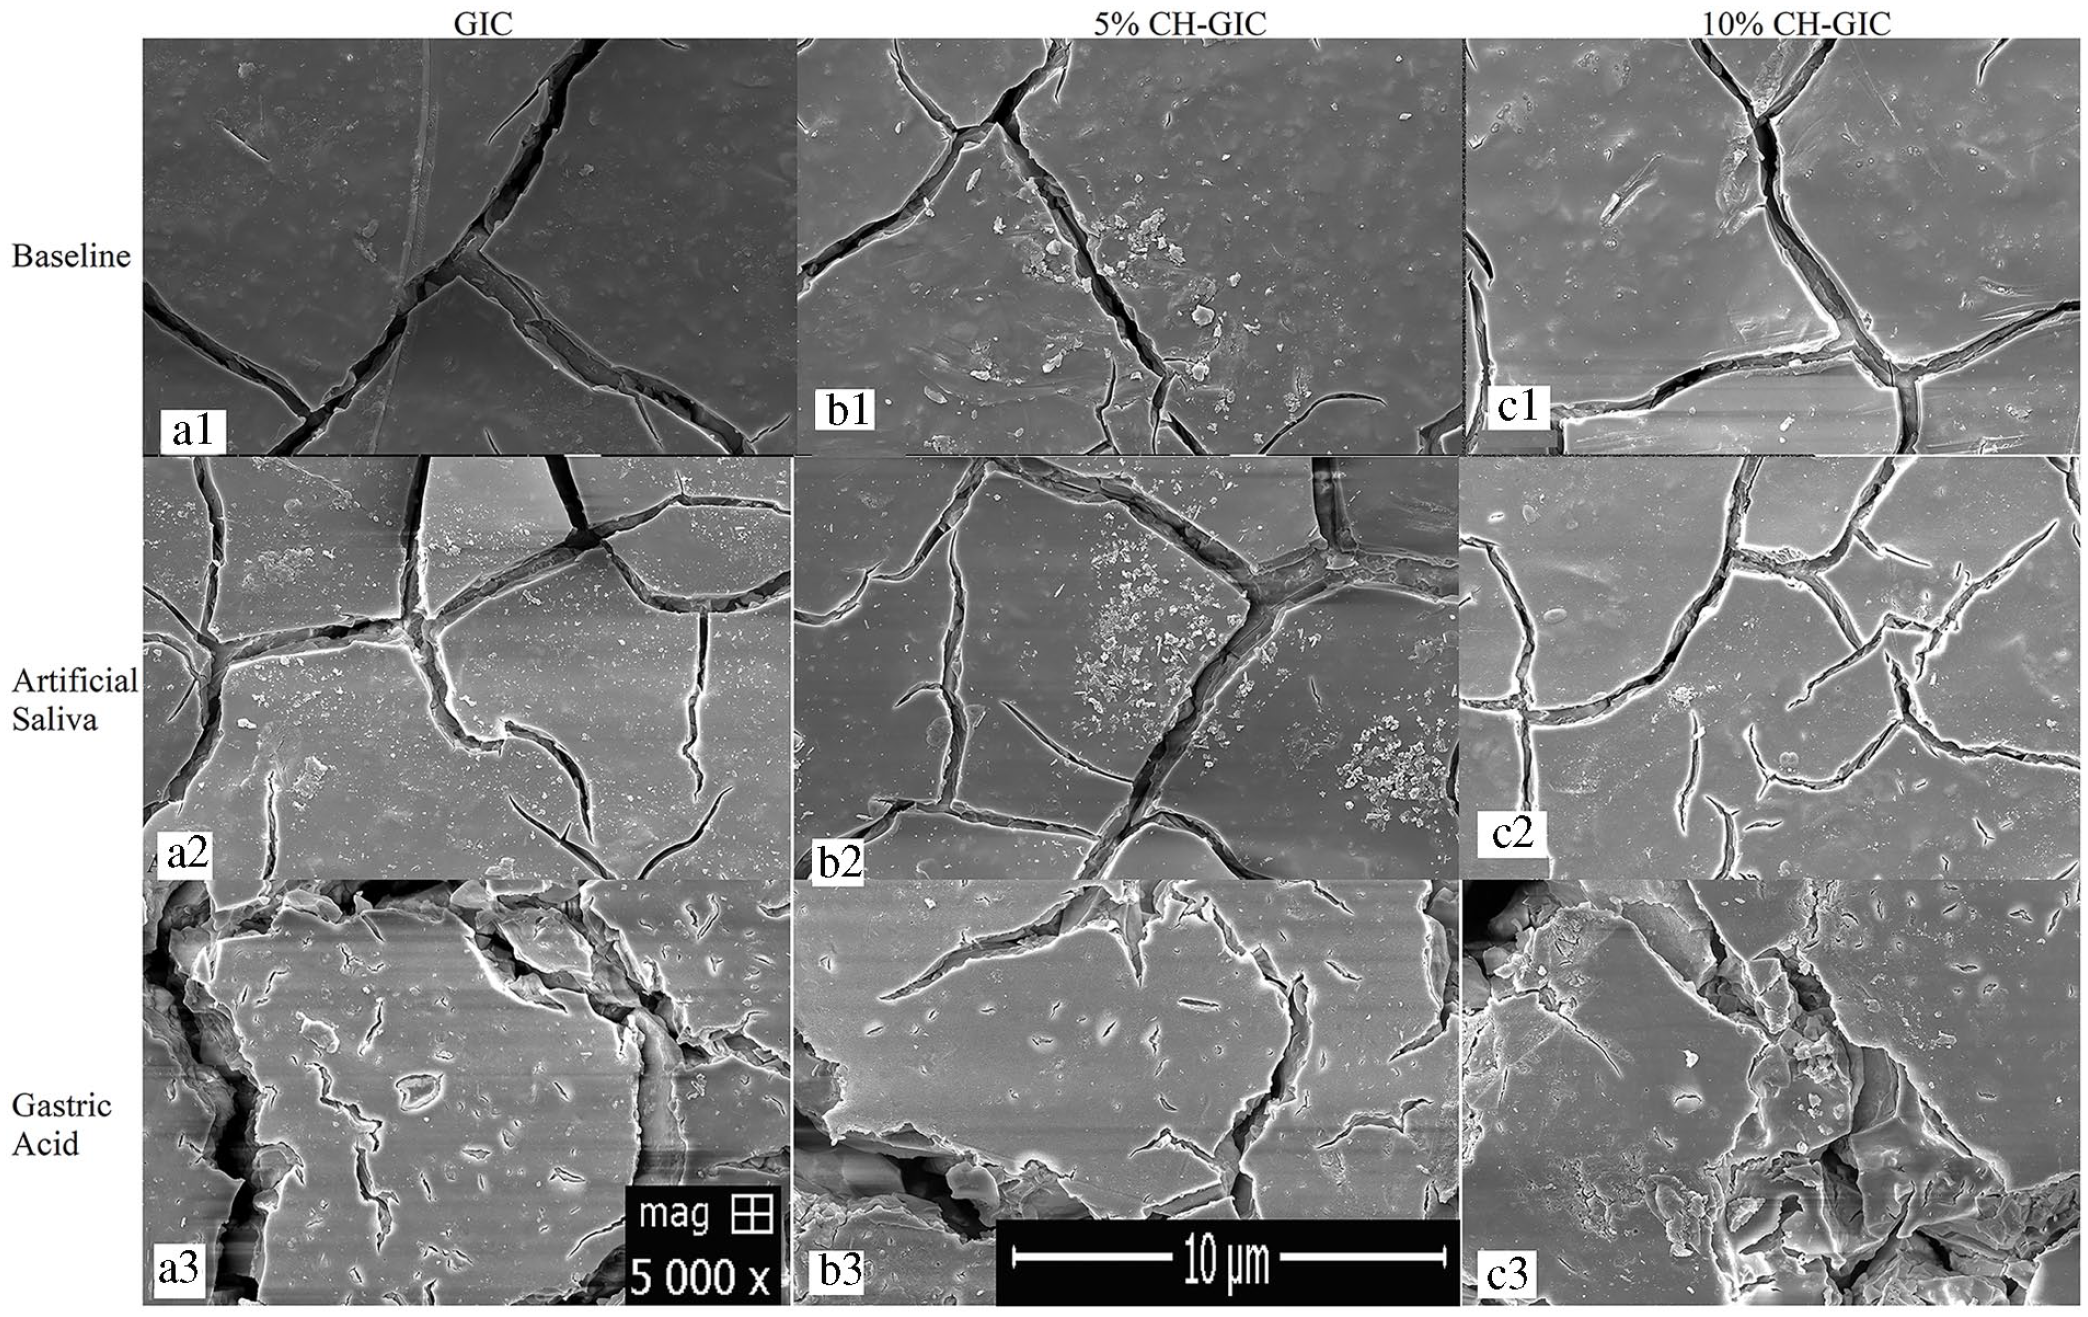
SEM images of the samples belonging to the groups used in the study obtained with ×5000 magnification. (a) GIC, (b) 5% chitosan modified GIC, (c) 10% chitosan modified GIC. (1) Baseline, (2)Artificial saliva, (3) Gastric acid.
Discussion
There are many studies in the literature related to the antibacterial properties of GICs. In these studies, substances with known antibacterial efficacy have been added to GIC; these substances include cetrimide, cetylpyridinium chloride, chlorhexidine, benzalkonium chloride,5,18 hiydroxyapatite, 19 and chitosan.7,8 Furthermore, it has been stated that the addition of antibacterial materials to GIC should not have a negative effect on mechanical properties. 14 In the current study, CH was added to GIC liquid, and the effects of this antibacterial substance on the mechanical properties of GIC were examined.
Debnath et al. 8 examined the bonding strength of GIC to the enamel surface, by adding 10% chitosan, dissolved in 1% acetic acid, to the GIC content, and reported increase in bonding strength. With the addition of chitosan at rates of 5%, 10%, 25%, and 50% by volume to the content of GIC, Ibrahim et al. 7 investigated the dentin bonding strength of chitosan-modified GIC. With increasing addition of chitosan at rates of 25% and 50% by volume, dentin bonding strength reduced and this was reported as a failure of cohesive form. In the same study, there was reported to be no statistically significant differences in bonding strength associated with microshrinkage in the GIC and GIC groups with added 5% and 10% chitosan. After dissolving CH in 1% acetic acid, Abraham et al. 14 added 10% CH by volume to GIC and evaluated the CH-modified GIC in respect of microleakage. The microleakage results were better or similar to those of GIC and thus it was reported that CH-modified GIC was promising for the future.
In the light of this information in literature, after dissolving low molecular weight chitosan in 1% acetic acid, chitosan-modified GIC samples were obtained in the current study by adding 5% and 10% by volume chitosan to the GIC liquid of GC Fuji IX GP EXTRA (GC Corporation, Tokyo, Japan), which is often used in ART.
In a study by Meurman et al. 20 there was seen to be dental erosion in 26% of patients with GER, and the reflux symptoms of patients with no dental erosion were fewer than those with dental erosion, and there was determined to be a short history of reflux in these patients. Schroeder et al. 21 examined pH measurements throughout 24 h in 12 patients with dental erosion and reflux was determined in 10 of the 12 patients. Therefore, we planned in vitro gastric acid erosive cycle application in our study. In our study, the cement samples were immersed in a gastric acid solution of pH 1.6, prepared as explained by Schlueter et al. 22 with the addition of pepsin from pig gastric mucosa to HCl. The immersed procedure was applied according to the erosive cycle described by Yu et al. 13
In a study which compared microhardness values of two different resin-modified GICs, a composite resin and surface coating restorative materials left for 5 weeks in a solution of distilled water, cola and hydrochloric acid, the microhardness values of all the restorative materials were reported to have decreased in the solution compared to the baseline values. 23 Similarly, in our study, the microhardness values of the sample groups performed GAEC were found to be lower than baseline values.
In a study by Tüzüner and Ulusu, 5 The addition of the defined antibacterial agents was reported to have decreased the microhardness values. In our study, the addition of 5%, and 10% CH, which is an antibacterial agent, to the liquid content of Fuji XP GP Extra GIC increased the microhardness values but this was not determined at a statistically significant level.
Although the current study sample groups with 5% and 10% CH added which were left in artificial saliva only had higher microhardness values than the baseline values, the sample groups applied with GAEC showed a decrease in microhardness values. A statistically significant difference was determined between the microhardness values of the GIC, 5% and 10% CH modified GIC groups and the initial artificial saliva, initial gastric acid and artificial saliva-gastric acid groups. Higher microhardness values were determined following the gastric acid erosive cycles of the 5%, and 10% CH modified GIC groups compared to the control GIC group. The addition of CH to GIC content was seen to increase the surface microhardness resistance to the GAEC process.
In our study, optic profilometer and AFM were used to evaluate the surface roughness properties of the samples. For the measurement of surface roughness, an optic profilometer device (phase View, ZeeScope, France) was used. In addition to detailed, rapid, and sensitive measurements, the optic profilometer can provide three-dimensional images of the measured surfaces. In the current study, three-dimensional images and Ra values were also obtained using an atomic force microscope (AFM) in the evaluation of surface roughness. Scans were made of a 1 mm2 area with the optic profilometer, and with the AFM, surface roughness images were obtained of a 20 × 20 µm area (Figure 5).
From the results of the current study, it was determined that the addition of 5% and 10% CH to GIC liquid did not increase the surface roughness of GIC. This suggests that the addition of CH dissolved in 1% acetic acid did not lead to roughness in the prepared GIC surface structure. The Ra roughness values of the 5% CH modified GIC group were determined to have decreased compared to the initial roughness values of the sample groups. The surface roughness values were determined to have increased in the groups with 5% and 10% added CH left in artificial saliva for 10 days.
When the samples applied with gastric acid erosive cycles were evaluated, no significant difference was determined between the groups in respect of the roughness Ra values. In the surface roughness evaluation with an optic profilometer, all the results in the current study were determined to be below the critical Ra value (200 nm), which was accepted as a clinical indicator of bacterial colonization by Bollenl et al. 12 This demonstrates that the material used was clinically acceptable in respect of surface roughness even after the application of erosive cycles.
In a study by Silva and Zuanon 11 which evaluated surface roughness values after hardening of four different traditional GICs used in ART, it was reported that with the exception of the Vitro molar GIC group, all the other groups had roughness values below the clinically accepted Ra value determined by Bollenl et al. 12 and there were cracks and gaps on the SEM images. Despite the parallelism seen in the current study, the roughness values of the current study were well below the values of that study, which could be attributed to the differences in preparation methods or measurement methods. In the evaluation of the roughness properties of the GICs in the current study, the Ra values shown in the optic profilometer and AFM results were determined to be consistent with each other.
When the AFM results of the current study were examined, just as the optic profilometer results showed that the addition of CH to GIC Fuji IX GP Extra liquid reduced roughness, this was also seen in the AFM method quantitatively determining roughness. Although the AFM examination was made of one sample representative of each group, it can be said that the Ra results obtained were similar to the optic profilometer results. The highest Ra values in the AFM results were obtained in the GIC samples applied with GAEC (Figure 6). As the Ra values obtained with optic profilometer and with AFM were <0.2 µm in all the sample groups, they were determined to be within clinically acceptable limits.
Briso et al. 23 examined the surface roughness changes of different restorative materials containing GIC after immersion in different solutions of water, Sprite® and gastric acid for 5 weeks, and reported that the baseline Ra value of the GIC group was 65 nm and this value was 62 nm after having been left in water and 139 nm after the application of gastric acid. The difference in the results of the current study from this previous similar study can be attributed to the exposure time of the samples to gastric acid and the materials used.
Scanning electron microscope examination was applied to all the groups in this study, but the examination was restricted to one sample representative of each group. When the images of Figures 7 and 8 were examined, cracks and gaps were seen in control and study groups. Furthermore, it was observed that (Figure 8(a3), (b3), and (c3)) an increased number of cracks and the formation of separations from the surface in the group applied with GAEC. These changes can be explained by the increase in the concentration of H+ ions in the cement surface, as known by Fukazawa et al. 24
In this in-vitro study, the evaluation was made of the microhardness and surface roughness properties of GIC modified with the addition of the biopolymer, CH, and applied with artificial saliva to mimic normal individuals and with GAEC to simulate reflux disease. These simulations made within the bounds of the study were applied in in-vitro conditions. The buffering capacity of saliva or the occlusal interactions when chewing and the interaction of nutrients taken from outside were not reflected. Therefore, there is a need for further in-vivo studies to support the results obtained in this study.
Conclusion
In this in-vitro study, CH modified GIC was produced with the addition of CH to GIC. The microhardness and surface roughness results of these cement in artificial saliva and gastric acid environments within the bounds of this study are presented.
Glass ionomer cement, which is added to chitosan, is expected to be less affected by the oral environment without losing its mechanical properties. The addition of CH to GIC had a positive effect on both the microhardness and surface roughness results. Therefore, its use in the mouth is promising.
The microhardness values of the 5% and 10% CH modified GIC groups were less affected by gastric acid. CH modified GIC is promising in patients with GERD due to its relatively low effectiveness of gastric acid erosive cycle. When the sample groups were evaluated in respect of surface roughness, the results of all the groups were determined to be <0.2 µm.
Supplemental Material
sj-pdf-1-jbf-10.1177_2280800021989706 – Supplemental material for The effects of chitosan addition to glass ionomer cement on microhardness and surface roughness
Supplemental material, sj-pdf-1-jbf-10.1177_2280800021989706 for The effects of chitosan addition to glass ionomer cement on microhardness and surface roughness by Koray Soygun, Arzu Soygun and Muharrem Cem Dogan in Journal of Applied Biomaterials & Functional Materials
Footnotes
Author contributions
KS and AS researched literature and conceived the study. KS, AS, and MCD were involved in protocol development, writing the financial project. All the authors, KS, AS, and MCD, were involved in data collection and data analysis. KS wrote the first draft of the manuscript. All authors reviewed and edited the manuscript and approved the final version of the manuscript.
Declaration of conflicting interests
The author(s) declared no potential conflicts of interest with respect to the research, authorship, and/or publication of this article.
Funding
The author(s) disclosed receipt of the following financial support for the research, authorship, and/or publication of this article: This work was partially supported by Cukurova University Scientific Research Project (TDH-2018-9924).
Guarantor
KS.
Supplemental material
Supplemental material for this article is available online.
References
Supplementary Material
Please find the following supplemental material available below.
For Open Access articles published under a Creative Commons License, all supplemental material carries the same license as the article it is associated with.
For non-Open Access articles published, all supplemental material carries a non-exclusive license, and permission requests for re-use of supplemental material or any part of supplemental material shall be sent directly to the copyright owner as specified in the copyright notice associated with the article.