
Abstract
Objectives:
The aim was to assess the influence of polymerization duration, method and resin manipulation techniques on the biaxial flexural strength (BFS) and degree of conversion (DC) of bulk fill resin composites (BFRC).
Methods:
One hundred and eighty disc specimens were fabricated using MultiCore (MC) and Core-It (CI) bulk fill resin composite. Each material group, specimens were divided into nine subgroups based on curing methods (Light cure for 10 and 20 s; and auto-cure) and mixing techniques (first auto-mix, second automix, and hand mix). BFS was tested with a ball indenter at a crosshead speed of 0.50 mm/min. DC was assessed for MC and CI materials for 10 s and 20 s light cure; and auto cure specimens using Fourier Transform-Infrared Spectroscopy (FTIR). Statistical data comparisons were performed using ANOVA, Bonferroni and Tukey-Kramer tests.
Results:
For MC and CI, BFS was highest in 10 s light cure specimens, however comparable to specimens cured for 20 s (p > 0.05). Auto cure specimens showed lower BFS than light cured samples for both materials (p < 0.05). Hand mixed specimens showed significantly compromised BFS compared to automix technique for MC and CI. DC % was comparable for 10 s and 20 s light cure methods for both materials (p > 0.05), which was higher than DC % of auto cure bulk fill resins (p < 0.05). CI showed higher DC % and BFS compared to MC bulk fill resin composite.
Conclusion:
Photo-polymerization duration of 10 and 20 s showed similar outcomes for BFS and DC %; and BFS for auto-mixed resins (MC and CI) was significantly higher than hand mixed resin. BFS and DC was higher in photopolymerized groups as compared to auto-cured resin regardless of the manipulation technique for both materials (MultiCore and Core it).
Introduction
The superior esthetics, low toxicity, minimum need for tooth preparation and mechanical properties that are comparable with natural tooth, resin-based composites (RBCs) have long replaced Silver amalgam as the material of choice in anterior and most posterior restorations. 1 The development of high molecular weight, bi-functional monomer called bisphenol A-glycidyl methacrylate (bis-GMA or Bowen’s resin) and acid-etching technique, triggered the development of composite resins in clinical dentistry. 2 It is suggested that lower filler particle size and broader particle size distribution enhances the filler loading of the RBCs, thereby reducing polymerization shrinkage and improving mechanical properties such as flexural and tensile strength.3–6 Mechanical properties are critical for clinical success, as restorations are subjected to cyclic masticatory forces leading to fatigue, initiating crack propagation and premature restorative failure. 5 In addition, resin composites employed as Bulk fill materials aimed to support and strengthen damaged tooth, should possess optimal compressive and flexural strength to resist compressive forces and bulk fracture.
Bulk fill resin composites are developed to improve the depth of cure, simplify the restoration for core build-ups and provide efficient replacement of moderate to severe tooth decay. Bulk fill materials claim to have optimal depth of cure up to 4 mm of material thickness, however multiple factors including filler particle size and content, photo initiators, type of light source and intensity, polymerization technique and duration influence their degree of conversion.7,8 The degree of conversion of monomers to polymer chains is critical for development of optimal physical and mechanical properties of materials.9,10 In addition, a low degree of conversion and presence of residual monomers, promote material solubility and water sorption resulting in degradation of resin composites and restorative failures. 11
With the development of light-curing devices and polymerization modes, high intensity and faster initial irradiance proposes to provide high degree of conversion along with reduced exposure time as supported by the Bunsen–Roscoe reciprocity law. 12 However shorter targeted irradiance exposure at specific high intensity and desired wavelength, are gaining popularity for producing optimal conversion rates and material properties. 13 This high intensity short polymerization technique also proposes to overcome the problems associated with layering techniques like voids and contamination between layers. 11 In a recent study by Par et al., influence of high intensity of photo-polymerization was assessed on the micro-hardness (MH) of resin composite. 14 High intensity short duration curing showed controversial hardness outcomes; furthermore, they did not assess the degree of conversion (DC) and flexural strength of the polymerized resins. 14 In addition to curing modes, the impact of mixing methods has a critical impact on strength of other restorative materials like glass ionomer cements. 15 However, to our knowledge from indexed literature, studies investigating and comparing the flexural strength and DC of bulk fill resins following high intensity short duration photo-polymerization and auto-polymerization using auto-mix and hand-mix techniques are limited.
It is therefore hypothesized that polymerization duration and modes will have a significant influence on flexural strength and DC of bulk fill resins. Secondly, resin mixing technique will affect the flexural strength of bulk fill resins. The aim of the present study was to evaluate the bi-axial flexural strength and degree of conversion of bulk-fill composite polymerized at different durations (10 s and 20 s) and modes (Light-cure and auto-cure) along with variable mixing methods (automix and hand mix).
Methods
The study was conducted and reported in accordance with the checklist for reporting in-vitro studies (CRIS).
Specimen preparation
The resin composite core build-up bulk fill materials included were MultiCore® Flow (MC) (Ivoclar Vivadent AG, Schaan, Liechtenstein) and Core-it® Dual yellow (CI) (SPIDENT CO., LTD, Incheon, Republic of Korea). Ninety specimens of 10 mm diameter and 2 mm thickness for each material (MC and CI) were prepared. A custom-made stainless-steel mold was secured on a glass slide and resin materials were injected. The material was covered with an acetate strip (KerrHawe, Bioggio, Switzerland) and a glass slide, the excess material was extruded and a uniform surface finish was achieved. The materials were either photo-polymerized using a dental curing unit (Bluephase®, Ivoclar Vivadent AG, Schaan, Liechtenstein) for 40 s at a constant distance of 3 mm (430-550 nm and 1000 mW/cm2), or allowed to chemically cure as per the assigned study group. Fabricated specimens were stored in distilled water at 37°C for 1 week.
Study groups
For biaxial flexural strength (BFS), Ninety specimens in each material groups (MC and CI) were initially divided into three groups (n = 30), (A) Photo-polymerization (light cure) for 10 s, (B) Photo-polymerization for 20 s, and (C) Auto-polymerization (chemical cure) for 4 min, following manufacturer’s recommendation. Each of these groups (A, B, and C) were further subdivided into three subgroups, subgroup I – bleeding or first mix group, subgroup II – second mix group (after bleeding), and subgroup III – hand mixed group (Figure 1). This resulted in nine groups within each material group and a total of 18 study groups for assessment of BFS. For bleeding or first mix (subgroup I), a new auto-mix tip (Intra Oral Tips, Refill, 604210- Ivoclar Vivadent AG, Schaan, Liechtenstein) with a length of 20 mm and a diameter of 3 mm, was placed on the dispensing syringe for MC and CI materials. The initial resin materials were injected or bled into the metal mold until complete fill. For second mix specimens, the same auto-mix tip from the bleeding group was used and bulk fill composite was injected into the mold, followed by removal of auto-mix tip. Each auto-mix tip was used only for one specimen for each subgroup (I and II). For the hand mixed specimens (III), material was mixed using a spatula and non-absorbing paper pad. Mixing was performed using Figure 8 mixing technique with 1:1 ratio of base and catalyst material for 15 s until a homogeneous color was obtained. Using an unused spatula, the mixed material was carried into the metal mold. 16 All specimens were stored in distilled water for 1 week prior to testing of biaxial flexural strength.

Group distribution for biaxial flexural strength assessment.
Degree of conversion assessment was performed in the two study materials (MC and CI), divided into three groups each, (A) Photo-polymerization (light cure) for 10 s, (B) Photo-polymerization for 20 s, and (C) Auto-polymerization (chemical cure) for 4 min resulting in a total of six groups (MC-A, MC-B, MC-C, CI-A, CI-B, and CI-C). Five specimens were assessed in each group, fabricated with a putty mold (2 mm × 3 mm). The mold kept the material in standard shape and quantity for each tested sample.
Bi-axial flexural strength test
Biaxial flexural strength test was performed using a Universal testing machine (Instron- Model 5965, Instron Corp., MA, US). The device set-up contained three stainless steel balls supporting the specimen (Figure 2). Each ball had a diameter of 4 mm and was equally spaced along the periphery of a 7 mm diameter supporting circular platform. The specimens were loaded at the center until fracture using a piston with a stainless-steel ball of 4 mm diameter with a cross-head speed of 0.50 mm/min. The biaxial flexural strength of the ball-on-three-ball test was calculated using the following equation 17 :


Where P is the maximum load exerted on the specimens prior to fracture, v is the Poisson ratio of the resin composite (0.24), c and t are the radius and thickness of disk, respectively, a is the radius of the supporting circle and r0 is the ball’s radius used on loading surface.
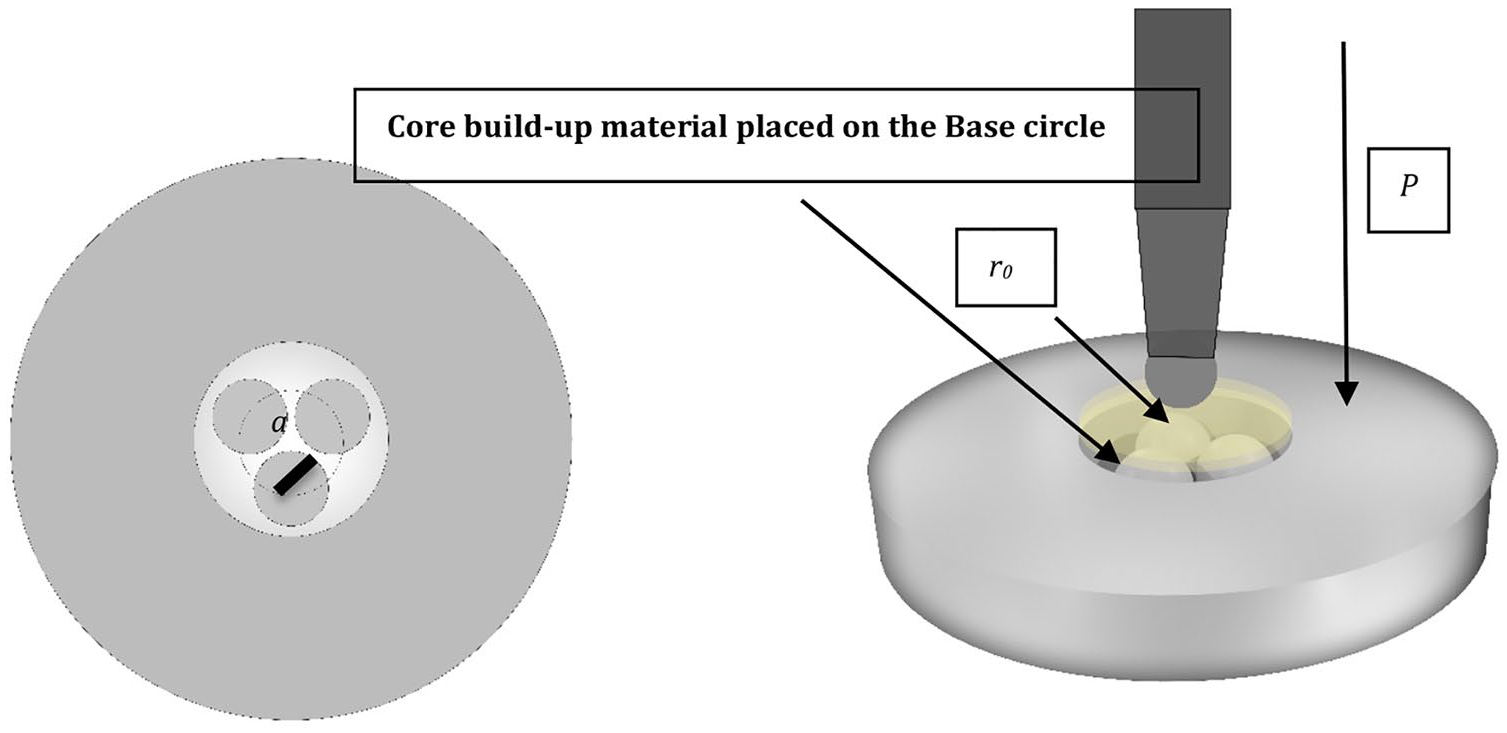
Schematic representation of the biaxial flexural strength test setup.
Degree of conversion
To evaluate the degree of conversion (DC), both materials (MC and CI) were divided into three groups based on the curing techniques, P-10: Photo-polymerization (light cure) for 10 s, P-20: Photo-polymerization for 20 s, and AC-4: Auto-polymerization (chemical cure) for 4 min, following manufacturer’s recommendation. DC assessment was performed using transmission Fourier Transform-Infrared Spectroscopy (FTIR) (Thermo Scientific Nicolet iS20 FTIR spectrometer, MA USA). The non-polymerized bulk fill material (2 mm × 3mm) was placed directly on the potassium bromide disc (Shimadzu, Kyoto, Japan) using a mold. The FTIR spectrum was determined in real-time. The C-C bonds were identified and peaks were recorded. Analysis of spectra was performed with the material still in contact with sensors. For sub-groups A and B in both material groups (MC and CI), the materials were subsequently photopolymerized for 10 s and 20 s respectively and the FTIR spectra for cured resin was assessed as explained earlier. Photo polymerization as standardized at 4mm distance with a dental light-curing unit (Bluephase®, Ivoclar Vivadent AG, Schaan, Liechtenstein) with wavelength of 430 to 550 nm and 1000 mW/cm2 intensity. The spectrum was measured on the surface diameter of 800 μm, with a spectral range of 650 to 4000 cm−1 at 8 cm−1 resolution. For hand mixed group, the base material for both materials was initially assessed followed by hand mixing of the material and auto-cure for 4 min. Following the designated duration, the material was assessed for spectra.
The percentages of DC were determined by obtaining the C=C peak at 1634 cm−1 and C-C reference peak at 1608 cm−1 using an established method.18,19 The ratios of intensities (C=C and C-C) and percentage of unreacted double bonds in materials assessed was determined using the following equation, 20

Where,
C aliphatic is 1634 cm−1 absorption peak of polymerized resin,
C aromatic is 1608 cm−1 absorption peak of polymerized resin,
Ualiphatic is 1634 cm−1 absorption peak of unpolymerized resin, and
Uaromatic is 1608 cm−1 absorption peak of unpolymerized resin.
Statistical analysis
Normality of the data acquired was assessed using Kolmogorov-Smirnov test. Bi-axial flexural strength and DC of specimens in different groups among individual material was compared using one-way analysis of variance (ANOVA), with an alpha level of significance of 0.05 set at 95% confidence interval. Differences in mean flexural strength in the same material and between the two materials was determined using the Bonferroni multiple comparisons test. DC among the groups was compared using Tukey-Kramer multiple comparisons test.
Results
Biaxial flexural strength
The means and standard deviations (SD) for BFS among subgroups within MultiCore (MC) material are presented in Table 1. Among the MultiCore® specimens, maximum bi-axial flexural strength was shown by specimens made with second mix (subgroup II) and photopolymerized for 10 s (77 ± 2.92 MPa). Lowest flexural strength was demonstrated by hand mixed specimens (subgroup III) that were Auto polymerized for 4 min (56 ± 4.5 MPa). The difference among all the groups was significant (ANOVA, p < 0.01). Within polymerization technique groups (A, B, and C), specimens in groups A and B, exhibited statistically similar (p > 0.05) strength among different mixing groups (I, II, and III), except subgroup II which showed higher (p < 0.05) strength for group A then group B specimens (Table 1). In all three mixing subgroups (I, II, and III), BFS among groups A and B specimens were significantly higher than group C (auto-cure) (p < 0.05). Within mixing technique groups (I, II, and III), subgroup I and II showed significantly higher strength values (p < 0.05) than specimens in subgroup III (hand mix), respectively.
Biaxial flexural strength (MPa) of MultiCore (MC) specimens.

mix: mixture.
Dissimilar superscript capital alphabets in same column show significant difference. Dissimilar superscript small alphabets in same row show significant difference (p < 0.05).
ANOVA.
The mean and SD, among Core-it® specimens are presented in Table 2 (Figure 3). Among the specimens of CI material, maximum bi-axial flexural strength was shown by specimens made with first mix (subgroup I) and photopolymerized for 10 s (85.2 ± 5.9 MPa). Lowest flexural strength was demonstrated by hand mixed specimens (subgroup III) that were Auto polymerized for 4 min (37 ± 10.6 MPa). The difference among all the groups was significant (ANOVA, p < 0.05). Among the polymerization technique groups, specimens polymerized for 10 (group A) and 20 s (group B) showed significantly higher (p < 0.05) strengths compared to auto cured specimens (group C), for all mixing subgroups (I, II, and III). The mixing technique did not show any influence on flexural strength of auto-cured specimens (group C), as they showed comparable strength outcomes (p > 0.05) among the three mixing groups (I, II, and III) (Table 2). However CI specimens in groups A and B, showed significantly higher (p < 0.05) strength values in first mix specimens compared (group I) to second mix specimens (group II). Similarly, second mix specimens (group II), exhibited significantly higher (p < 0.05) strength values than hand mixed specimens.
Biaxial flexural strength (MPa) of Core-it (CI) specimens.

mix: mixture.
Dissimilar superscript capital alphabets in same column show significant difference. Dissimilar superscript small alphabets in same row show significant difference (p < 0.05).
ANOVA.

Comparative evaluation of biaxial flexural strength among study groups.
Overall, specimens that had been hand mixed, show lower resistance to flexural load when compared to other mixing technique and the difference was statistically significant (p = 0.003) (Figure 3). Specimens made from Core-it® showed better flexural strength than specimens made from MultiCore® (p = 0.02 for 10 s, p = 0.004 for 20 s) however, when compared with the chemically cured group, the results of Core-it® specimens showed reduction in the flexural strength (p = 0.3).
Degree of conversion
The FTIR spectrum observed is presented in Figure 4. The C=C peak at 1634 cm−1 and C−C reference peak at 1608 cm−1 were utilized to calculate the DC for the materials among the groups. The peaks Table 3 shows the outcomes of degree of conversion for the specimens tested. The maximum and minimum DC was observed in CI specimens photopolymerized for 20 s (65.2 (4.1)%) and CI auto cured specimens (39.3 (4.5)%), respectively. DC was significantly higher in CI specimens of P-10 (63.5 (4.6)%) and P-20 (65.2 (4.1)%) compared to MC specimens (P10: 58.6 (4.4)%–P20: 60.6 (3.8)%), respectively (p < 0.05). However DC in CI specimens was significantly lower than MC specimens in auto cured subgroup (p < 0.05) (CI: 39.3 (4.5)%–MC: 46.7 (4.3)%). Within each material group for both CI and MC, specimens in P-10 and P-20 groups DC was significantly higher as compared to specimens in auto cure specimens (p < 0.05).

FTIR spectrum showing the peaks at 1634 cm−1 and C-C reference peak at 1608 cm−1 to calculate DC among study groups.
Degree of conversion (DC), in % of the assessed specimens.

P: photopolymerized; AC: auto cured.
Dis-similar superscript capital alphabets in same column denote statistical significance. Dis-similar superscript small alphabets in same row denote statistical significance.
ANOVA.
Discussion
The present study was based on the hypothesis that polymerization duration and modes, have a significant influence on flexural strength and DC of bulk fill resins. In addition, resin mixing technique will affect the flexural strength of bulk fill resins. The first hypothesis was partly rejected as the duration of photo-polymerization failed to show a difference in DC and flexural strength among the bulk fill resins. However the second hypothesis was accepted as auto mixing showed higher strength and DC in comparison to hand mixed bulk fill resins. These outcomes are attributed to the filler content, resin composition, distribution of filler particles, resin chemical flexibility, monomer viscosity and light intensity during polymerization.
The clinical success of core build-up materials depends on their mechanical properties as they are cyclically exposed to forces of mastication and parafunction. It has already been discussed that filler content, size and filler type influences the properties of resin composites.21,22 Biaxial flexural strength of resins was assessed as it is influenced by filler loading, morphology and the type of monomer matrix.23,24 BFS is a widely used parameter for mechanical properties as it eliminates the risk of edge failures, specimens are disc shaped to simulate the average width of molars, it is not influenced by geometry and flaw direction. In addition DC of bulk fill resins was investigated, as the adequacy of polymerization results in enhanced mechanical and physical properties. 11 FTIR based on light absorption was employed for DC assessment due to widespread application and reliability of outcomes. 25
It is reported that monomers containing Bis-GMA or tri-ethylene glycol dimethacrylate (TEGDMA) when substituted with urethane di-methacrylate (UDMA), flexural strength is increased. However, if Bis-GMA is replaced with TEGDMA, flexural strength is decreased. MultiCore® (MC) contains higher content of UDMA than Bis-GMA and TEGDMA monomers however manufacturers have not provided percentage distribution of different monomers of Core-it® (CI) material. 26 Similarly, composites containing high amounts of inorganic fillers, have been associated with improved flexural strength while a greater organic content has been commonly associated with increased hydrothermal degradation and greater polymerization shrinkage. Studies that evaluated the flexural strength of different composite materials have found MC to display low flexural strengths as compared to other materials. 24 In a study by Warangkulkasemkit and Pumpaluk (2019), 24 MC exhibited the lowest flexural strength among the three materials with a statistically significant difference (p < 0.05). In the present study, overall mean flexural strength of MC was lower than CI and the difference was statistically significant, when light cured for 10 and 20 s. This can be attributed to the low inorganic filler (54.9%-base and 54.4%-catalyst) content of MC compared to CI. It is also supported by the fact that DC of CI specimens was significantly higher compared to MC resin after photo-polymerization.
In the present study, BFS was higher in photopolymerized groups as compared to auto-cured resin regardless of the mixing technique for both materials. In addition, curing duration of 10 and 20 s did not show a significant influence on the BFS. Self-curing components of resin composites are mostly not able to compensate for the decrease or absence of light polymerization hence being less effective compared to dual cured resins.27,28 In addition, the irregular viscosity changes during the self-curing polymerization, compromises the migration of radicals and conversion reaction. 29 This is complemented by the outcomes of the DC in the present study, which was comparatively higher in photopolymerized resin specimens as compared to auto-cure resin for both materials. It is suggested previously, that longer duration of light exposure of curing light improves the strength of resin composites.30,31 However, the results showed that overall mean flexural strength was highest in the shorter duration (10 s) light cured group (i.e. group light cured for 10 s) in both the materials, however comparable to 20 s exposure. These findings of the present study are novel in showing the positive influence of high intensity short duration photo-polymerization for improving mechanical property of the tested materials. Interestingly in the present study, BFS for first and second auto-mix resins (for MC and CI) were significantly higher than hand mixed resin material. Hand mixing can lead to non-homogenous mixing of the filler in the organic resin matrix, leading to inadequate polymerization and thereby preventing the material from reaching optimum strength levels. Kumar and Shortall, 32 suggested that hand mixing leads to greater porosity in the resin due to air incorporation during mixing. Manual mixing in contrast to auto-mixing, may lead to agglomeration of nano-particles, which subsequently decreases the strength of the resin. 32 The agglomerated particles create regions of stress concentration that require low energy to initiate crack propagation, and may lead to failure at low stress levels. 32
It was observed that DC was comparatively higher in photopolymerized resin specimens as compared to auto-cure resin for both materials. In addition, CI showed higher DC compared to MC for photopolymerized groups. Monomer viscosity and structural flexibility are critical in DC of resins. 33 Bis-GMA is less flexible and more viscous due to rigid aromatic interactions and strong hydrogen bonding. By contrast, UDMA has lower viscosity with higher structural flexibility due to weak hydrogen bond with the amine group. 34 As MC bulk fill has higher UDMA compared to Bis-GMA, therefore its resin matrix content is associated with lower DC findings in contrast to CI bulk fill. Moreover, the DC for bulk fill resins after 10 and 20 s photo-polymerization was statistically comparable in the study findings. Lima et al., 35 in a study assessing the depth of cure of bulk fill resins revealed, that the degree of polymerization depends on material composition and radiant exposure (irradiance vs time). They suggested that light irradiance is highly critical for optimal resin depth of cure and LED irradiance of ⩾1000 mW/cm2 showed the best outcomes. As the light irradiance for photo-polymerization in the present study was standardized at 1000 mW/cm2, therefore this is attributed to the similar DC percentages for specimens polymerized for 10 and 20 s. Suggesting that light intensity is potentially a superior factor than curing duration in the degree of conversion of bulk fill resins. Based on the findings, it is recommend, that for high intensity light curing (1000 mW/cm2), photo-polymerization can be reliably employed for 10 s, for optimal DC and flexural strength outcomes.
Although the use of 10 s photo-polymerization with optimal strength and DC is innovative, it is pertinent to mention that the study had in-vitro settings, excluding the clinical dynamic and cyclical exposure of resin materials to high physical loads and chemical trauma. In addition, the outcomes can only be associated to the bulk fill resins assessed in the study for DC and flexural strength. It is relevant to mention that rapid photo-polymerization with high intensity light is associated with the risk of polymerization shrinkage and material displacement, a known precursor for restorative failure. Therefore, studies assessing shrinkage and displacement of Bulk fill resins with contemporary modes of polymerization are mandated. In addition, the clinical efficacy of rapid light curing polymerization modes and its association with resistance to mechanical failure, staining and microleakage needs investigation through randomized controlled trials.
Conclusion
Biaxial flexural strength (BFS) and degree of conversion (DC) of bulk fill resins was higher in photopolymerized groups as compared to auto-cured resin regardless of the mixing technique for both materials (MultiCore and Core it). Photo-polymerization duration of 10 and 20 s showed similar outcomes for BFS and DC; and BFS for first and second auto-mixed resins (MC and CI) was significantly higher than hand mixed resin material.
Footnotes
Acknowledgements
The authors are grateful to the Deanship of Scientific Research, King Saud University for funding through Vice Deanship of Scientific Research Chairs, Research Chair for Biological Research in Dental Health
Author contributions
TAM and AA: Data collection, study design, manuscript writing, final manuscript approval. KMA and AMM: Data collection, study design, manuscript drafting, data analysis, and manuscript approval. BA and RA: Data collection, manuscript approval and data interpretation. AB, TJ and FV: Data collection, performed experimental testing writing, revise, and editing and final manuscript approval.
Declaration of conflicting interests
The author(s) declared no potential conflicts of interest with respect to the research, authorship, and/or publication of this article.
Funding
The author(s) disclosed receipt of the following financial support for the research, authorship, and/or publication of this article: The authors are grateful to the Deanship of Scientific Research, King Saud University for funding through Vice Deanship of Scientific Research Chairs, Research Chair for Biological Research in Dental Health