
Abstract
Aim:
The study aimed to assess graphene oxide (GO) adhesive and its dentin interaction using scanning electron microscopy (SEM), MicroRaman spectroscopy and Microtensile bond strength (μTBS).
Materials and Methods:
Experimental GOA and control adhesives (CA) were fabricated. Presence of GO within the experimental adhesive resin was assessed using SEM and Micro-Raman spectroscopy. Ninety specimens were prepared, sixty teeth were utilized for μTBS, twenty for SEM analysis of interface for CA and GOA and ten were assessed using microRaman spectroscopy. Each specimen was sectioned and exposed dentine was conditioned (35% phosphoric acid) for 10 s. The surface was coated twice with adhesive (15 s) and photopolymerized (20 s). Composite build-up on specimen was photo-polymerized. Among the bonded specimens, thirty specimen were assessed using Micro-Raman spectrometer, SEM and energy dispersive X-ray spectroscopy (EDX), whereas remaining specimens were divided in to three sub-groups (n = 10) based on the storage of 24 h, 8 weeks and 16 weeks. μTBS testing was performed at a crosshead speed of 0.5 mm/min using a microtensile tester. The means of μ-tbs were analyzed using ANOVA and post hoc Tukey multiple comparisons test.
Results:
No significant difference in μTBS of CA and GOA was observed. Storage time presented a significant interaction on the μTBS (p < 0.01). The highest and lowest μTBS was evident in CA (30.47 (3.55)) at 24 h and CA (22.88 (3.61)) at 18 weeks. Micro-Raman analysis identified peaks of 1200 cm-1 to 1800 cm1, D and G bands of GO nanoparticles in the resin. Uniform distribution of graphene oxide nanoparticles was present at the adhesive and hybrid layer.
Conclusion:
GO showed interaction within adhesive and tooth dentin similar to CA, along with formation of hybrid layer. In ideal conditions (absence of nanoleakage), graphene oxide modified adhesive shows comparable bond strength and durability of resin dentine bond.
Keywords
Introduction
Resin composite is the most popular choice of dental restoration; however, it retains the risk of polymerization shrinkage, microleakage and high bacterial adhesion. 1 Studies have shown that bond failures often result due to nanoleakage at the interface of resin–dentine bond following secondary caries.1–3 The hydrophilic contents of adhesives absorb water from the leaked fluids resulting in the weakening of the bond. In some instances, the authors argued that nanoleakage triggers the development of the biofilm that leads to the progression of the secondary caries as well as the root caries.4,5 Therefore, researchers aim to develop materials that would inhibit the bacterial attachment and colonization, as the external viscoelastic biofilm matrix is resistant to conventional antibiotic agents. 2
The adhesive- hybrid layer acts as a major link in the resin- dentine bond that supports restoration. Adhesives comprise of acidic hydrophilic monomers that enhance its impregnation through the interaction of the adhesive filler component with the collagen fibrils in the tubules and lowers degrees of polymerisation. 6 Moreover, hydrophilicity also influences the flow and extent of the infiltration of the adhesive that determines the strength of the resin- dentine bond. 7 However, it was reported that due to water movement in between the bonds due to nanoleakage and removal of the unreacted monomer the bond strength deteriorates over a period. 6
In recent times, the authors have gained clinical interest in the alteration of dental adhesives for strong tensile bond strength and anti-biofilm properties.8,9 Thus, to develop an efficient and durable adhesive, the effectiveness of initial findings on Graphene oxide (GO) have exhibited enviable characteristics, including mechanical strength, chemical and thermal stability along with anti bacterial properties, through their combination with adhesives. 10 SEM investigation revealed that the GO surface is rich with the hydrophilic groups that have a strong tendency to interact with calcium ions for the growth of hydroxyapatite crystals. 11 Hence, the functional groups of the GO changes the surface chemistry and properties through the optimum interfacial interactions. Moreover, previous studies demonstrated that GO works in three different mechanisms to reduce the risk of secondary caries and enhance bond strength.12,13 The 2D nanostructure of Graphene has the capability to wrap around the cells to reduce the fluid uptake and disrupt the cell structure through its knife structure. 14 In addition, it also acts through oxidative stress production under the influence of water. 15
Previously, authors monitored and evaluated the bond strength and interaction of GO with dentine using silver tracers technique that provides a detailed spatial resolution of adhesive filtration in nano defects and inadequate polymerization.9,12,16 The tracers pointed out the presence of nanometer porosities in the hybrid layer that are responsible for the nanoleakage between the bonds. Currently, Raman spectrum is considered as the tool to evaluate the structural information of hybrid layer, minute biochemical alteration and depth of resin infiltration in the hybrid layer. 17 Nevertheless, limited correlative studies were performed through microtensile bond strength, Energy Dispersive X-Ray Spectroscopy (EDX) and Micro-Raman spectroscopy. In addition, the interaction between GO and hybrid layer is still unknown despite the reported significance of GO. Thus, the study aimed to prepare an experimental adhesive containing GO, characterize it and observe its interaction with the dentine using scanning electron microscopy (SEM), EDX and Micro-Raman spectroscopy, with further assessment of the influence of GO on the dentine bond integrity through microtensile strength testing.
Materials and methods
Synthesis of graphene oxide
Using natural Graphite powder and Hummers method,
18
GO powder was synthesized. The methodology for the synthesis was adopted from a previous study.
19
Using a three-neck flask, Graphite powder (3 gm) and Sodium Nitrate (NaNO3) (3 gm) was charged. The mixture was added to 150 ml Sulphuric acid (H2SO4) in the flask and stirred. The fabricated mixture is placed in ice bath for 5 h at 5
Preparation of GO-modified experimental resin adhesives
The methodology for synthesis of adhesive was adopted from a previous study. 20 A precision weighing balance (The Precisa 1600C, MN, USA) was used to accurately identify ingredient portions. The adhesive was based on 2-hydroxyethyl methacrylate (HEMA) (40%) and bisphenol A glycol dimethacrylate (BisGMA) (60%) with 30% (m/m) ethanol as a solvent. The concentrations of photo-initiators used were based on the amount of monomer and these included, 0.5% (n/n) ethyl 4- dimethylamino benzoate and 0.5% camphorquinone. In addition, 1.0% (n/n) diphenyliodonium hexafluorophosphate (DPIHP) was also incorporated to act as a electron initiator. 21 The mixture was prepared in a three necked flask with a magnetic stirrer and condenser (SA300; Sansyo, Tokyo, Japan). To avoid photo-polymerization due to ambient light the mixture was isolated covered with foil and mixed in red light in a dark box.
The obtained adhesive was regarded as control adhesive (CA). GO at 0.5% (m/m) was added relative to the adhesive to synthesize GO experimental adhesive (GOA). The GO powder was added to ethanol solvent and mixed using sonication for dispersion. The experimental adhesive was centrifuged to obtain homogenization of GO within the adhesive with other components. Due to shelf life of the adhesive, it was stored at 4°C and used within 2 weeks duration. The operators reported standardized experimental protocol to be in line with the checklist for reporting in-vitro studies (CRIS) guidelines.
SEM analysis of experimental resin adhesive
Presence of GO within the experimental adhesive resin was assessed using SEM and Micro-Raman spectroscopy. Ten samples of experimental adhesive resin was photo-polymerized at room temperature using a dental light curing unit (Curing Light, Eliphar S10; 3M ESPE, St. Paul, MN, USA) with 600 mW.cm-2 output for 20 s at 10 mm in a 1 mm × 1 mm area on a glass slide. The specimens were mounted on aluminum stubs using conductive tape (carbon tape) and were sputter coated with gold for 120 s (Baltec SCD sputter, Scotia, NY, USA). Mounted specimens were analyzed using SEM (FEI Quanta 250, Scanning Electron Microscope, OR, USA), operating at 10 kV accelerating voltage using different magnifications.
Specimen preparation and bonding procedure
Ethical approval was obtained from the ethics research committee of Center for Specialist Dental practice and Clinical research, Saudi Arabia (UDCRC/019-22). Ninety non-carious and sound maxillary premolars were collected through non-traumatic extraction. Teeth were extracted for orthodontic space creation in the crowded arch adolescent and adult patients. Teeth were disinfected with chloramine Trihydrate solution (Merck, Germany) for 48 h at a temperature of 4°C. Inorganic tissues attached to the tooth surface were cleaned and removed with ultrasonic scaler (Superior Instruments Co, Newyork, USA). Specimens were stored in distilled water and were later embedded in acrylic resin (Opti-Cryl, South Carolina, Columbia) with exposed crowns at cement enamel junction (CEJ) level in sections of polyvinyl of 4 mm diameter. Teeth were used within 1 month of the storage period. Sixty teeth were utilized for μTBS testing, twenty were used for SEM analysis of the bonded interface for control and experimental adhesive and ten bonded teeth were assessed using Micro-Raman spectroscopy analysis.
The occlusal enamel was removed using a low speed diamond saw (Buehler Isomet 2000 Precision saw, IL, USA), exposing dentin 1mm below the detino-enamel junction (DEJ). An area of 5 mm in diameter was exposed on the dentin surface and was conditioned using 35% phosphoric acid gel (Ultra etch Econo Kit- Optident- Yorkshire, UK) for 10 s, washed for 10 s with distilled water and dried with cotton pellets. Thirty teeth were bonded with control adhesive, while thirty more were bonded with GO. For each adhesive, two applications using a micro-brush were made on the dentin surface and smeared for 15 s, followed by air thinning for 4 s to allow for dentin penetration and solvent removal. The adhesives were photo cured with a blue light dental curing unit (Curing Light Eliphar S10; 3M ESPE, St. Paul, MN, USA) from 10 mm for 20 s. A build up of filled dental resin composite (Filtek Supreme; 3M ESPE, St. Paul, MN, USA) was applied in increments of 1.5 mm using a acrylic jig and dental condenser. Each increment was photo-polymerized for 20 s. from 4 sides. Bonded specimens were stored in distilled water at 37
Microtensile bond test (μTBS)
All bonded specimen were sectioned using a slow speed diamond saw (Buehler Isomet 2000 Precision saw, IL, USA) to produce 1 mm × 1 mm composite-adhesive-dentine bonded beams. Six beams were produced from each tooth. Beams, which failed, or fracture at the substrate were discarded. Fifty beam specimens for each group were randomly selected for microtensile testing. Specimens for μTBS testing were assessed after the particular storage duration in the subgroups. Using cyanoacrylate (Zapit, Dental ventures Inc, CA, USA), beams were secured to tester jaws and were loaded under tension to failure at a crosshead speed of 0.5 mm/min using a microtensile tester (Bisco Inc., Virginia, USA). The means of μTBS were analyzed using ANOVA and post hoc Tukey multiple comparisons test.
Micro-Raman spectroscopy of Dentin-adhesive bonded specimen
Ten teeth as dentin-adhesive bonded specimens after beam specimen formations were used for Micro-Raman spectroscopy analysis. The Raman spectra were identified using Micro-Raman spectrometer (ProRaman-L Analyzer; TSI, Shoreview, MN, USA) Micro-Raman microscopic software (Ramanreader). The background was corrected for dark counts with normal intensity and the position of the experimental GOA from where the signals were obtained was adjusted. Employing a 0.9 objective lens the laser beam was focused on the dentin-GOA interface at 600 mW power. The stage was computer guided and manipulated to obtain Micro-Raman scatter at different locations of interest including, dentin, adhesive and interface. The spectral details were acquired between 800 cm -1 to 1800 cm -1 with an excitation laser beam wavelength of 785 nm with noise filtration. The duration of each scan was 60 s, specimens were divided into 1mm sections and three scan measurements were performed for each selected zone of the specimen.
SEM and EDX observation of bonded adhesive/dentin interface
The sectioned bonded beams for control (n = 10) and experimental adhesive (n = 10) were wet-polished (Beuhler Polisher, Lake Bluff, IL, USA) and placed in distilled water in ultrasonic bath (Bandelin Digital- Sigma-Aldrich Darmstadt, Germany) for 10 mins. The specimens were etched (35% phosphoric acid gel -Ultra etch Econo Kit- Optident- Yorkshire, UK) for 10 s, washed with distilled water (15 s) immersed in Sodium hypochlorite solution (5.25%, 15 min) and washed post immersion. The specimens were placed in ethanol of 80%, 90% and 100% for drying and desiccation. The specimens were mounted on aluminum stubs using conductive tape and sputter coated with gold for 120 s (Baltec SCD sputter, Scotia, NY, USA). Mounted specimens were analyzed using SEM (FEI Quanta 250, Scanning Electron Microscope, OR, USA), operating at 10 kV accelerating voltage at different magnifications and using EDX.
Results
SEM of the synthesized GO adhesive
Assessment of the presence of GO in the experimental adhesive was performed using SEM analysis. Figure 1(a) shows SEM image of nano-pellets (~100 nm) of synthesized GO in the solvent. In addition, Figure 1(b) presents high magnification image of Field Emission SEM (FESEM) showing formulated modified experimental dentin adhesive that indicates uniform distribution of GO nanoparticles within resin dentine adhesive (Figure 1).

(a) Representative SEM images of single layer Graphene oxide (~100 nm) in the form of nanoplatelets. (b) High magnification image of FESEM showing formulated modified experimental dentin adhesive that indicates uniform distribution of Graphene oxide (white arrows) nanoparticles within resin dentine adhesive (red arrows).
SEM, Micro-Raman and EDX of adhesive dentin interface
Figure 2, presents SEM image of the resin dentin bonded specimen showing GOA at low and high magnifications. It presents the cross section of the interface containing composite resin, GOA, dentin hybrid layer and the adhesive resin tags within dentin. A relatively uniform and dense hybrid layer was observed with considerable penetration of adhesive into the dentin in the form of resin tags for the GOA. In addition, a thick layer of the GOA was observed, which reflects the high and resilient viscosity of the experimental adhesive.

(a) SEM image of the resin dentin bonded specimen showing Graphene oxide modified experimental dentin adhesive at low magnification and (b) High magnification. Black arrow is indicative of resin tags.
Figure 3 presents
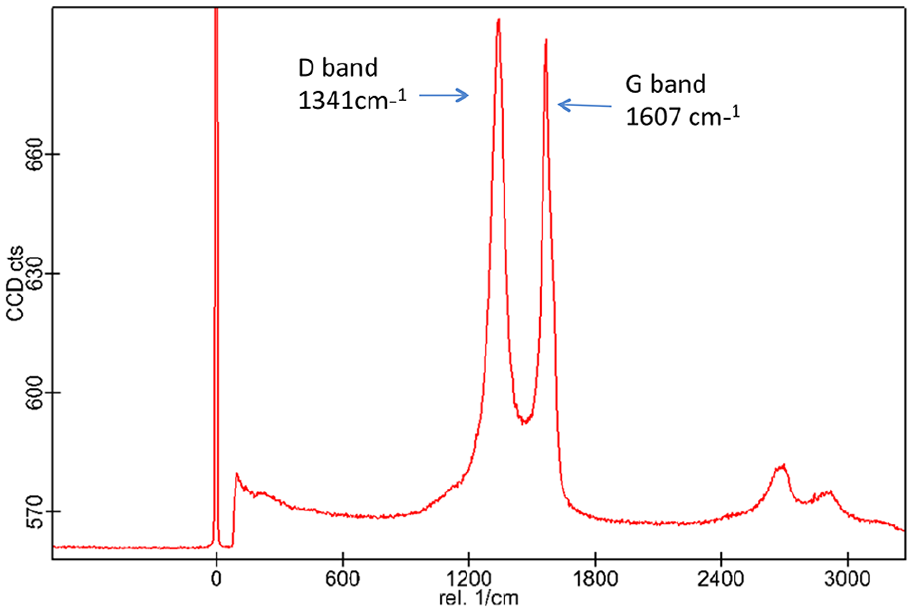
Raman spectra of GO showing characteristic D and G bands, which are two prominent peaks at 1341 and 1607, cm−1. Usually, the G mode is assigned to the vibration of sp2-hybridized carbon, while the D mode is related to the sp3-hybridized carbon and deficiencies relevant with grain boundaries and vacancies in GO.
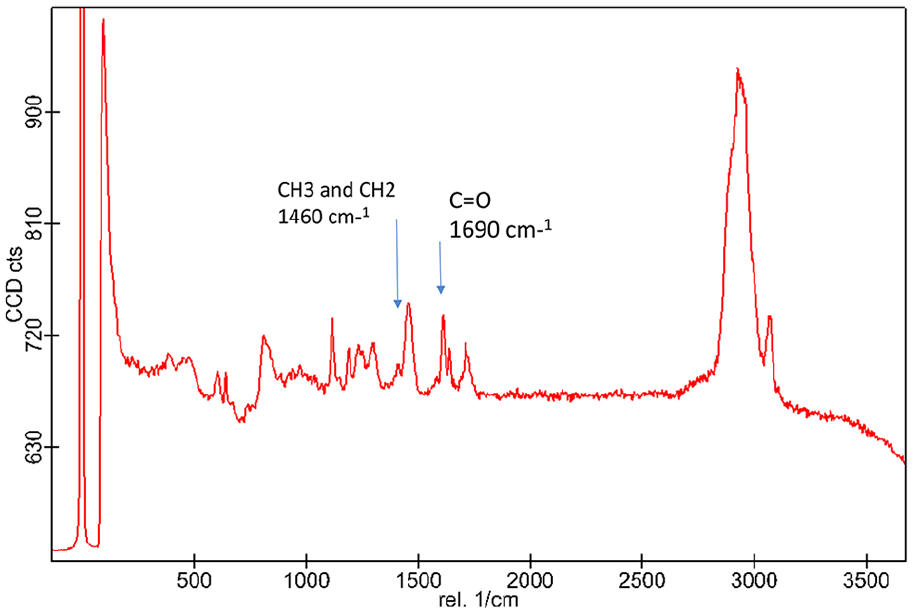
Raman spectrum of Graphene oxide modified dental adhesive. The peaks between 1410 and 1460 cm−1 is due to the CH3 and CH2 deformations. The bands between 1620 and 1690 cm−1 is representative of C = O mixed with NH deformation which is due to the presence of Graphene oxide nanoparticles.

Raman spectrum of dentin samples recorded between 700 cm-1 and 1800 cm-1. The peaks at 1661 cm−1 and 1246 cm−1 are associated with organic components such as amide I and amide III for dentin collagen.
The EDX spectrum of the GOA and dentin bonded interface identified elements observed in adhesive and the structure of dentin. Representative EDX analysis of the electron image as shown in Figure 6, exhibits a sharp peak of carbon (C) due to its presence in dentin substrate. In addition, a high presence of oxygen (O) is shown which is due to GO nanoparticles. Furthermore, the third most commonly occurring element was silica (Si), which represents the presence of filler particles within the dentin adhesive. The minimum amounts of Al and Zr are also representation of adhesive filler.

(a) Electron image of the resin dentin interface. GOA: Graphene oxide adhesive. (b) Representative energy-dispersive X-ray spectroscopy analysis of the same electron image showing a high amount of carbon and (c) Oxygen (O) which is due to the Graphene oxide nanoparticles. The silica (Si) is due to the presence of filler particles from the dentin adhesive.
Microtensile bond strength (μTBS-MPa)
The results of the μTBS testing are given in the Table 1. The study compares the microtensile bond strength between the two adhesive groups; GOA and CA; each categorized according to the storage time; 24 h, 8 weeks and 16 weeks. The ANOVA presented a significant interaction and influence of the storage time on the μTBS (p < 0.01). The highest μTBS was evident at 24 h storage in CA (30.47 (3.55) MPa) whereas the lowest μTBS was noted in CA (22.88 (3.61) MPa) at 18 weeks. However, the baseline measurement of the μTBS obtained for both adhesive groups at 24 h storage was comparable.
Microtensile bond strength (Mean and SD) and failure mods distribution among the investigated groups.

GOA, graphene oxide adhesive; CA, control adhesive.
Dissimilar small letters in the same row are significantly different.
Dissimilar capital letters in the same column are significantly different.
ANOVA.
Comparing the two adhesives, the ANOVA performed revealed that the storage time had a similar effect on the μTBS. Nevertheless, the influence of storage time in GOA demonstrated a slower rate of deterioration of tensile bond strength compared to the CA. The results presented with a significant difference among the specimens at 24 h (29.81 (3.14) MPa ; 30.47 ( 3.55) MPa) and 8 [27.42 ( 4.73) MPa; 25.80 ( 3.26) MPa] weeks storage with the specimens at 16 weeks (2 3.68 (3.72) MPa; 22.88 ( 3.61) MPa] storage with respect to both the specimen groups; GOA and CA, respectively.
The specimens displayed adhesive failure in the majority of the specimens as shown in the Table 2. The GOA specimens at 8 week and 16 week storage presented with 100% adhesive failures compared to the CA presenting with 70% to 90% adhesive failure. Likewise, the control adhesive presented with cohesive failures (n = 1) and admixed failure (n = 2) at 24 h and 8 weeks storage whereas GOA displayed 30% admixed failure in the specimens at 24 h storage (Figure 7). Thus, with time the μTBS decreases thereby resulting in adhesive failure compared to the initial storage period measurements.
Distribution (%) of failure modes type among study groups.


Presenting failure types of microtensile bond testing. Adhesive failure (a). Cohesive failure (b) and Mixed failure (C).
Discussion
The present study formulated experimental adhesive in the form of GOA to observe GO interaction with the dentine using SEM, Micro-Raman spectroscopy and to determine the influence of GO on the μTBS. The hybrid layer is a three dimensional structure that acts as a stable link between the dentine and adhesive; however, the bond strength of the hybrid layer can be altered using different variety of fillers. 14 However, the present study in terms of the microtensile bond strength showed comparable outcomes to the control with respect to storage time. On the other hand, the Micro-Raman spectroscopy and SEM analysis displayed a homogenous mixture of GO and its penetration into the hybrid layer. Thus, the null hypothesis can be partly accepted. A cascade of events are implicated for the findings including the interaction of GOA with hybrid layer, μTBS and influence of the storage medium on the resin- dentine bond.
To establish standardization in the study, both the dental adhesives were formulated in the lab. The control adhesive represents the composition of standard universal adhesive that has a relatively high pH associated with weak hydrophilia.7,25 Thus, these characteristics prevent any unwanted reactions within adhesives, and resin material. The main purpose of the HEMA and BisGMA in the adhesive is to increase the flow of the adhesives into the etched surface for deep resin tags formation. 14 The GO is also a hydrophilic component that assimilates to permit the adhesive flow; however, the production of oxygen species in exchange for water absorption reduces the viscosity of the material and hinders the depth of penetration. 12 In the present study, to observe the extent of penetration into the hybrid layer, SEM/EDX analysis was performed that distinctly identified the C (47.3) and O (31.6) peaks indicating the presence of GO in the resin tags along with some silica particles. Moreover, studies have shown that incorporation of the GO in silica-based adhesive increases the bond strength due to their interaction.12,13 However, the present study result did not comply with previous study outcomes due to limited silica fillers (17.5%).
Considerably the bond weakening depends upon the extent of nanoleakage within the restoration that was represented using an artificial storage environment in the present study. The presence of hydrophilic amenity such as HEMA in the adhesive is responsible for bond weakening due to water absorption. 9 However, evidence pointed out that the hydrophilic property of GO favors water resistance and improves the μTBS. Nevertheless, the μTBS perceived in the present study was comparable, suggestive that the GO incorporation did not compromise the dentin bond integrity of the adhesive. According to Nadika et al. 26 GOA in dry conditions demonstrated a higher bond strength compared to the wet conditions. Thus, GOA in the study demonstrated a slower rate of deterioration of bond strength compared to the control in distilled water storage.
According to Kim et al. 27 the structure of GO also plays an important role in determining the mechanical properties of the material. The reduction of the material to the amorphous state reduces the strength; hence, the structure of GO in the form of sheets reinforces the strength of the material. The reinforcement is supported by the two-dimensional structure with a high specific surface area. 12 Thus permits optimum interaction with other fillers and enhances the mechanical resistance and bond strength of the material. It is also suggested in previous studies, that sheeted GO in the silane primers revealed better bond strength than amorphous GO.
Microtensile bond failure assessment revealed that the strength for CA and GOA were significantly different. The majority of the specimens in GOA demonstrated adhesive failure, which indicated failure at the outer area of the hybrid layer towards the resin, regardless of the storage time. However, conversely, CA showed cohesive and admixed failure in the initial stages of bond development suggestive of strong and durable microtensile bond strength at resin dentine interface which is stronger than the materials strength. According to Khan et al. 13 SEM analysis reported that the continuous nanoleakage over a period creates a tree like affected areas under constant absorption that lowers the tensile bond strength. Therefore, regardless of material employed, both materials presented with a lower bond stability with an increase in storage time in distilled water.
The present study evaluated the subsurface imaging using Micro-Raman spectroscopy to observe the distribution of the GO, to assess the morphological and structural characterization of the GOA. According to Mei et al. 12 extensive peaks for GO in the adhesives are noted at 1355 and 1598 cm-1 represented as D bands, which coincides with the present study’s findings. The D band represents the disordered sp3 carbon structure whereas the G band represents sp2 ordered crystalline graphite-like structures, correspondingly. 12 Interestingly, the similar peaks observed in the GO and dentine samples are suggestive of hybrid GO layer formation within the dentinal tubules and over the surface. 18 Authors have invested efforts to waive off risk of bond weakening and enhance bond strength through manipulation of the D/G ratio.17,28 Clinical trials have revealed that by increasing the ratio through the addition of silica permits a complex interaction with GO that improves the bond strength of the adhesive.29,30 In addition, the Micro-Raman peaks 1410 to 1460 cm-1 corresponding to CH2CH3 indicates the resin penetration within the dentin samples whereas GO interaction with NH is evident at 1620 to 1690 cm−1 with reference to previous studies. The frequency shift at Amide I and Amide III of dentin collagen is indicative of collagen stability and its interaction with GOA. 17 Likewise in the present study, change of frequency intensity that is an increase at Amide III and decreases at Amide I at the 1661 cm−1 and 1 246 cm−1, respectively was observed. Thus, indicative of a positive interaction of GO with the collagen fibrils, which may contribute, to strengthening of the tensile bond strength. 17
The diffusion of the adhesives deep into the inter-fibrillar space of collagen depends upon the amount of hydrophilic components present, that removes the water molecules and bind with the fillers for the optimum mechanical bond strength. 25 Many authors have suggested the application of multiple coats and long application time for better dentin interaction.25,31 However, the present study did not consider the influence of the techniques employed during the adhesive application thus it is necessary to conduct future research to evaluate the impact of the technique employed. As live dentin is a dynamic tissue with movement of water, and extracted teeth loose water content, the bond strength and integrity outcomes of the present study can be regarded as an overestimation of the clinical adhesive dentin bonding. Moreover, in-vitro studies limit the application of GOA as they do not represent the dynamic loading and dental restoration conditions in the oral environment. Therefore, clinical prospective studies are required, that reflect variations of the clinical environments and assess the bond integrity of GOA in dynamic conditions.
Conclusion
Within the limitation of the study, GO showed interaction within adhesive and tooth dentin, similar to conventional adhesives, along with formation of hybrid layer. In addition, in ideal conditions (absence of nanoleakage), GO modified adhesive shows comparable bond strength and durability of resin dentine bond.
Footnotes
Acknowledgements
The authors are grateful to the Researchers supporting project at King Saud University for funding through Researchers supporting project No. (RSP-2019-44)
Contributorship
AA, MB and RA: Data collection, study design, manuscript writing, final manuscript approval. TA and AMM: Data collection, study design, manuscript drafting, data analysis, and manuscript approval. MA and AA: Data collection, manuscript approval and data interpretation TA and FV: Data collection, writing, revise, and editing and final manuscript approval
Declaration of conflicting interests
The author(s) declared no potential conflicts of interest with respect to the research, authorship, and/or publication of this article.
Funding
The author(s) disclosed receipt of the following financial support for the research, authorship, and/or publication of this article:
Guarantor
Tariq Abduljabbar.