
Abstract
Titanium (Ti) implants are widely used in medicine. Meanwhile, surface modification of Ti can strengthen the osseointegration of implants. In this study, we modified Ti implant surfaces, which was coated with GO, HA, HA-2wt%GO and HA-5wt%GO via electrophoresis deposition, to investigate their mechanisms and biological activity. Uncoated Ti was used as the control. Further, we examined the biological behavior and osteogenic performance of mouse bone marrow mesenchymal stem cells (BMSCs) cultured on coatings in vitro. We found that the HA-GO nanocomposite coating improved the roughness and hydrophilicity of the Ti surface. Compared with the uncoated Ti or Ti modified by HA or GO alone, cell adhesion and diffusion were enhanced on HA-GO-modified Ti surfaces. In addition, the proliferation and osteogenic differentiation of BMSCs in vitro were significantly improved on HA-GO-modified surfaces, whereas osteogenesis-related gene expression and alkaline phosphatase activity were slightly enhanced. Furthermore, we noted that bone regeneration was improved in the HA-2wt%GO group in vivo. Thus, the HA-2wt%GO nanocomposite coating might have potential applications in the field of dental implants.
Introduction
Ti and Ti alloy implants are widely used in clinical applications owing to their low elastic modulus and good biocompatibility. 1 However, Ti alloys have low osseointegration capacity as they cannot induce osteogenic cell differentiation because of biological inertia. Several surface treatment methods (including plasma spraying, 2 acid etching, 3 and anodic oxidation 4 ) and bioactive coatings (hydroxyapatite, 5 bioactive glass, 6 magnesium silicate, 7 and multifunctional composite coating 8 ) have been applied to improve the osseointegration of Ti implants.
Among these bioactive coatings, HA (Ca10(PO4)6(OH)2) is the most commonly used material in osteogenesis because its chemical composition and microscopic crystal structure are similar to those of natural bone and dentine.9,10 However, pure HA has low abrasive resistance and fracture toughness that may prevent its clinical application. In addition, its low strength can result in crack growth and reduce its resistance to corrosion.9,11
Numerous HA-based nanocomposite coatings have been developed, including polymers (such as chitosan, 12 hyaluronic acid,13,14 alginic acid, 15 and dopamine modified strontium-doped hydroxyapatite coating 16 ) and carbon-based materials.17–19 Despite these enhanced mechanical properties, the reinforcers (carbon nanotubes) lead to deteriorated biological properties of HA and exert adverse effects on the adjacent tissues. 20 In addition, some materials (ZrO2) can induce the decomposition of HA. 21
Recently, graphene-based materials have been widely used in various biological fields because of their special structures, outstanding mechanical properties, and good biocompatibility. 22 In particular, graphene oxide (GO) has been used in various fields of biotechnology (biosensing, 23 cell imaging, 24 microbial fuel cells,25,26 and drug delivery27,28). Thus, GO has become a promising nanofiller for use in biological composites.
Recent studies have described the use of graphene to reinforce HA composites 29 via synthesis methods,29,30 biomimetic mineralization,31,32 spark plasma sintering, 33 and radiofrequency chemical vapor deposition. 27 In addition, several researchers have fabricated HA-GO coatings using electrophoresis deposition (EPD), and the good biological behavior34,35 and physicochemical properties of the layer were confirmed. 36 However, a comprehensive study is needed to clarify the physicochemical properties in vitro and in vivo.
In this study, Ti (pure), which is commonly used in clinical applications, was used as the control, and HA, GO, HA-2wt%GO, and HA-5wt%GO coatings were prepared on its surface using electrophoretic technology. Next, the morphology, roughness, phase compositions and wettability of the modified Ti surfaces were investigated. In addition, the in vitro biological reaction of the modified Ti surfaces with BMSCs (e.g. cell adhesion, proliferation, osteogenic differentiation, and osteogenesis-related gene expression) and in vivo osseointegration properties were evaluated. The results indicated that the HA-GO-modified Ti surface induces osteogenesis of BMSCs, and this strategy can potentially facilitate the development of highly optimized implants in stomatology or orthopedics.
Methods
Preparation of HA-GO coating material
Pure Ti sheets and pillars (Grade TA1, Ti sheet dimensions: 10 mm × 10 mm × 1 mm; Ti pillar dimensions: 7 mm × 2 mm) were obtained from Baoji (China) Taiyuxin Metal Co., Ltd. Pure Ti was polished step-by-step with 1200 mesh sandpaper and then rinsed for 15 min in different media (anhydrous acetone, ethyl alcohol, and deionized water) through sonic oscillation. Ti sheets were used in the investigations of physical and chemical properties and in vitro studies, whereas Ti pillars were used for in vivo animal studies. Both Ti sheets and pillars were referred to as “Ti.”
Four suspension liquids with constant solid loads were prepared and denoted as HA, GO, HA-2wt%GO, and HA-5wt%GO (Table 1). Each electrolyte was prepared as follows: HA electrolyte, 200 mg of HA nanopowder (20 nm; Hubei [China] Handafei Biology Co., Ltd.) was dissolved in 50 mL of ethyl alcohol and then magnetically stirred for 1 h after ultrasonic treatment at 570 W for 2 h to obtain HA electrolyte; GO suspension liquid, 0.8 mL of GO solution (concentration: 5 mg/mL, thickness: 3.3–7 nm, 5–10 layers; Suzhou [China] Nano Pioneer Co., Ltd.) was added to 50 mL of ethyl alcohol to form a stable golden suspension after ultrasonic treatment at 570 W for 2 h to obtain GO electrolyte; and HA-GO composite electrolyte, 200 mg of HA nanopowder was added to 50 mL of ethyl alcohol and magnetically stirred for 1 h after ultrasonic treatment at 570 W for 2 h; then, GO solution was added under magnetic stirring and finally processed for 2 h through ultrasonic treatment to achieve concentrations of 2% and 5% of the total mass (denoted as HA-2wt%GO and HA-5wt%GO electrolytes, respectively).
Electrolyte compositions used to prepare coatings via the electrophoresis deposition method.

In a glass beaker (100 mL), the pH of each mixture was adjusted to 3–4 with HNO3. The gap between the graphite electrode (anode) and Ti substrate (cathode) was 2 cm, and under a constant voltage of 30 V, the deposition time was set to 2 min. During EPD, the homogeneous dispersion of particles was achieved through magnetic stirring. The suspensions were obtained from the EPD electrolytic tank after 2 min, dried horizontally, stored at room temperature for 24 h, and finally sintered for 1 h at 600℃ in a vacuum furnace. Pure Ti was used as the blank control.
Characterization of HA-GO-modified Ti substrates
The particle size and distribution of electrolytes were obtained using transmission electron microscopy (TEM; FEI Tecnai G2 F20, USA) following ultrasonic treatment, and the microstructures of the samples were observed using scanning electron microscopy (SEM; Hitachi, 4800s, Japan) under an acceleration voltage of 5.0 kV. Surface morphology and roughness were measured using an NT-MDT Solver Pro atomic force microscope. The surface chemical composition was determined via X-photoelectron spectroscopy (XPS; UPS, Kratos axis). The phases of the coatings were evaluated based on X-ray diffraction (XRD; Shimadzu, Japan). Raman spectra were obtained via Raman spectroscopy (Raman, HORIBA Scientific Company, France) in the range of 1000–2000 cm−1. Fourier-transform infrared spectroscopy (FTIR; Spotlight400, USA) was performed under the transmission mode in the range of 600–4000 cm−1. A contact goniometer (SL200B, Solon, China) was used to record the images of the static droplets of deionized water at the initial time point and evaluate surface hydrophilicity.
Cytocompatibility evaluation
BMSCs culture
BMSCs were isolated from the femoral marrow of 4-week-old BALB/c mouse (Animal Center, Xinjiang Medicine University). The cells were cultured in α-MEM (Gibco BRL Life Technologies, Grand Island, NY, USA) containing 10% fetal calf serum (Gibco BRL Life Technologies), 100 U/mL penicillin, and 100 U/mL streptomycin. The cells were cultured at 37℃ under 100% humidity and 5% CO2. The culture medium was replaced every 3 days, and the cells were digested with 0.25% trypsin and 0.02% EDTA. BMSCs were cultured to induce P3 generation. Next, the old culture medium was removed, and the bottom of the culture flask was rinsed slowly using phosphate-buffered saline (PBS); further, trypsin containing 0.25% EDTA was added for digestion and incubated for 2 min. Complete medium containing 15% fetal calf serum was added to terminate digestion, and the bottom of the culture flask was gently tapped with a sterile dropper. Consequently, undigested cells were dispersed into single cells to generate a cell suspension, which was centrifuged for 5 min at 1500 rpm. The supernatant was removed, and the cells were dispersed in PBS. The cell density was adjusted to 1.0 × 10⁶ cells/well via cell counting, and a blank control was used for comparison and verification. CD29, CD31, and CD45 were added to each group, and fluorescein isothiocyanate was used to stain the antibodies. Then, the cells were incubated in the dark for 30 min at 4°C. They were then centrifuged and resuspended in PBS. Flow cytometry was performed using cells resuspended in 1 mL of PBS.
Proliferation of BMSCs
To evaluate the proliferation of BMSCs on the surface of each coating, BMSCs (cell density, 1 × 10⁵ cells/mL) were inoculated on samples using Cell Counting Kit-8 (CCK-8), and the influence of the samples on cell proliferation was evaluated in accordance with the kit instructions (Japan Dojindo) after 1, 4, and 7 days. At each time point, 100 µL of CCK-8 kit reagent was added to each well of the 24-well plate (ratio of CCK-8 kit reagent to the culture medium, 1:10), and the plate was incubated for 2 h after oscillation in the dark for 5 min. When the culture medium turned brown in color, 110 µL of the medium was removed from each well and then added to a 96-well plate. Finally, the absorbance was measured at 450 nm using a microplate reader (Switzerland Tecan Infinite M200).
Adhesion and spreading of BMSCs
The adhesion and spreading of cells on the samples were examined. BMSCs were seeded onto the samples at a density of 1 × 10⁵ cells/mL, rinsed with PBS twice after 4 and 7 days, and fixed with 4% paraformaldehyde (PFE). The samples were then rinsed with PBS twice again and finally stained with 4′,6-diamido-2-phenylindole (DAPI, Sigma, USA) for fluorescence imaging under an immunofluorescence microscope. To observe cellular morphology, BMSCs were seeded onto different samples at a density of 1 × 10⁵ cells/mL; cultured for 4 days; fixed with 4% PFE; and then dehydrated with 30, 50, 75, 90, 95, and 100 v/v% ethyl alcohol solutions. The samples were processed via metal spraying after drying and observed using SEM.
Alkaline phosphatase (ALP) activity
ALP activity was analyzed 7 days after seeding the cells onto different samples at a density of 1 × 10⁵ cells/mL. BMSCs on samples were rinsed with PBS thrice and were penetrated with 0.1% Triton X-100. The lysis solution was obtained and centrifuged at 12,000 rpm for 10 min. A BCA protein quantification kit was used to measure protein concentrations. ALP activity was assessed using a commercially available ALP activity measurement kit (China). ALP staining was performed directly for BMSCs on the surface of each sample, and cell mineralization was observed under a Leica microscope.
Osteogenesis-related gene expression
The expression of BMP-2 and OPN was detected via reverse transcription–polymerase chain reaction (PCR). At 7 days after seeding BMSCs onto the surface of each sample at a density of 1 × 10⁵ cells/mL, the surface cells were lysed with TRIzol (Roche, Switzerland) at 4°C, and the lysis solution was stored in a nonenzymatic EP tube. RNA was extracted with isopropanol and then processed into cDNA. Subsequently, PCR was performed using a FastStart General SYBR green master kit (Roche Group, Switzerland) and thermal cycler (LightCycler 96, Roche Group, Switzerland). The expression of the target genes (BMP-2 and OPN) was consistent with that of the internal reference GAPDH.
Osteogenesis of implants in vivo
Animal surgical procedures
In total, 75 female SD rats (6 months old, 220–240 g) were obtained from the Medical Laboratory Animal Center, Xinjiang Medicine University. After anesthesia and hair removal, a 1.5-cm excision was made on the inside skin of the knee, and the patella and ligament were pushed outside to expose the distal surface of the femur. Using a drill, a crack with a diameter of 2 mm was created on the long axis of the femur where Ti pillars with an external diameter of 2 mm and length of 7 mm and those with modified surface were implanted. Two implants were placed in each rat femur, which was randomly implanted with different biomarkers. Each experimental group included 30 rats. The animal experiments were approved by the Animal Protection and Utilization Committee of Xinjiang Medicine University.
X-ray analysis and micro-computed tomography (Micro-CT)
Weekly after operation, the rats were anesthetized using respiratory anesthesia and then analyzed for osseointegration of the implants on the femur using an X-ray analysis meter (PLX5200, PEALONG). The rats were euthanatized 4, 8, and 12 weeks after the operation to anatomize and separate the femur and assess the recovery status of the distal femur tissue under a Leica microscope. In addition, five shin bones from each group were placed in 4% formalin for 48 h at different time points and then scanned using a micro-CT system (Scanco Medical, Bassersdorf, Switzerland) to rebuild the femur image; the scanning thickness in each direction was 10 µm. Later, the related parameters (e.g. bone volume percentage [BV/TV] and the average number of trabeculae [Tb.N]) were calculated.
Histology and histomorphometry
The fixed samples were decalcified with 12% EDTA for 50 days and dehydrated with fractional concentrations of ethyl alcohol. The implant was then carefully removed and embedded in paraffin. To determine the new and mature bone areas around different implants, 3–5-μm thick slices were prepared from three defective cross-sections (n = 5) and stained with hematoxylin and eosin (HE) and Masson’s trichrome, respectively.
After dehydration and embedment, the bone tissue sample with the Ti pillar was sliced using an ultrahard histotome (Leica 1600, Germany) in a direction perpendicular to the long axis of the femur and then stained with Van Gieson (VG).
Immunohistochemical staining of the slices was performed. The primary antibodies in this study were antibodies against BMP-2 and OPN (Abcam). The primary and second antibodies were sealed successively, and slices were then observed under a microscope (BA400 Digital) after incubation and DAB chromogenic reaction.
Statistical analysis
All in vitro experiments were repeated at least three times. Data are presented as standard deviations. The results of in vivo and in vitro experiments were analyzed using a one-way analysis of variance and were considered statistically significant at p-values of <0.05.
Results
Sample characterization
During EPD, the particle size and stability of the suspension play an important role in maintaining coating homogeneity. Figure 1(A) presents nanoparticle dispersion in the electrolytes under a transmission electron microscope. The pure HA nanoparticle (Figure 1(A-a)), with its large surface area and high surface energy, displayed a strong tendency to agglomerate (length, 20–75 nm; width, 20 nm). After ultrasonic treatment and magnetic stirring, the pure GO electrolyte remained in a single-layer form with few wrinkles (Figure 1(A-b)). Meanwhile, the addition of GO to HA reduced particle agglomeration. In particular, HA nanoparticles were uniformly modified or grafted on the GO surface through van der Waals interactions in the HA-2wt%GO and HA-5wt%GO electrolytes (Figure 1(A-c) and (A-d)), and only a few HA nanoparticles conglomerated at the edge of the thin sheets. It was previously reported that HA ions are aligned parallel to the GO surface and that they have a strong coherent interface bond. 37

(A) TEM images of electrolyte in each group. (a) HA electrolyte; (b) GO electrolyte; (c) The mixed electrolyte contains HA with 2 wt%GO (d) The mixed electrolyte contains HA with 5wt%GO. (B) Optical micrographs of the Ti (a), HA (b), GO (c), HA-2wt%GO (d) and HA-5wt%GO (e). (C) SEM images of the Ti (a), HA (b), GO (c), HA-2wt%GO (d), and HA-5wt%GO (e) at different magnifications. (D) Surface morphology and roughness of the samples measured by AFM.
The optical image (Figure 1(B)) obtained from surface morphology observations revealed that GO sheets were uniformly distributed on the composite coating. The SEM image (Figure 1(C)) highlights the microstructures of the composite coatings on the sample surfaces (Ti, HA, GO, HA-2wt%GO, and HA-5wt%GO). Under a low-power lens, HA, GO, HA-2wt%GO, and HA-5wt%GO coatings covered the Ti substrate. Under a high-power lens, strip abrasion caused by polishing was observed on the Ti substrate (Figure 1(C-a)), whereas the other four coatings completely covered the substrate (the polishing mark could not be observed). HA, HA-2wt%GO, and HA-5wt%GO (Figure 1(C-b), (C-d), and (C-e)) showed more complex surface morphologies because of the addition of HA. Under a high-power lens, denser aggregates were observed on the surface of HA coatings, whereas more uniform particles were noted on the surfaces of HA-2wt%GO and HA-5wt%GO coatings. A significant crack was not observed on the HA-2wt%GO surface, but it was visible on the HA-5wt%GO surface under a high-power lens, which may be caused by upper HA cracks attributable to the volatilization of excess ethyl alcohol adsorbed by the bottom GO layer.
The results of atomic force microscopy (AFM) revealed the surface roughness of samples (Figure 1(D)) (i.e. Ti, Ra = 13.335 ± 1.023 nm; HA, Ra = 82.476 ± 4.125 nm; GO, Ra = 4.822 ± 0.832 nm; HA-2wt%GO, Ra = 68.852 ± 3.108 nm; and HA-5wt%GO, Ra = 97.255 ± 4.275 nm). GO exhibited the lowest level of roughness, followed by Ti. HA displayed the highest level of roughness, and roughness was slightly improved with an increase in GO concentration. This may be associated with the increase in surface cracks caused by the volatilization of excess ethyl alcohol because GO has a strong adsorption capacity.
XPS analysis (Figure 2(B)) revealed significant differences in chemical compositions among the sample surfaces. Compared with the findings of the Ti and GO groups, the Mg1s, Ca2p, and P2p peaks were higher on the surfaces of the HA, HA-2wt%GO, and HA-5wt%GO groups. A relatively low Ti2p peak was observed on the GO surface, which may have been caused by the penetration of light from a thin detection light source onto the pure GO coating or incomplete coverage of the Ti substrate. However, the Ti2p peak could not be observed in the HA, HA-2wt%GO, and HA-5wt%GO groups, indicating complete coverage of the substrate.

(A) XRD pattern of the samples. (B) XPS full spectrum of the samples. (C) FTIR spectrum of the samples. (D) Raman spectrum of the samples. (E) Contact angle measurements showing the wettability of the samples. The HA-2 wt% surface showed hydrophobic property.
Furthermore, XRD results illustrated that HA was successfully deposited on the surfaces of the HA, HA-2wt%GO, and HA-5wt%GO groups through EPD based on the HA and Ti phases present in the substrate. The GO phase was observed in the GO group, but it was not detected in the HA-2wt%GO and HA-5wt%GO groups, which might be due to the destruction of crystal patterns and arrangement of irregular atoms.29,37 Therefore, we determined the GO nanofiller properties of the composite coatings through Raman analysis. According to the Raman results of different samples (Figure 2(D)), the Ti sample showed a straight line without any peak. Because of the effect of GO, the GO, HA-2wt%GO, and HA-5wt%GO samples showed typical D (1355 cm−1) and G (1593 cm−1) bands, 38 indicating the successful conjugation of GO to the coating surface.
FTIR results (Figure 2(C)) indicated that HA, HA-2wt%GO, and HA-5wt%GO samples were visible, and PO4−3 was detected at 1037 cm−1. The peaks of GO were clearly detected at 1726 and 1624 cm−1 (corresponding to –COOH and C=C groups, respectively) in the HA-2wt%GO and HA-5wt%GO groups.
Figure 2(E) presents the surface wettability features of the Ti, HA, GO, HA-2wt%GO, and HA-5wt%GO groups after being present on each sample surface for 1 or 30 s. The average contact angles after 1 and 30 s were as follows: Ti, 22° and 15°; HA, 11° and 9°; GO, 68° and 38°; HA-2wt%GO, 8° and 2°; and HA-5wt%GO, 9° and 2°; respectively. Hence, the surfaces of the HA-2wt%GO and HA-5wt%GO groups displayed strong hydrophilicity. 39 In addition, the GO coating can interact with proteins via electrostatic force and hydrogen bonding and promote protein adsorption. 40
In vitro cell behavior
Attachment and proliferation of BMSCs
The CCK8 method was used to assess cell proliferation at 4 and 7 days after BMSC inoculation on the surfaces of samples, as presented in Figure 3(A). The relative proliferation of BMSCs gradually increased on days 4 and 7, during which the cell proliferation rates of the HA-2wt%GO and HA-5wt%GO groups were significantly higher than those of the Ti, HA, and GO groups (p < 0.05).

(A) CCK-8 assay for viability of BMSC on samples for 4 and 7 days. (B) Cytoskeletal morphology of BMSC cultured on samples for 4 and 7 days (×50, blue for DAPI). (C)The adhesion morphology of BMSCs on sample surface was observed by SEM at different magnifications.
Figure 3(C) presents the morphology of BMSCs 4 days after incubation. Fusiform BMSCs were observed in the Ti and GO groups (Figure 3(C-a) and (C-c)), whereas BMSCs in the HA, HA-2wt%GO, and HA-5wt%GO groups (Figure 3(C-b), (C-d), and (C-e)) exhibited better surface stretching capacity and more filopodia-type extensions. The HA-2wt%GO and HA-5wt%GO groups (Figure 3(C-d) and (C-e)) showed more mature and visible actin intracellular fibers; in particular, each cell extended 4–6 pseudopods, which were aggregated and connected to each other. Cells grown on HA-2wt%GO and HA-5wt%GO surfaces had a larger expansion area than those grown on other materials. This indicates that these cells exhibit improved adsorption capacity. In addition, the results of DAPI staining observed by immunofluorescence microscopy (Figure 3(B)) were consistent with result of CCK-8, and the numbers of cells on HA-2 wt%GO and HA-5wt%GO group were increased on days 4 and 7.
ALP activity of BMSCs
As one of the important early biomarkers of osteogenic differentiation, ALP has the ability to promote extracellular matrix (ECM) mineralization. The differentiation of BMSCs into osteogenic cells leads to enhanced ALP activity, causing ECM mineralization as an early differentiation biomarker. Figure 4. A presents the ALP staining of BMSCs 7 days after inoculation on the sample surfaces. ALP activity on HA, HA-2wt%GO, and HA-5wt%GO surfaces was more enhanced than that on other surfaces. In particular, the ALP activity of BMSCs on the HA-2wt%GO-modified surface improved significantly (p ⩽ 0.05).

(A) ALP staining of BMSCs cultured on Sample surface of each group for 7 days. (B) The expressions of osteogenesis-related genes, including BMP-2, OPN, were detected by RT-PCR for 7 days.
Osteogenesis-related gene expression
Figure 4(B) presents the mRNA expression of OPN and BMP-2 in BMSCs seeded onto the surfaces of the Ti, HA, GO, HA-2wt%GO, and HA-5wt%GO groups. The expression of BMP-2 and OPN in the HA-2wt%GO and HA-5wt%GO groups was higher than that in the Ti, HA, and GO groups (p ⩽ 0.05).
In vivo animal study
To verify the feasibility of applying a coating material in clinical applications, we conducted in vivo experiments by implanting the samples onto the distal femurs of SD rats (see Figure 5(A) for the operative process). The positions and directions of postoperative implants were observed through X-ray. No defect or inflammatory reaction was observed around the implant.
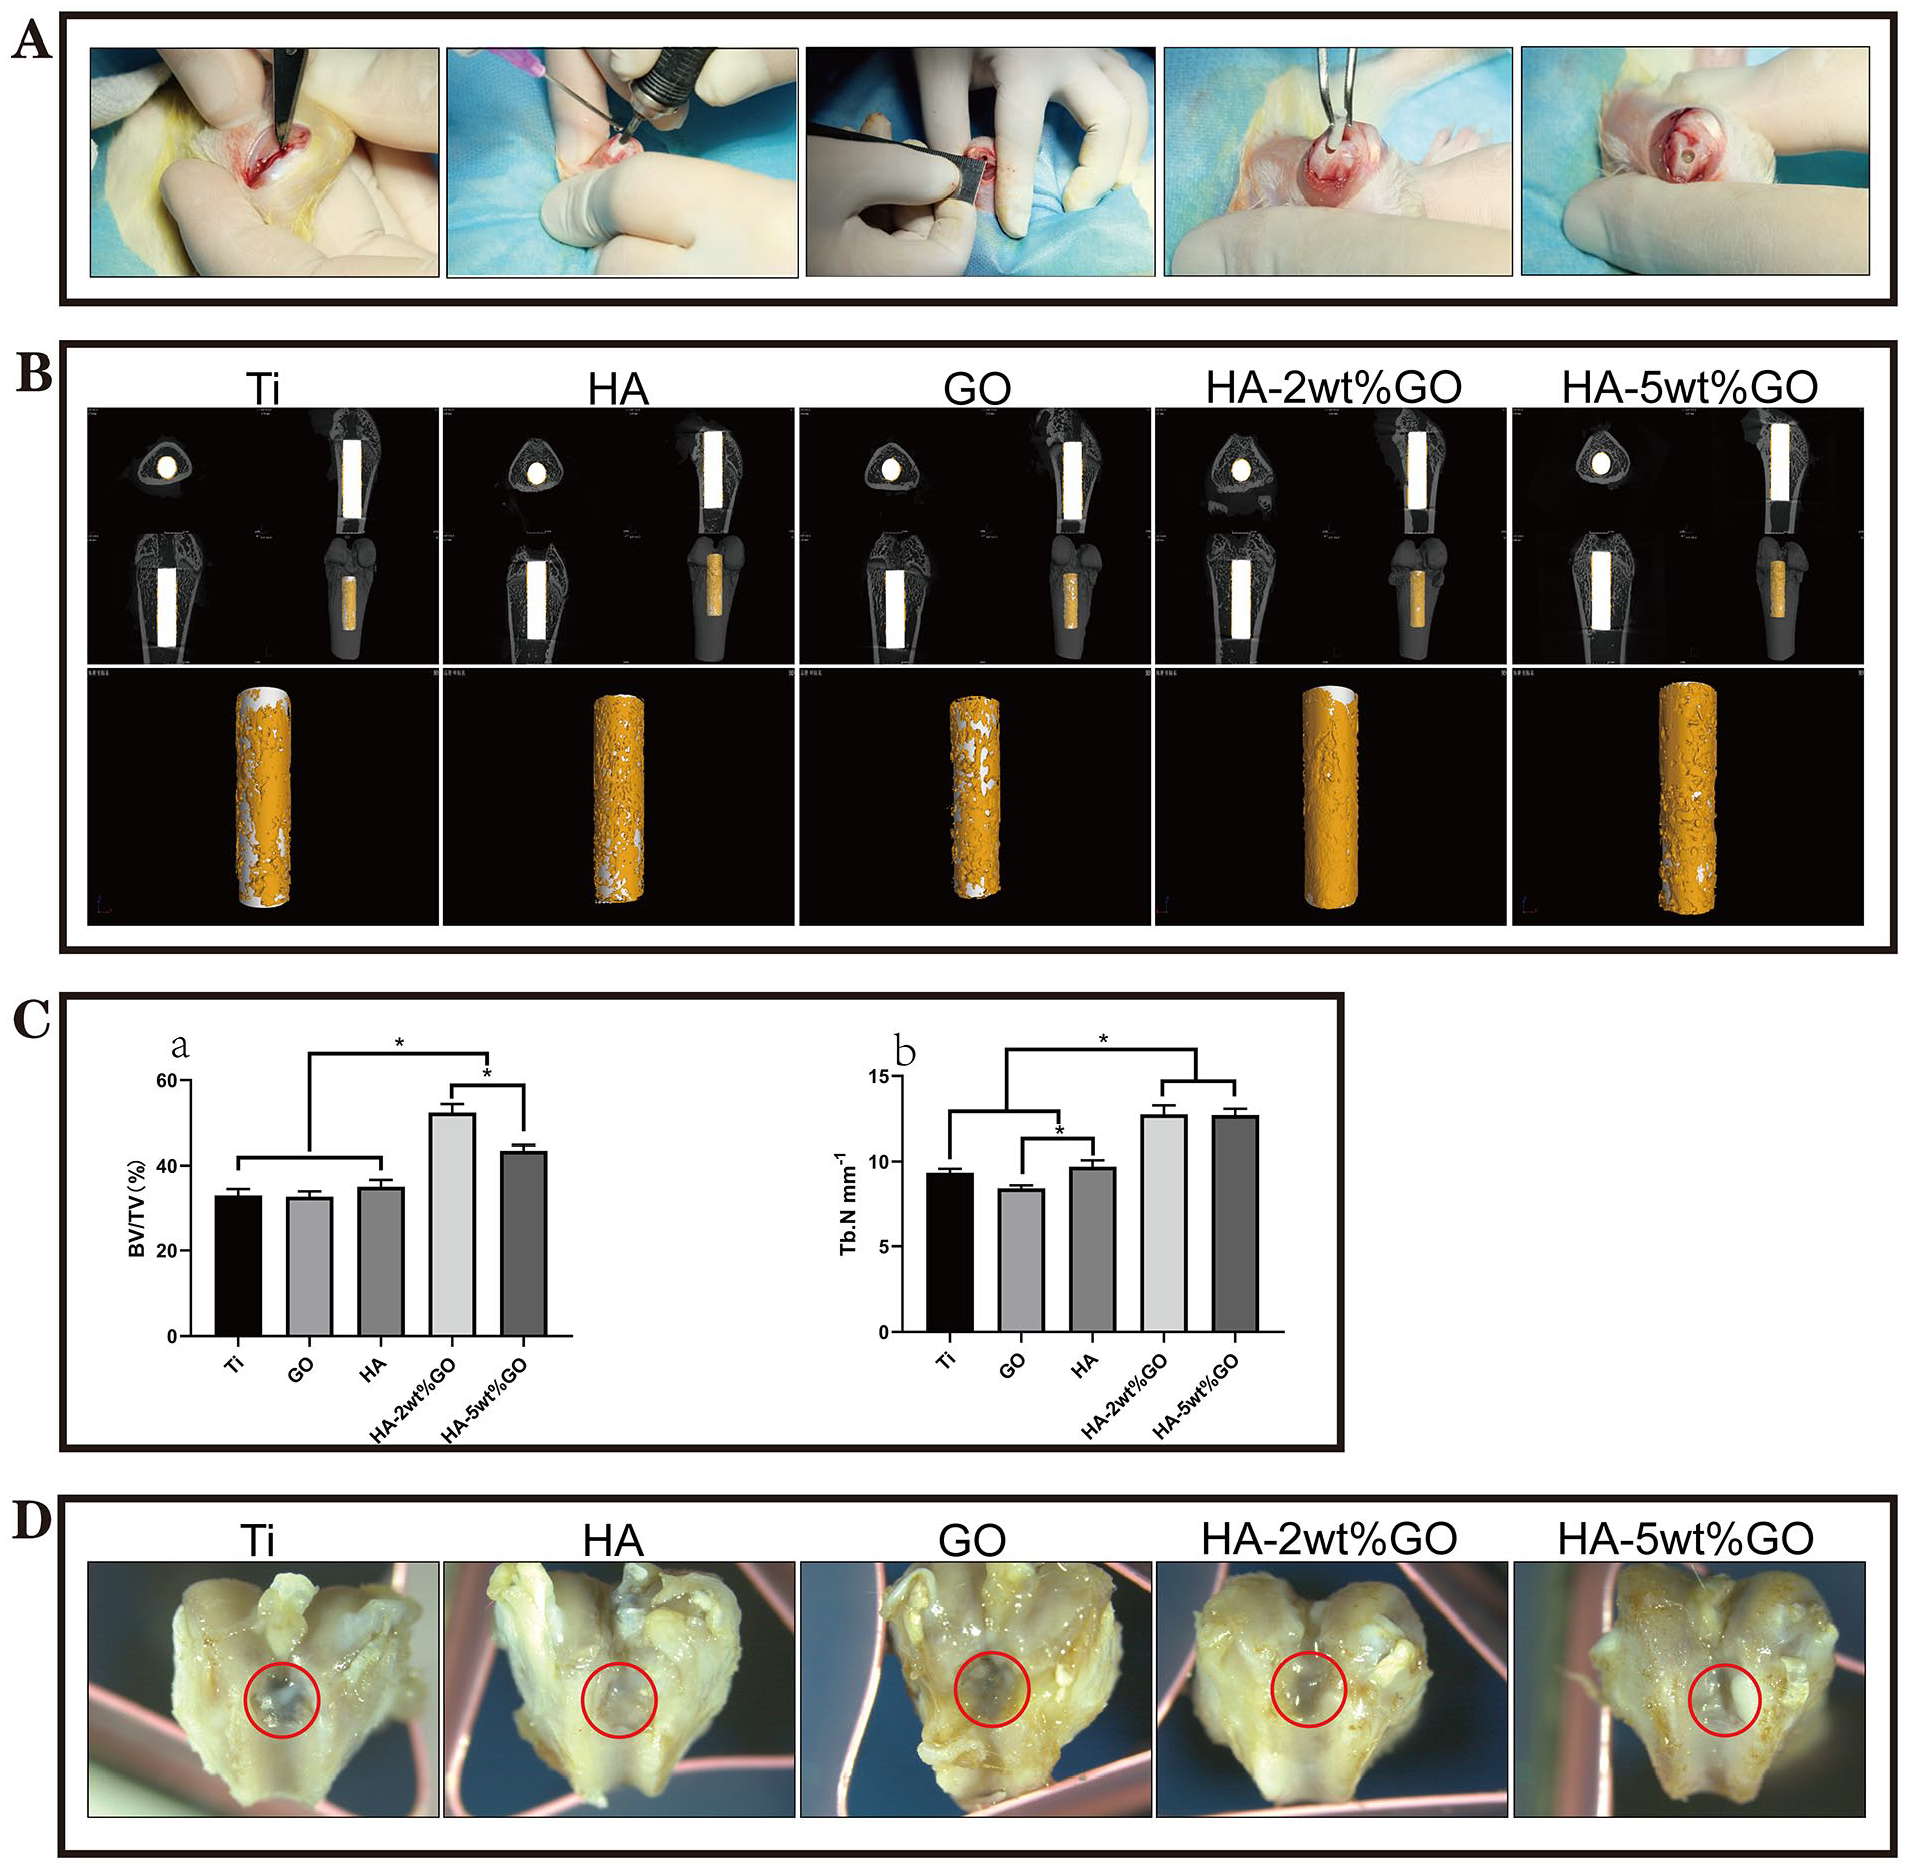
Results of the in vivo bone-repairing model. (A) Surgical procedure and Postoperative X-ray images. (B) 3D images of Micro-CT, yellow parts indicates new bone. (C) Quantitative analysis of Micro-CT data: BV/TV% and Tb.N (*represent p < 0.05 ). (D) Optical micrographs of the Surgical area of femur.
Micro-CT evaluation
Figure 5(B) shows the micro-CT image of the femur 12 weeks after the placement of the implant. New osseous tissue was observed on the surfaces in all groups, and there were more new bones in the HA-2wt%GO group than in other groups. Micro-CT data were further analyzed quantitatively using the BV/TV% index as a marker of osteogenesis. This index was higher in the HA-2wt%GO and HA-5wt%GO groups than in the Ti, HA, and GO groups (Figure 5(C-a)). In addition, the highest Tb.N was noted in the HA-2wt%GO and HA-5wt%GO groups, indicating good osteogenesis around the implant. Meanwhile, the articular surface of the rat’s distal femur was smooth and completely covered the implant in the HA-2wt%GO group. In contrast, the articular surfaces were relatively rough, and osteogenesis was significantly nonuniform in the Ti and GO groups.
Histomorphology
To further evaluate osteogenesis on the implant–host surface, we performed immunohistochemical staining. As shown in Figure 6, HE staining revealed a small number of new bones around the implants in the bare Ti and GO groups 12 weeks after implantation, and fibroid osseointegration was observed adjacent to the implants. Meanwhile, a large number of mature bones were observed around the implant in the HA-2wt%GO group, possibly improving the osseointegration and service life of the implant. The Masson trichrome results revealed increases in the number and thickness of mature bones around the implants in the HA-2wt%GO and HA-5wt%GO groups, whereas only a few mature bones were detected in other groups, which is in agreement with the results of HE staining.

Staining of osteogenic sections. HE staining, Masson’s Trichrome staining and Van Gieson staining of undecalcified sections was performed at 12 weeks in the five groups after implantation.
Undecalcified slices were prepared to evaluate osteogenesis around the implant through VG staining. VG staining biomarkers were attached to new bones on the implant. The highest bone–implant contact rate was found in the HA-2wt%GO group, followed by HA-5wt%GO group (Figure 6(E)). This indicates that the GO functionalized HA group has the strongest osteogenic reconstruction capacity.
In the immunohistochemical staining experiment, OPN and BMP-2 expression in collagen were examined in postoperative week 12 samples (Figure 7). OPN- and BMP-2-positive cells were present in connective tissues around the implants and new osteogenesis.

Immunohistochemistry staining of OPN and BMP-2 was performed at 12 weeks in the five groups after implantation.
Altogether, these results validated the proposed assumption that the multilayer structure of HA-GO nanocoating on the Ti substrate can effectively release Ca and P and improve the osteogenesis of the Ti implant by regulating cell adhesion-related gene expression.
Discussion
We prepared HA-GO composite coatings using EPD to modify the surface of Ti and demonstrated that these coatings can accelerate the proliferation and differentiation of BMSCs as well as the repair and remolding of osseous tissues. The results illustrated that the surface structure of HA-GO coatings can provide a microenvironment for cell growth, proliferation, and differentiation. This was further verified through in vivo studies.
To establish a uniform coating on the Ti surface, GO solution and HA nanoparticles were dispersed in ethyl alcohol to achieve better particle distribution through ultrasonic oscillation and magnetic stirring. The results indicated that the HA electrolyte was relatively concentrated without dispersion. In the HA-2wt%GO and HA-5wt%GO electrolytes, HA nanoparticles were uniformly bound to the GO surface via van der Waals forces, and a small amount of HA nanoparticles conglomerated at the edge of the sheets. In addition, it has been reported that HA nanoparticles are naturally arranged parallel to the GO surface and form a strong coherent interface bond, which is extremely important for preparing uniform and reliable composite coatings.
Next, we prepared composite coatings on the Ti substrate through EPD and obtained a dense and uniform structure. XPS revealed that there were more elements (e.g. Mg, Ca, and P) in the HA, HA-2wt%GO, and HA-5wt%GO groups than in the Ti and GO groups; these elements indicate the composition of HA. Meanwhile, a relatively low Ti2p peak was observed on the surface of the GO group because the thin pure GO coating resulted in the penetration of light or incomplete coverage of the Ti substrate. However, the Ti2p peak was not detected in the HA, HA-2wt%GO, and HA-5wt%GO groups, indicating complete coverage of the substrate. Complete coverage of the implant can effectively prevent Ti from undergoing galvanic battery reactions in a complex in vivo environment and avoid the ionization of metal ions, which may influence the osseointegration of the implant.
Moreover, we conducted XRD in each group to demonstrate the successful preparation of the coating. The HA and Ti phases were observed in the HA, HA-2wt%GO, and HA-5wt%GO groups, the GO phase was detected in the GO group, and the Ti phase was noted in the Ti group; however, the GO phase could not be detected in the HA-2wt%GO and HA-5wt%GO groups, which may be due to the destruction of crystal patterns and irregular arrangement of atoms. 29 Therefore, we performed Raman analysis on the GO nanofillers. A straight line without any peak was found in the Ti sample. Meanwhile, because of the effect of GO, typical D (1355 cm−1) and G (1593 cm−1) bands were observed in the GO, HA-2wt%GO, and HA-5wt%GO groups. 38 Thus, the representative signals effectively demonstrated the successful conjugation of GO to the coating surface.
Multipore structures are crucial for implants with biological activity because they can directly influence the exchange and transport of nutrient substances, cellular adhesion, and tissue growth. The HA-2wt%GO, HA-5wt%GO, and HA groups displayed different surface morphologies compared with the GO and Ti groups. In particular, nonporous microparticle structures were observed on the surfaces in the HA-2wt%GO, HA-5wt%GO, and HA groups. Under a high-power lens, the HA group showed denser aggregates on the surface, whereas the HA-2wt%GO and HA-5wt%GO groups showed more uniform surface particles and increased density, consistent with the TEM results of the electrolytes. A significant crack was observed on the HA-2wt%GO surface, but this was not detected under the high-power lens. This may be because the bottom GO layer adsorbs excess ethyl alcohol, resulting in an upper HA crack during volatilization. In addition, the AFM image illustrated differences in the roughness of the five samples. The minimum roughness was detected in the GO group, followed by the Ti group, and the maximum roughness was observed in the HA group. Moreover, the roughness was slightly improved with an increase in the GO concentration, which may be associated with the increase in the number of surface cracks.
Furthermore, the HA-2wt%GO group showed the best surface wettability. The hydrophilicity of the material surface has a considerable influence on the initial cell adhesion. Several studies have indicated that coatings with good hydrophilicity can promote cell attachment and further accelerate primary cell adhesion. 41
In vitro-cultured BMSCs on the surface of the HA-2wt%GO group exhibited significantly enhanced differentiation and mineralization capacity. The detection results of the CCK-8 method indicated the proliferation status 4 and 7 days after seeding BMSCs onto the surface of each sample. The proliferation rates of surface cells were significantly higher in the HA-2wt%GO and HA-5wt%GO groups than in the Ti, HA, and GO groups. This was demonstrated by DAPI staining on the surface of each sample. Moreover, immunofluorescence microscopy revealed a larger number of cells on the surfaces of the HA-2wt%GO and HA-5wt%GO groups on days 4 and 7.
By observing the surface cells of each sample using SEM, we determined that BMSCs in the HA, HA-2wt%GO, and HA-5wt%GO groups exhibited better surface stretching capacity, more filopodia-type extensions, and more visible mature actin intracellular fibers. Each cell extended 4–6 pseudopods, which were aggregated and connected to each other. The cellular expansion area in these groups was larger than that in other groups. This indicates that the HA-2wt%GO and HA-5wt%GO groups promote cell adhesion and proliferation. In addition, OCN and OPN expression was greatly increased. FTIR results indicate that GO possesses rich hydrophilic functional groups (e.g. carboxyl, carbonyl, and hydroxyl groups). Some studies have revealed that these groups contribute to cell proliferation. For example, Subbiah 42 suggested that GO-modified Ti promotes osteogenesis. Similar to inorganic substances in human bone tissue, HA has good biocompatibility and bioactivity, and it can release Ca and P ions to promote osteogenesis, as demonstrated by ALP staining after culturing BMSCs on the surface of each sample. In particular, the ALP activity of BMSCs on the HA-2wt%GO-modified surface was significantly improved.
Some biological studies have demonstrated that the addition of GO can significantly improve the attachment of the coating and promote the proliferation, bioactivity, and osseointegration of BMSCs. Therefore, the bioactivity of HA-GO improved osseointegration because the high specific surface area of GO can promote cell attachment and proliferation.43,44 In the in vivo experiment, HE, Masson, and VG staining revealed a relatively high mineral deposition rate around the HA-GO implant, and rich mineralized nodules were observed around the tissue. The thickest lamellar bone structure was noted around the HA-2wt%GO implant, and calcium deposition and the collagenous fiber staining strength in this group were significantly higher than those in the control group. However, no bone tissue or a relatively thin layer of bone tissues was observed; however, filament tissues could be observed around the implants of the Ti and GO groups. This revealed that the HA-2wt%GO coating can significantly accelerate osteogenesis around the implant. Finally, the abovementioned results indicate that GO can improve the osseointegration-promoting effects of different implants.45,46
Immunohistochemical staining revealed high expression of OPN and BMP-2 around the implants of the Ti and HA groups, and the positive indexes of the HA-2wt%GO and HA-5wt%GO groups revealed a large percentage of brown staining at the cortical bone side around the implant. This indicates that the bone-repairing effect occurs earlier in these two groups than in the Ti, HA, and GO groups. Compared with the findings of the other groups, the HA-2wt%GO group showed the highest calcium deposition and number of consequent mineralized modules. These results indicate that HA-GO can induce Ca secretion and that HA-2wt%GO exerts the strongest effects. We believe these results are attributable to the high specific surface area of GO, which has extremely strong adsorption capacity and can be used as a slow-release material additive.47,48 Thus, GO may enhance the ability of HA to continuously release Ca and PO4 to promote osteogenesis.
The properties of the HA-GO coating are not continuously improved with an increase in GO concentration (HA-2wt%GO showed superior effects compared with HA-5wt%GO). This is because an increase in GO concentration results in the enhancement of the system viscosity and aggregation, limiting the dispersion of GO and HA. Consequently, the active sites in the system are saturated. Furthermore, the role of GO in the proliferation and differentiation of BMSCs is concentration-dependent. Low-dosage GO can effectively promote the proliferation and osteogenic differentiation of BMSCs, whereas high-dosage GO can restrain the activity of BMSCs. Based on the physical and chemical properties and in vivo and in vitro biocompatibility, HA-2wt%GO is considered the optimal Ti coating.
Although the in vivo and in vitro biosafety tests indicate that the prepared materials are harmless to cells, they cannot completely reflect possible adversities. Thus, in vivo experimental animal tissue-related osteogenic protein expression testing, long-term evaluation of in vivo implant testing, and related mechanistic studies should be further conducted. Despite these limitations, the HA-2wt%GO composite coating enhances the osteogenic differentiation of stem cells, which might provide new opportunities for the surface modification of implants.
Conclusions
In this study, a GO-modified HA composite coating was prepared on Ti sheets via EPD to improve cytocompatibility and promote osteogenic differentiation on pure Ti. The HA-GO coating revealed a dense nanoneedle or flower cluster crystal structure. Meanwhile, GO sheets can reduce cracks in the composite coating. The advantages of the HA-GO coating were as follows: (1) the HA-GO coating can improve hydrophilicity; (2) compared with the control (HA or GO alone) and pure Ti, the mixed coating can enhance the biological behavior of cells; (3) dense HA-GO coating can maintain healthy osteoblast activity and induce the osteogenic differentiation of BMSCs. Because of its excellent physical and chemical properties, ability to induce the regeneration of bone tissue, and cell compatibility, HA-GO has potential use as an implant surface coating for clinical treatment.
Footnotes
Acknowledgements
We would like to thank the Scientific and Technological Assistance Programs of Xinjiang province for their assistance and guidance in this research.
Author contributions
Wufanbieke·Baheti and HuiYu He searched the literature and conceived the study. ShangYi Lv, Mila, Lisha Ma, Dumanbieke·Amantai, and HaoSun were involved in protocol development, obtaining ethical approval, patient recruitment, and data analysis. Wufanbieke·Baheti wrote the first draft of the manuscript. All authors reviewed and edited the manuscript and approved the final version of the manuscript.
Declaration of conflicting interests
The author(s) declared no potential conflicts of interest with respect to the research, authorship, and/or publication of this article.
Funding
The author(s) disclosed receipt of the following financial support for the research, authorship, and/or publication of this article: This work was supported by the Scientific and Technological Assistance Programs of Xinjiang Province [grant number: No. 2020E02133].
Guarantor
HuiYu He