
Abstract
Background:
Due to the outstanding properties of graphene, researchers are considering it a good candidate for thin film encapsulation on polymer substrates. In this work, we produce a UV-cured resin prepared by an inexpensive solution technique for the encapsulation of graphene oxide (GO), mechanical exfoliation graphene (mG), reduced graphene oxide (rGO), graphite, and SiO2 nanofillers on the surface of a PET film for employment as an impermeable film.
Methods:
The water vapor transmission rate (WVTR) is measured for the UV-cured encapsulated nanofillers on PET films.
Results:
The WVTR was reduced to <10−2 g m−2/day for GO and rGO nanofillers with a thickness of 1 mm. Pencil scratch hardness tests performed on the encapsulated nanofillers deposited on the PET film showed them to be stable up to 5H–8H and the glass transition temperature results for the GO, mG, and rGO nanofillers on PET remained steady up to 180°C.
Conclusions:
The prepared UV-cured resin encapsulated graphene nanofillers coated on the polymer substrate by a simple solution method was shown to have good impermeability to water vapor.
Introduction
In recent decades, UV curing technology has received significant attention due to its distinctive advantages compared with temperature curing and high speed curing. 1 Although the recent development of polymer thin films using UV curing has enormous potential, these films degrade rapidly when they react with oxygen and water in chemical structures. 2 The preparation of thin and flexible devices is made possible by thin film encapsulation (TFE) on a polymer substrate, with a glass lid used in high performance organic light emitting diodes (OLEDs), large area displays, and solar cells.3,4 The glass lid is encapsulated and attached by a UV-curable resin, which is moisturized and used as curing resin substance. These OLED devices have high sensitivity but degradation is observed in the polymer system with the glass lid, which leads to insufficient resistance to permeants. Furthermore, they are not appropriate for large-scale production nor well suited for fabrication of flexible devices, for which TFE is needed. Barrier thin films with excellent environmental stability and low impermeability, suitable for flexible device production, are needed. Moreover, the efficiency of flexible devices is still low, due to the short life-time of the substrate used as the barrier material to ensure low water penetration and gas.5–8
Among the gas barrier materials, research has focused on graphene materials, based on their superior electrical,9,10 mechanical,11,12 and chemical properties.13–16 There is little reported in the literature on the thermal stability, tensile strength, and water resistance of different micro whiskers produced by the incorporation of graphene. The compact packing of a lattice of graphene atoms does not allow transmittance from gas and liquid molecules, and the material has attracted attention as a promising barrier material because of its extreme optical transparency and mechanical flexibility. There have been many reports detailing the use of graphene as a barrier film having a large surface area but few studies reporting on its performance in relation to gas impermeability. Various methods have been established to modify graphene oxide (GO) for the creation of polymer nanocomposites using polyallylamine and polyurethane as a matrix.16–20 Seo et al. fabricated large area graphene films with transparent encapsulation for potential application in flexible organic device packaging.21,22 Various methods have been demonstrated for the preparation of graphene gas barrier materials which are sensitive to vapor and oxygen. The inorganic materials used for TFE can be prepared by plasma vapor deposition, sputtering, or atomic layer deposition, but these methods are expensive and the rate of thin film growth is slow. Hence, it is important to find a cheap and simple process for the production of barrier thin films. The solution method for the mixing of graphene on polymer is simple and time consuming. The organic solvents used in the solution method are strongly absorbed and uniformly dispersed on the polymer substrate, which leads to particle aggregation. 23 Further, the low usage of solvent does not produce ecological effluence, and makes it possible to use this process for large-scale production at low temperatures.
It is well known that the surfaces of graphene sheets can be decorated with functional groups, which are used to restore conductivity and to improve the chemical properties of graphene-derived materials.24–26 Interestingly, the graphene-derived materials have high conductivity in the formation of polymer nanocomposites with a reduced separation threshold. Therefore, the carbon-based encapsulation materials can act as a high gas barrier, due to the layers of small thickness, as well as the enhanced mechanical flexibility of the encapsulation. Owing to these superior properties of graphene, we introduced graphene as a TFE on a polymer substrate.
Here we demonstrate the performance of encapsulated graphene-derived barrier materials on PET film. PET film has high transmittance and mechanical properties, and exhibits high impermeability to air and oxygen. However, the water vapor transmission rate (WVTR) of a PET substrate is higher than that of glass. To improve the WVTR of PET, multiple gas barrier layers are required on PET film. Consequently, in order to utilize the low cost nanoparticle fillers in the barrier structure, carbon nanofiller layers with different weight compositions and thicknesses were prepared. WVTR measurements were conducted for various graphene materials with different thicknesses. The graphene composition and photo-induced process were enhanced in order to obtain encapsulated reduced graphene oxide (rGO)/PET thin films, and to confirm their transparency and the large area of encapsulation with better water permeability.
Experimental procedure
Preparation of UV curing resin
First, 3-mercaptopropyltrimethoxysilane (MPS) was prepared with the addition of 3-trimethoxysilylpropyl methacrylate (MPTMS), absolute alcohol, and deionized water, at a ratio of 1:1.5:3. After being completely mixed, HCl was added to the above mixture with effective stirring at 25°C for 24 h. The pH of the solution was maintained at 4. Then, the solution was washed with copious amounts of saturated sodium chloride solution, to remove the acetic impurities and the water-soluble inorganics. In addition, ethyl acetate was added to extract the organic moieties present in the aqueous solution. Finally, a pinch of MgSO4 was mixed with extracted ethyl acetate solution to remove the residual water. The solution was then filtered using filter paper in order to remove the MgSO4·6H2O solids. Further, the ethyl acetate in the filtrate was evaporated using a rotatory evaporator in order to obtain a transparent MPS as a liquid. After this, TMPTA (trimethylolpropane triacrylate) was mixed with MPS to produce a polymer acrylic resin. MPS was used as the oligomer and TMPTA was used as the monomer.
Preparation of nanofiller composite material for UV curing sealant
Graphene nanofillers with 0.001% and 0.002% GO, mechanical exfoliation graphene (mG), and rGO were used in this work. In addition, in order to compare with traditional nanofillers, 10 and 20 wt % SiO2 nanofillers were used with 1 mm and 200 μm thick samples. The synthesized graphene nanocomposite films were blended with a photoinitiator (PI) before being dried at room temperature. The prepared PI/0.1 wt % (15 mg) graphite composite was dispersed in TMPTA/MPS acrylic resin and ultrasonicated for 2 h at room temperature. The degassed PI/graphite composites were deposited on a PET substrate and cured by UV light for 10–15 s. After UV curing, the solvent was evaporated and stacked to form a thick film on the substrate.
Characterization
The graphene-based nanofillers were characterized using a Fourier transform infrared (FTIR) spectrophotometer. The optical transmittance spectra were obtained using a UV-visible spectrophotometer (Hunterlab, Ultrascan VIS). The sample size of about 10 cm2 was measured using MOCON (PERMATRAN-W® Model 3/61) at an atmospheric pressure of 37.8°C at 100% relative humidity (RH) with a flow rate of 20 sccm per cell. The particle size of the graphene nanocomposites was measured by laser particle size analysis (Zetasizer Nano ZS 90). Transmission electron microscopy (TEM, JEOL-2100F) measurements were performed on all the graphene nanocomposites with different percentages of SiO2. Adhesive testing was carried out by a cross-cut adhesive tester (TQC, CC2200), and the pencil scratch hardness test was performed (using a Zehntner ZSH2090). A dynamic mechanical analysis (DMA) study was performed with a Perkin Elmer DMA 7e between temperatures of −70°C to 500°C, at frequencies of 0.01 Hz to 61.0 Hz. Furthermore, the glass transition temperature (Tg) of the encapsulated nanofillers was determined from the tan delta peak curve. Each sample was tested three times to obtain the average Tg values. Sun color tests (yellow test) were performed using sun test measurement (SUNTEST CPS ATLAS).
Results and discussion
FTIR analysis
The FTIR spectra of composites before and after curing are shown in Figure 1. Before curing, they show absorption peaks at 3000 cm−1 (Si–C), 1750 cm−1 (Si–O), and 1623 cm−1 (C=C aromatic rings).27,28 After curing, it can be seen that none of the encapsulated graphene derivatives was seen in the infrared range of 1530−1730 cm−1, where the C=C vibrational group disappeared. This signifies the completion of the curing reaction between the TMPTA and MPS resin.
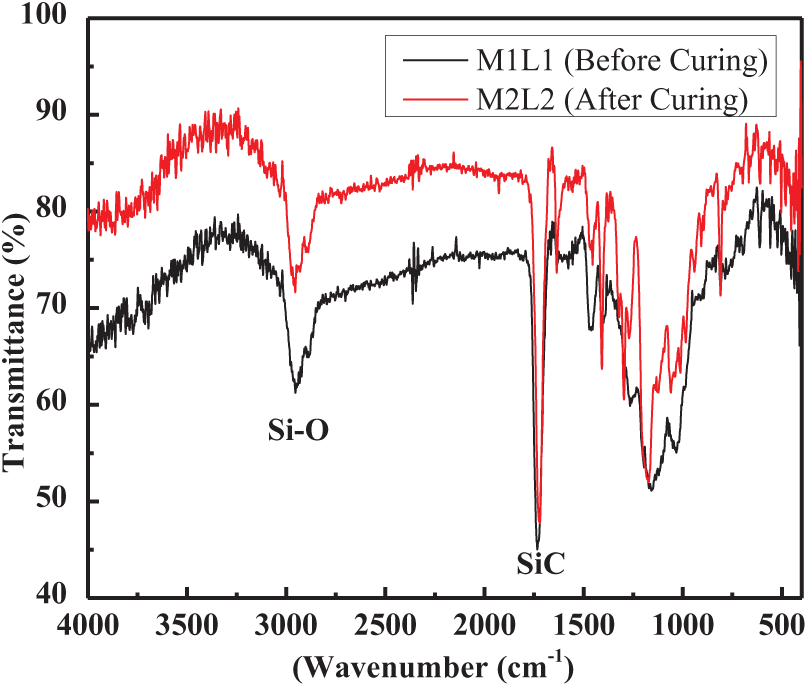
The FTIR spectra of before and after UV curing.
TEM measurement
Figure 2(a) to (e) show TEM images of different graphene nanofillers of GO, mG, rGO, graphite (gr) and SiO2, with various sizes. The TEM image of GO shows the stacked single-layer sheets created due to the presence of highly enriched oxygen functionalities in their edge and basal planes. 29 It can be observed that the GO nanosheets are comprised of very thin layers having a rough surface with a randomly arranged thin, sheet-like structure. 30 The GO sheets actively dispersed in water due to their hydrophilic nature, which makes them incompatible with the polymer substrate. In Figure 2(a) there is some aggregation of the GO, and optimization of the inherent properties of nanofiller structure. However, the rGO shows a wrinkled and wrapped topology, which is generated from thermal reduction of the GO. However the observed defects only retained their raw GO, and there were no nascent defects during the controlled thermal reduction of GO. 31 Figure 2(d) shows the graphite nanofiller to have a smooth surface composed of many graphene sheets which do not affect the morphology. Moreover, as can be seen in Figure 2€, the SiO2 nanoparticles are smaller in size. The GO, mG, rGO, gr sheets, and SiO2 nanoparticles are 406, 509, 769,750, and 221 nm in size, respectively. The rGO and Gr nanofillers consist of flat smooth sheets with a high contact area. The small particles easily allow the passage of gas and water molecules through the encapsulated graphene derivative nanofillers on the PET film, thereby enhancing permeability to water and air.
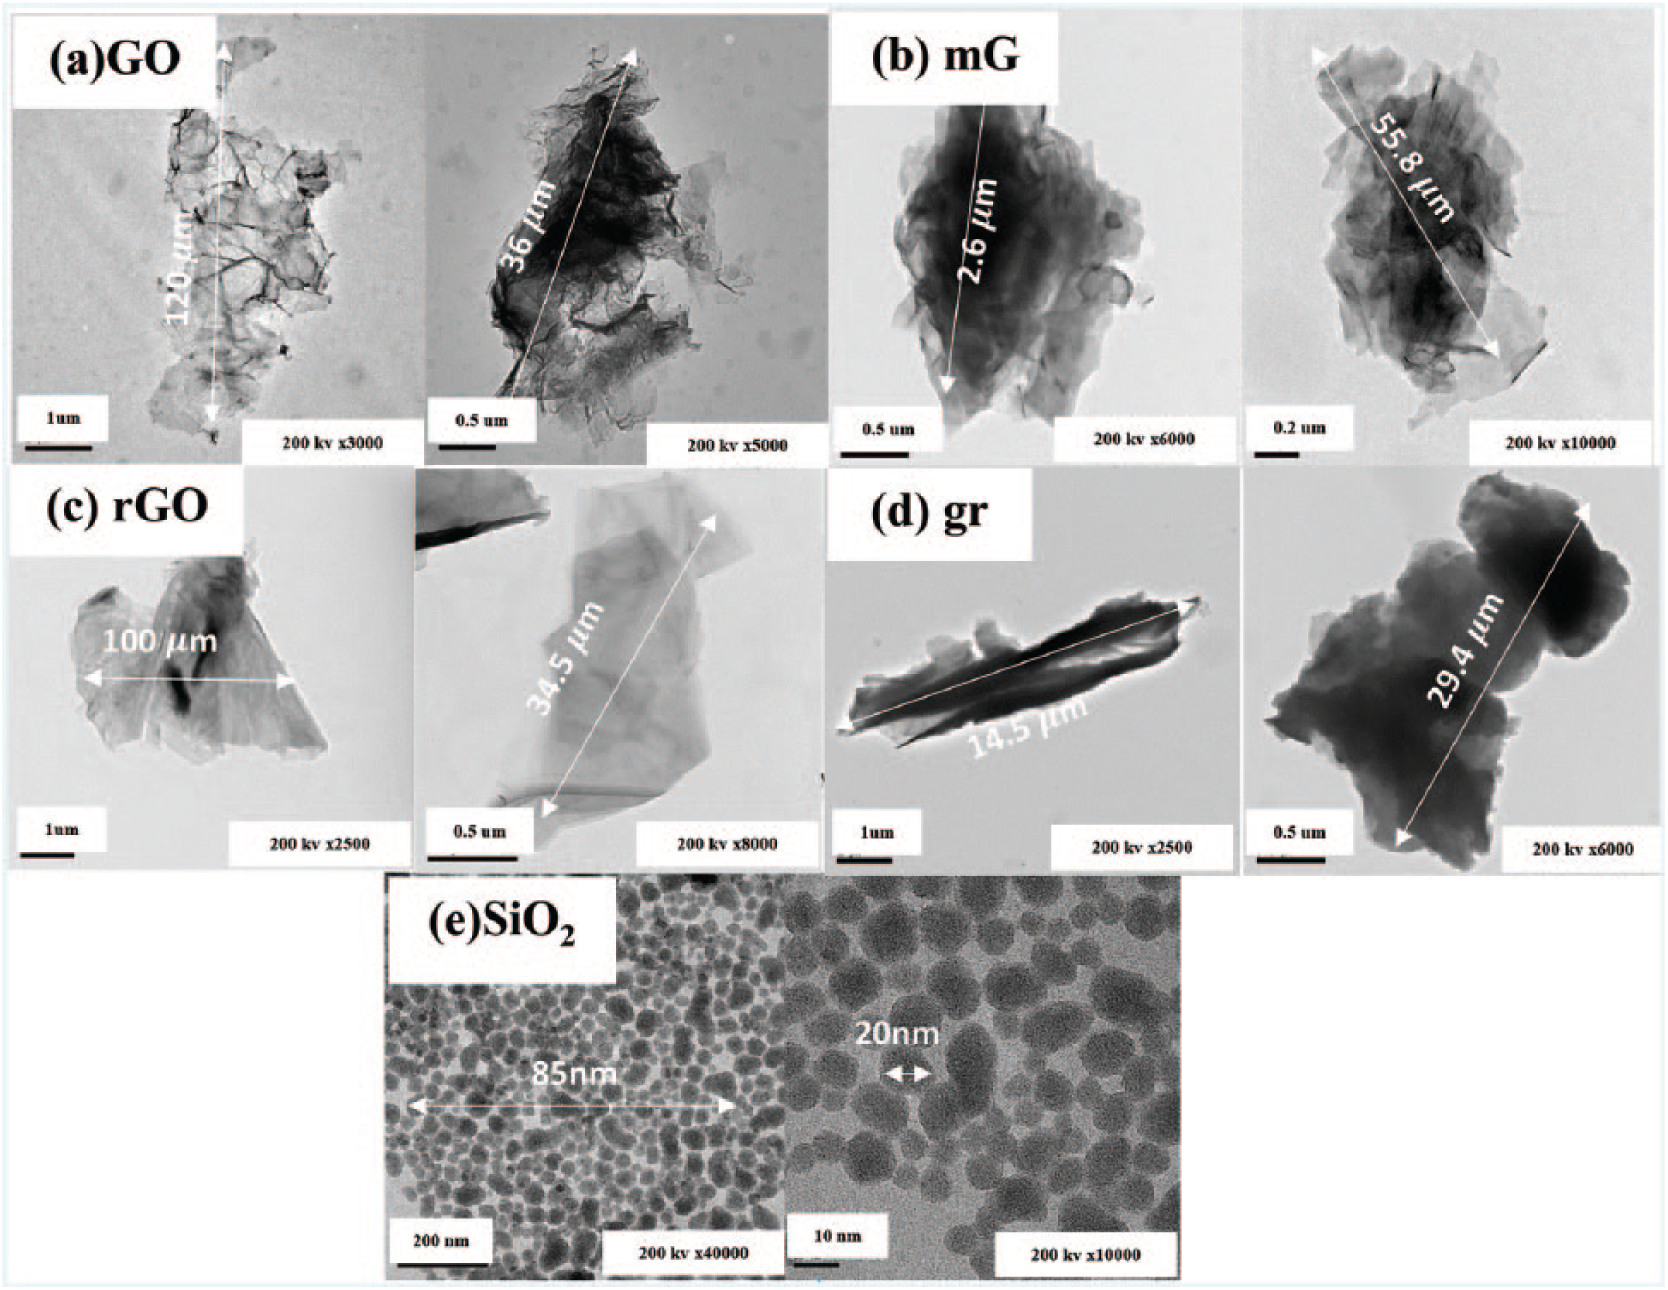
TEM images of different graphene nanofillers of (a) GO, (b) mG, (c) rGO, (d) gr, and (e) SiO2.
WVTR measurement
The water vapor permeability for different compositions of graphene nanofillers encapsulated using acrylic resin on a PET substrate was observed through MOCON values. Table 1 shows the MOCON values for GO, mG, rGO, gr, and SiO2 nanofiller samples with weight ratios of 0.001 and 0.002, in 200 µm and 1mm thick layers deposited on PET film. The M1T1 indicates the value of the oligomer and monomer nanocomposite on a PET film without the addition of nanofillers. WVTR values of 200 µm layers were as follows: GO 2.730 (0.001 wt %), 2.532 (0.002 wt %), mG 2.806 (0.001 wt %), 2.621(0.002 wt %), rGO 2.575 (0.001 wt %), 2.475 (0.002 wt %), gr 2.794 (0.001 wt %), 2.610 (0.002 wt %), and SiO2 1.466 (0.001 wt %), 1.246 (0.002 wt %). The lowest value of <10−2 g m−2/day was observed for the GO, rGO, and gr nanofillers with 0.002 wt % and a thickness of 1 mm. The WVTR investigation shows that for the 1 mm thick sample, a small gap persists between the PET thin film and the graphene structure, which effectively blocks the permeation of water and oxygen molecules. The results demonstrate that the encapsulation of nanofillers is suitable for gas barrier applications, which agrees well with other recent results. 32 The SiO2 nanofiller does not show good permeability stability, with higher WVTR values observed after increasing the thickness to 1 mm. Table 1 shows the superior WVTR performance of all rGO and gr nanofillers when compared with SiO2. Compared with all the other graphene compositions, GO, mG, rGO, and gr have ideal values of <10−2. The graphene composites with 1 mm thickness show good vapor permeability performance.
MOCON values for encapsulated GO, mG, rGO, gr, and SiO2 nanofillers on PET film.

When the encapsulated nanofillers were UV cured at 65°C, the WVTR values increased, making them unsuitable for controlling the permeability of water and air. There was no significant change after high temperature UV curing of the graphene nanofillers. We still obtained values close to those for pure PET (2.782 g cm−2/day). This shows that high temperature UV curing did not enhance the WVTR values for the production of reliable barrier materials, as shown in Table 1. For 1 mm thick nanofillers on PET, there was a significant change in the WVTR from the original value of <10-2 g / cm2 to 1.33 after UV curing at 65o C. During high temperature UV-curing, the encapsulated nanofillers are subject to high humidity and absorb water well, leading to damage of the polymer structure of the PET.
Adhesive test
Table 2 shows the adhesive test results for all the encapsulated graphene derivatives and SiO2 nanofillers on PET. In this study, the graphene nanocomposite resin demonstrated good adhesive behavior and excellent bonding with the PET substrate. The adhesive test results showed an excellent adhesion effect for all 100-grid tests (the results are 5B). It can be seen that the edge of the film is completely smooth and flush with the lattice edge without any peeling. These results indicate that very good adhesion can be obtained with the incorporation of graphene derivatives, producing a smooth surface and good stability. The graphene demonstrates π−π interaction, so it can easily interact with the PET substrate. Furthermore, the presence of hydroxyl groups produces very strong π−π interactions along the PET chains.33,34
The adhesive test of encapsulated graphene and SiO2 nanofillers on PET film.

The results shown in Table 2 indicate that the agglomeration and morphology of the all the graphene nanofillers enhances the water resistance of the PET. In addition, the strong π−π interactions of the aggregates and the good interface adhesion with the PET lead to a decrease in the permeability of the water molecules. Moreover, higher concentrations of graphene nanofiller led to the formation of several micron sized sheets and caused discontinuity in the aggregated particles, which led to a decrease in mechanical performance. A lower concentration of encapsulated graphene nanofillers led to higher adhesive behavior, when compared with a higher concentration. In silica nano particles, agglomeration occurs very easily over large areas, and is more serious than with graphene. With the graphene sheet structure, increasing the water vapor through the path successfully reduced the water vapor permeability to <10−2 g cm−2. The hardness tests show that the material has good scratch-resistance. This hardness is an important property for water vapor permeability. The encapsulated rGO and gr nanofillers after UV light curing of the adhesive showed a hardness of about 5H–6H. The hardness of the SiO2 composites was reduced to 7H, which is very low compared with all other graphene materials. For a 1 mm thick sample, it was found that the encapsulated graphene nanofiller was more elastic than the silica nanofiller, as shown in Table 2. This confirms that a thick layer of nanocomposites is not better for encapsulation when compared to a thin layer.
Glass transition measurement
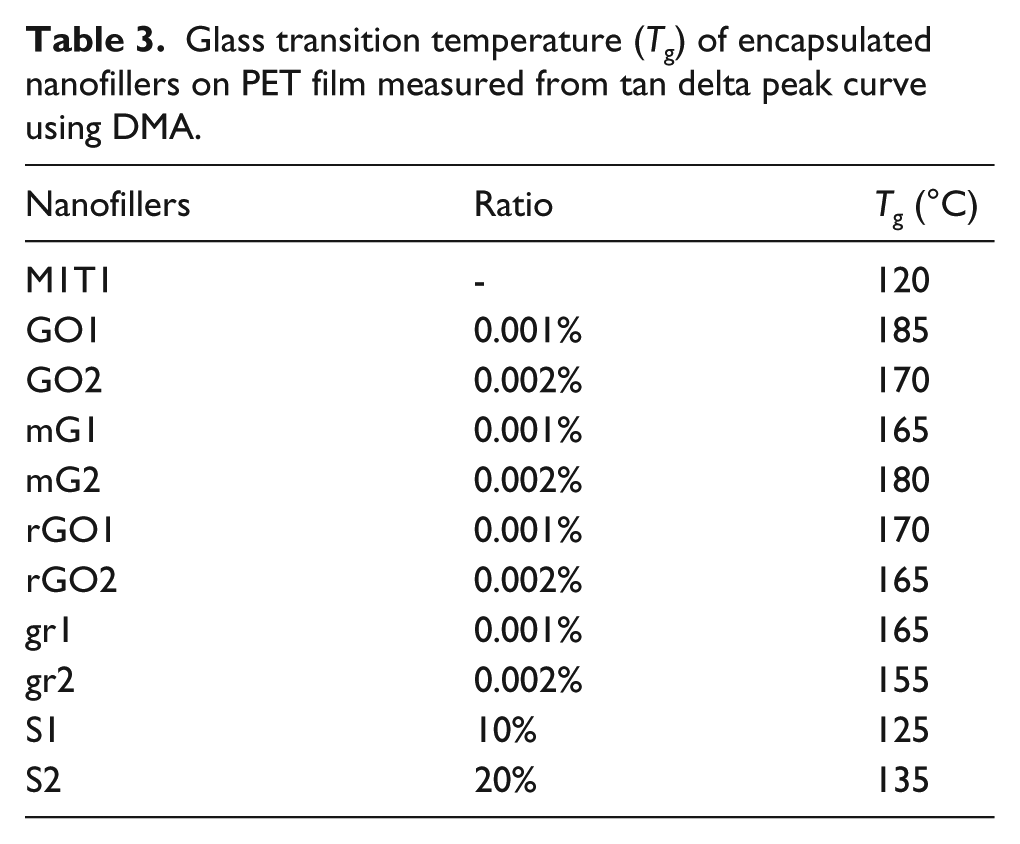
The Tg values of encapsulated nanofillers were measured from the tan delta peak curve using DMA, as shown in Table 3. There was a significant change in the Tg of the encapsulated SiO2 nanofillers above 125°C with encapsulated graphene nanofillers observed between 155 and 180°C. When we coated encapsulated graphene nanofillers on the PET, the nanoparticles had a confinement effect, which increased the Tg of the encapsulated nanofillers. The main contribution to the increment in Tg was from the contact between the graphene sheets and the polymer thin films. Compared with other graphene nanofillers, rGO and gr demonstrated better dispersion and stronger interfacial adhesion with the PET matrix. The superior behavior of the encapsulated rGO and gr nanofillers can be attributed to their uniform and smooth dispersion. Usually, the nanofiller had good adsorption with the polymer matrix, due to low permeability, which in turn enhances the paths for gas and water molecules. 35 When GO and mG were deposited they showed poor compatibility with the PET substrate, so they were not in close contact with the graphene nano sheets. Therefore, gas molecules could not easily flow through the GO and mG in the polymer matrix. In addition, the mechanical exfoliation process is related to surface tension of the material, which improves the total area of graphite crystallites. The GO had poor quality with a significant number of defects that need to be reduced. The poor adhesion between the GO nanofiller and polymer makes for a non-rigid surface. 36 Compared with the GO and mG, the rGO and graphite demonstrated better adsorption when deposited on PET, which is in good agreement with the WVTR result.
Glass transition temperature (Tg) of encapsulated nanofillers on PET film measured from tan delta peak curve using DMA.
Color coordination test
The color coordinates (L*a*b*) observed for all the encapsulated graphene nanofillers before and after a week of sun tests are shown in Table 4. The L* values of the all the encapsulated graphene nanofillers indicate more than 95% transmittance, which lends transparency to the entire sample. A comparison of all the encapsulated nanofillers shows the gr sample to be more transparent which makes this the most effective material for low impermeability. From Table 4, we can see that there is a strong increase in the yellow color component for encapsulated GO, mG, and SiO2. Furthermore, the color coordinates show a reduction of the b* and a* for the encapsulated mG, rGO, and gr nanofillers. These color coordinates indicate various color changes related to the lower oxygen vacancies from all the encapsulated GO, mG, rGO, and gr nanofillers. There is a decrease in the b* and a* values of encapsulated GO and mG due to the loose bonding of the particles partially attached to the PET substrate. Moreover, after 10 days of sun tests no imperative change was observed in the b* values of any of the encapsulated graphene nanofillers. However, in the case of the encapsulated SiO2 nanofillers there was a larger change in the b* values. These results prove that the encapsulated graphene derivatives coated on PET were stable up to ten days without any degradation.
The color coordinate (b*) for all the encapsulated graphene nanofillers, before and after a week of sun tests.

Summary
In this work, UV-cured resin encapsulated graphene nanofillers on PET composites were prepared by a simple solution method, which was shown to have good impermeability to water vapor. The optimal WVTR ratio was observed to be >10−2 g/day. The sun test performance results produced b* values of 1.3106 and 1.4047 before and after 10 days of exposure, without any significant change. The long sheet shape of GO helps to improve intrinsic defects in the polymer. After the addition of nanofillers, the agglutination of graphene sealants demonstrated good adhesion to the PET. Adhesive testing of the encapsulated graphene derivatives produced a value of 5B and a hardness of 5H–8H. There was no obvious yellowing of the samples after one week under 500 W sun during performance testing. The Tg of the TMPTA was observed at 120°C. After the addition of encapsulated graphene derivatives the Tg was observed between 155 and 185°C, and after the addition of encapsulated SiO2, the Tg was 125°C. It is worth noting that a lower permeation rate and less degradation of the composites could be achieved by TMPTA encapsulation.
Footnotes
Acknowledgements
The authors thank the Precision Analysis and Research Centre, National Taipei University of Technology, Taipei, for their financial support of doing this research.
Declaration of Conflicting Interests
The authors declared no potential conflicts of interest with respect to the research, authorship, and/or publication of this article.
Funding
The authors disclosed receipt of the following financial support for the research, authorship, and/or publication of this article: Ministry of Science and Technology, Taiwan, (MOST-107-2119-M-027-001)