
Abstract
Aim:
Resistance to sliding between bracket and wire is present, in a different magnitude, in most orthodontic treatments and it affects the biomechanics of the tooth movement. However, the influence of loop design on resistance to sliding is currently unknown.
Methods:
In total, 12 stainless steel orthodontic wires of different sizes (0.016″×0.022″; 0.017″×0.025″), loop height (6mm, 8mm, 10mm), and loop type (open, close) were analyzed. Wires were tied with elastic ligatures to a bracket and tested during sliding at 0.5 mm/min. Straight wires were used as controls. Differences in the force to start the sliding (N), force during the sliding (N), and displacement to start the sliding (mm), were evaluated with Kruskal–Wallis one-way analysis of variance and Mann–Whitney tests (α=0.05).
Results:
Open loops had a lower force to start the sliding compared to straight wires (p<0.05), and some closed loops showed a similar trend. Open loops had lower force during the sliding compared to straight wires, but closed loops were less predictable. Displacement to start the sliding increased with loop height, and differences were present between loops and straight wires (p<0.001). Force to start the sliding and force during the sliding changed relative to loop type (p<0.05), and closed loops showed higher resistance to sliding. Differences were also found in force to start the sliding and force during the sliding between wire sizes, with larger wires associated with higher forces (p<0.05).
Conclusions:
Loops should be considered as significant variables in the resistance to sliding, as they can influence both the amount of force and the onset of sliding. Compared to straight wires, rectangular wires with open loops may help clinicians reduce resistance to sliding. Further studies are necessary to confirm these preliminary findings.
Introduction
Resistance to sliding (RS) is relevant in orthodontics because of the biomechanical effects of friction on clinical treatments.1, 2 Studies have reported several variables affecting the RS, such as material composition 3 and surface, 4 size of bracket and wire, 5 ligating force, 6 velocity, 7 and wetness. 8 Even though changing some materials’ characteristics allows for control of the RS, this should not be the only option available to clinicians to control this biomechanical variable.
Wire elasticity can influence the RS, which is evident when the distance between brackets is reduced, decreasing wire elasticity and increasing the RS.9, 10 This phenomenon is supported by the demonstration that the critical contact angle, i.e. the angle at which the wire keeps contact with the slot of the bracket, can affect the RS,5, 11, 12 and that the critical contact angle itself is affected by the elastic properties of the wire.9, 10
In the presence of a loop, mechanical properties of the wire such as the load/deflexion ratio change, 13 thus the contact force on the bracket surface may change, and wire geometry is also modified, 13 thus the contact surfaces may also change. As a result, the RS may also be altered.
The RS is relevant in orthodontic sliding-mechanics, which are primarily based on the sliding of the wire. 14 Although in some situations the loop may interfere with the sliding, e.g. when the space occupied by the loop is similar to the inter-bracket distance, loops are still compatible with sliding when long segments of the wire are present between two brackets. For example, in the case of alternate bracket bonding during the initial levelling of the dentition, 15 in the presence of impacted or missing teeth, 16 and during the space closure after extraction of teeth. 17 Furthermore, in non-sliding mechanics that are primarily based on loops, 14 sliding of the wire is still present. For example, during the activation of loops for the retraction of the anterior teeth, the wire slides in all brackets posterior to the space to be closed. 15
The current main options to reduce the RS are reducing the ligation force, 6 increasing the size of the bracket slot, 5 or reducing the size of the wire, 5 which all negatively affect the control of the tooth movement by increasing the wire-play. 18 Thus, alternative methods should be investigated.
Perhaps surprisingly, even though it is common to use loops to control the mechanical properties of wires, 19 to the best of our knowledge no published studies have investigated how to control the RS through the use of loops.
The objective of the present study was to analyze the opportunity to enhance the clinical management of the RS using loops on wires. The hypothesis was that the presence of a loop and its geometrical characteristics affect the amount of RS of an orthodontic wire ligated to a bracket.
Materials and methods
Experimental test set-up
A stainless steel (SS) preadjusted bracket for upper left premolar with slot 0.018″ (GAC, Japan) was utilized with different wires ligated with elastic ligatures (G&H Orthodontics, United States of America (USA)). In total, 12 SS wires (Remanium Dentaurum, Germany) of different sizes (0.016″×0.022″, 0.017″×0.025″), loop type (close, open), and loop heights (6.00 mm, 8.00 mm, 10.00 mm) (Figure 1), were tested. Two straight wires of different diameters (0.016″×0.022″, 0.017″×0.025″) were utilized as controls. Each wire was tested 10 times, resulting in 140 tests.
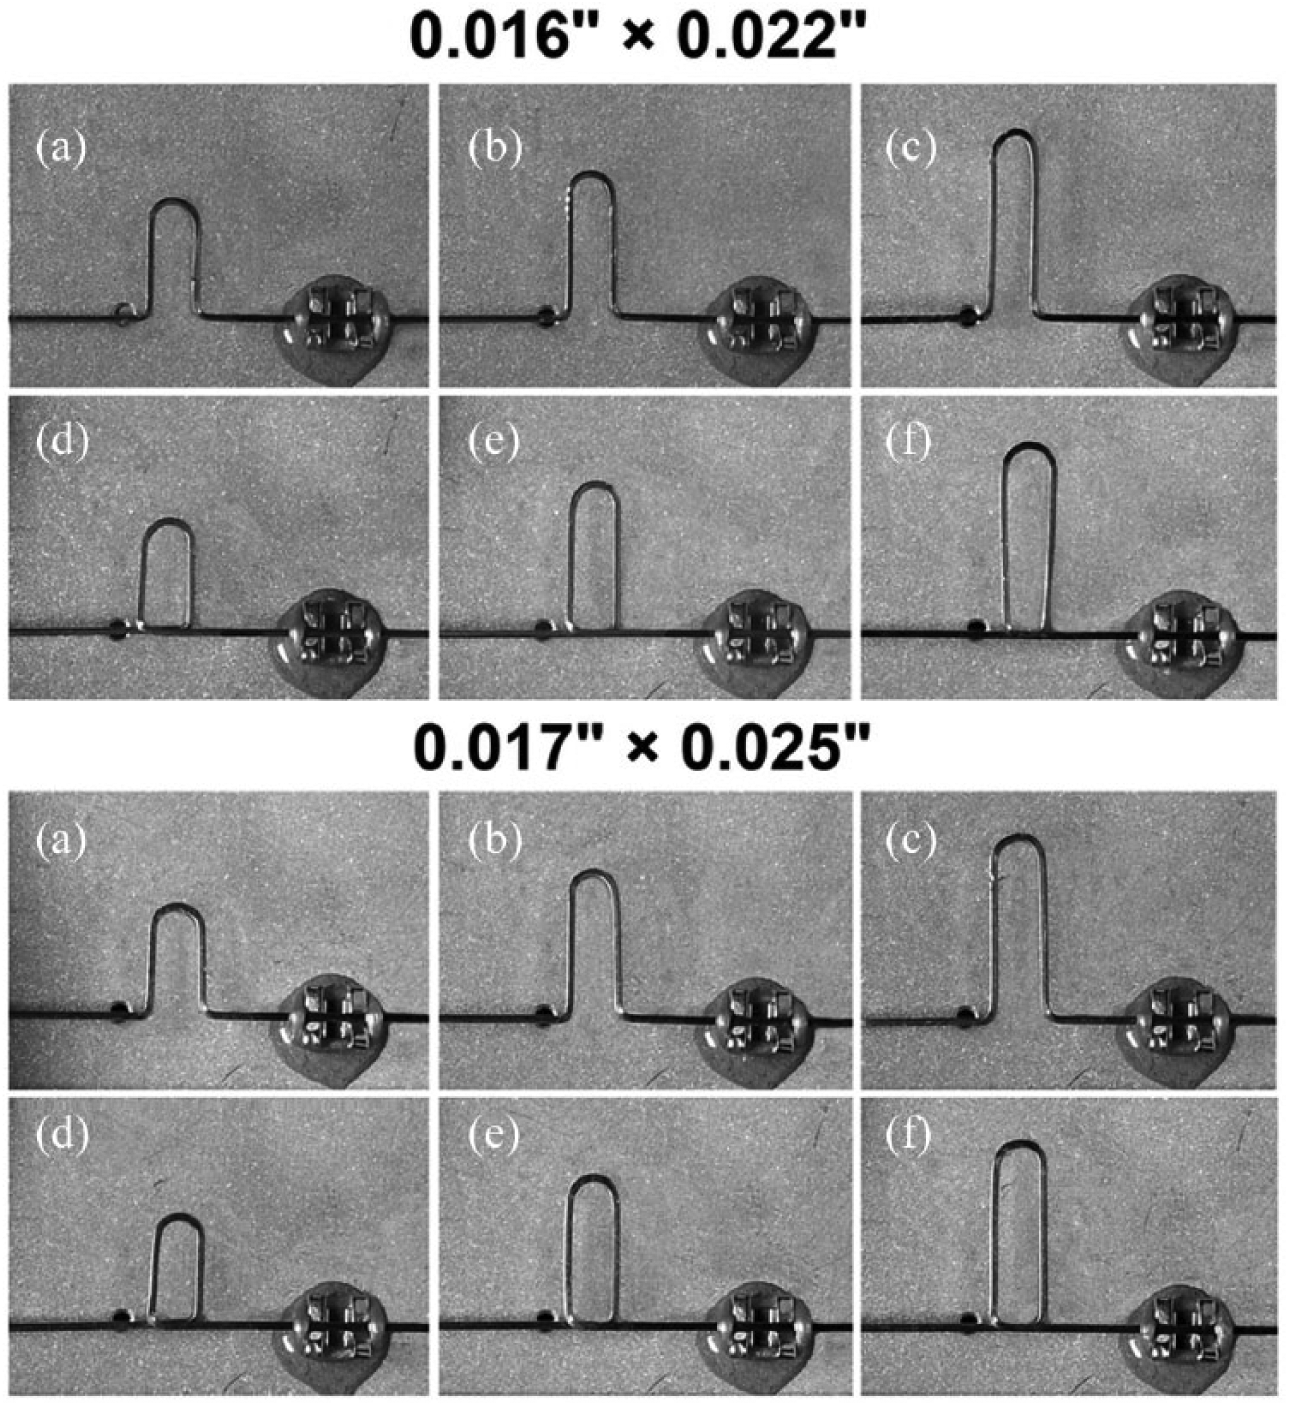
The 12 different loops tested in the 0.016″×0.022″ (upper) and 0.017″×0.025″ (lower) diameters. (a), (b), and (c) are open loops of 6 mm, 8 mm, and 10 mm. (d), (e), and (f) are closed loops of 6 mm, 8 mm, and 10 mm.
Loops were manually pre-formed with an internal diameter of 2.5 mm (measured with a Vernier caliper, ±0.2mm), and left for 24 h for stress relaxation before testing. The top edge of the loop was positioned 7.5 mm from the top edge of the bracket (Figure 1). The custom-made testing model (Figure 2) had the bracket fixed using epoxy resin (SIC Corporation Ltd.) and left to harden for 24 h. To eliminate the effect of the angular information of the bracket slot, an SS jig (0.017″×0.025″) was used during the hardening of the glue to hold the slot of the bracket parallel, that is, with a neutral orientation to the sliding direction (Figure 2). Tests were performed in dry conditions, using a universal testing machine (Instron ElectroPuls E3000, USA), with a static load cell of ±500 N. The testing velocity was 0.5 mm/min along a displacement of 4.00 mm, and data were collected at 100 Hz.
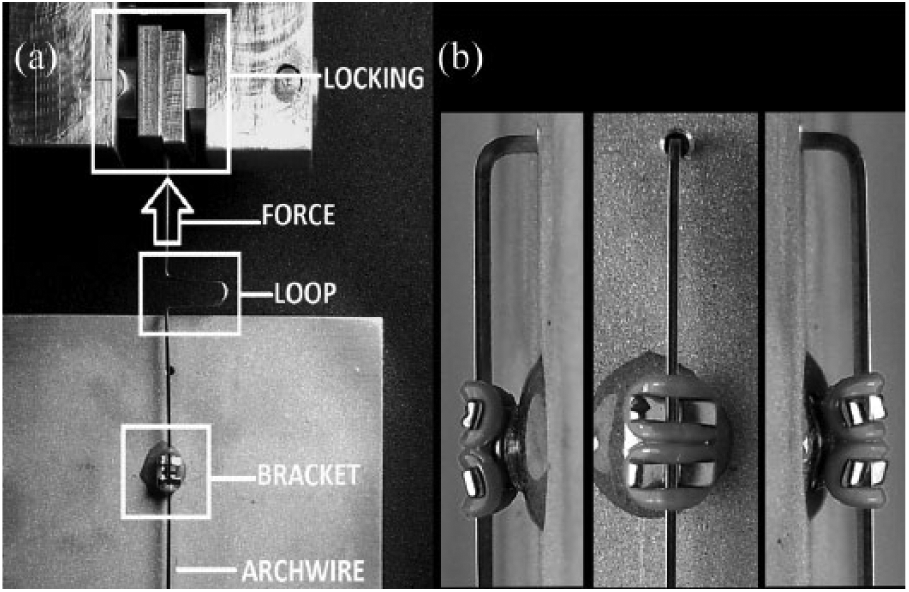
The bracket was fixed on the aluminum plate and held with the slot vertical and perpendicular to the floor, whereas the wire was connected with the locking system of the testing machine for force application (loop position is for reference only) (a). During glue hardening the orientation of the bracket’s slot was maintained neutral (parallel) respect to the sliding direction using a 0.017″×0.025″ wire jig, which was removed after 24h (b).
Control tests were carried out to verify the correctness of the neutral position of the bracket slot, to verify that no sliding was present between the wire and the clamps and that the elasticity of the glue was not relevant.
On the force/displacement diagram, the first part of the growing function was identified as the elastic deformation region of the loop. The point of transition from a growing function to a plateau was identified as the beginning of the sliding and not as the plastic deformation region, because the parallelism of the wire was checked after testing and no deformation was present (Figure 3). Then, three parameters were analyzed: the force to start the sliding (FSS), that is, the force value when the force or displacement function starts becoming constant, the force during the sliding (FDS), that is, the average force while the force or displacement function is represented by a plateau (after the FSS value), and the displacement to start the sliding (DSS), that is, the length value corresponding to the FSS value (Figure 3).
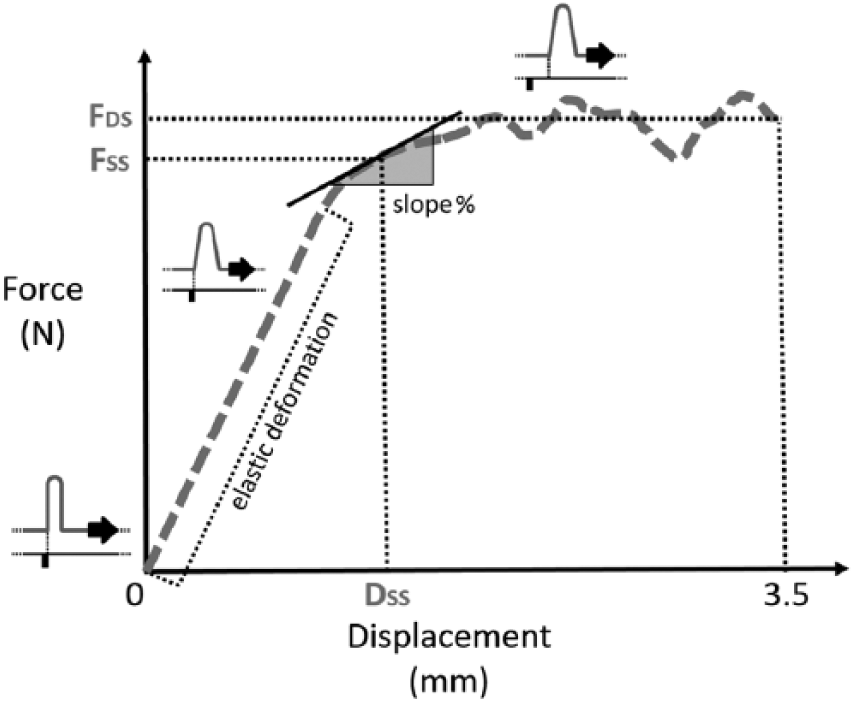
Example of force or displacement diagram of the test from 0.00 to 3.50 mm. After the elastic region of the deformation of the loop, the beginning of the slope (%) was used to identify the transition from force to start the sliding (FSS) to force during the sliding (FDS). No plastic deformation was present, and in this case the region of the curve that in a standard force-displacement diagram is associated to permanent deformation of the material represents the beginning of the sliding. This point was identified as FSS, the respective displacement to start the sliding (DSS) was determined on the horizontal axis, and the FDS was calculated as the mean force between the DSS and 3.50 mm.
Model-reliability assessment
The first control test was carried out to verify the correct alignment of the bracket slot in the neutral position, pulling a straight wire without ligature. The second tensile test was carried out locking one side of a straight wire on the support and clamping the other side in the locking system, then applying tension to verify the wire could not slide in the clamps. The final control test was carried out pulling a straight wire with one side locked on the bracket, to verify the elasticity of the glue was not relevant.
Statistical analysis
Data were processed with SPSS v.22 (IBM, USA), evaluating the normality of the data distribution using the Shapiro–Wilk test (α=0.05). The Kruskal–Wallis one-way analysis of variance for unpaired values was used to check differences between different heights, with the Mann-Whitney test as post hoc evaluation applying the Bonferroni correction of significance (α=0.05/4=0.0125). The Mann–Whitney test for unpaired values was used to compare different wire sizes and loop types (α=0.05).
Results
Data were not normally distributed (p<0.05) and non-parametric tests were applied. The first control tests showed a mean RS<0.05 N, confirming the parallel orientation of the slot; the second and third control tests showed a rapid increase in the force associated with small displacements, confirming negligible sliding of the wire in the clamps and negligible elasticity of the glue, respectively.
Frictional forces
Regarding the FSS, among the 0.016″×0.022″ samples, the smallest FSS was shown by high open loops (0.34 N), and the greatest by high closed loops (0.53 N). Among the loops of 0.017″×0.025″ size, results were similar, with the lowest value associated to high open loops (0.55 N), and the greatest to high closed loops (0.81 N) (Table 1 and Figure 4A).
Values of the FSS, FDS, and DSS related to the loop height (0 = straight wire, and 6 mm, 8 mm, 10 mm).
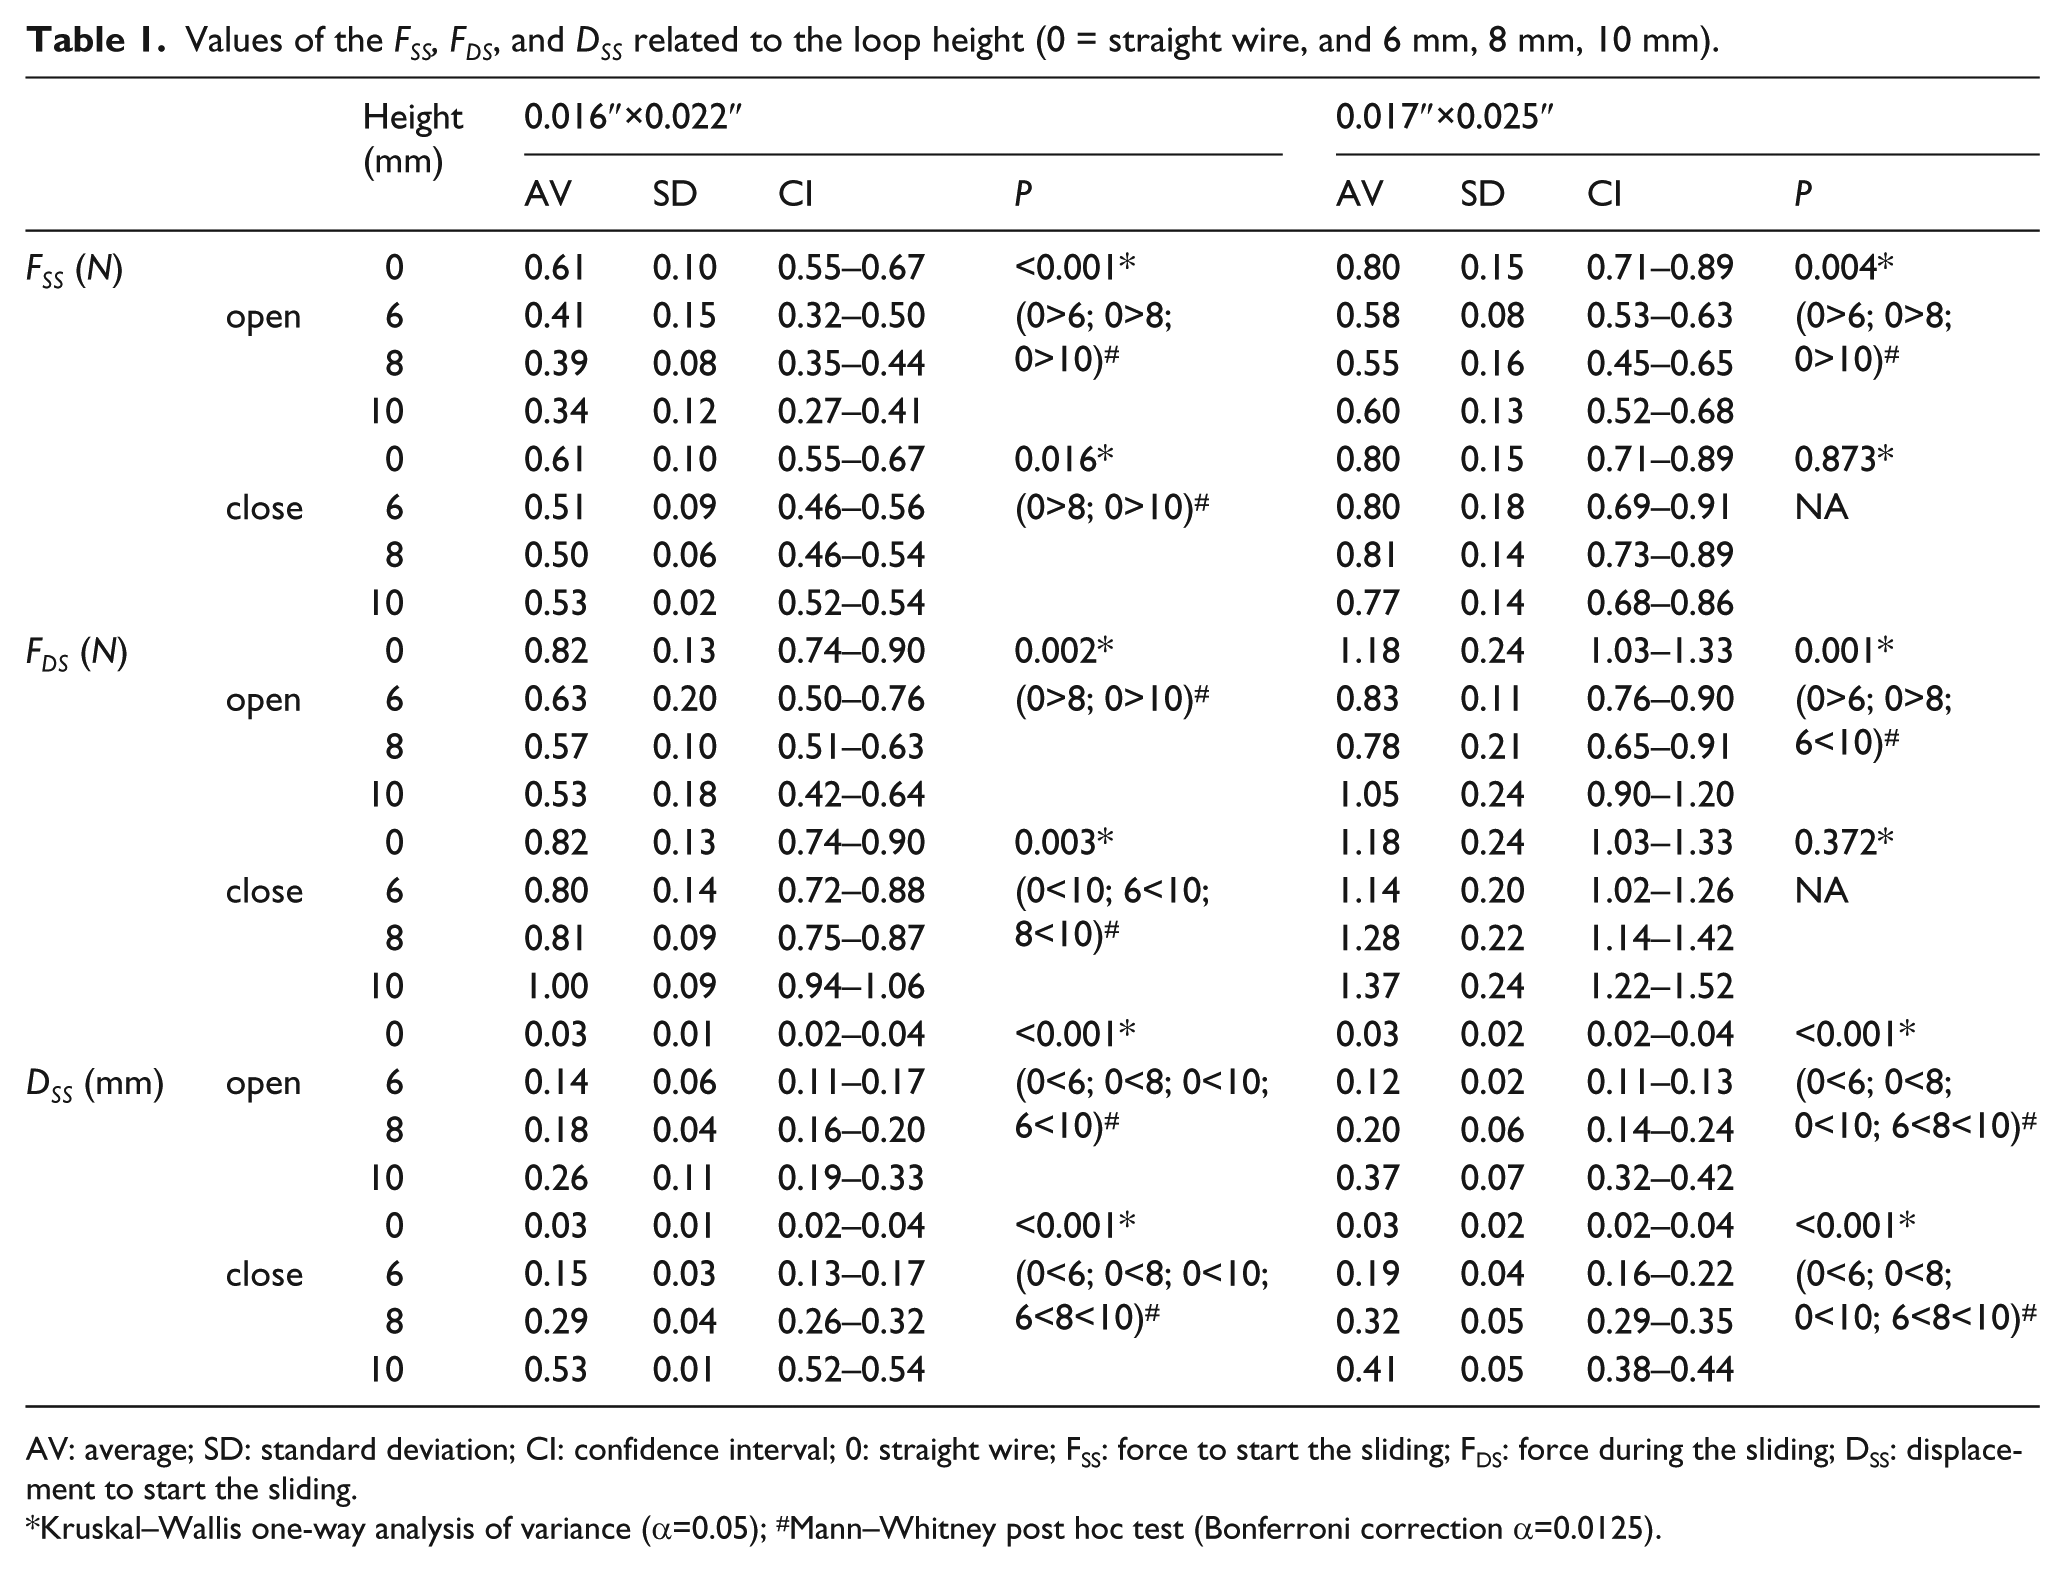
AV: average; SD: standard deviation; CI: confidence interval; 0: straight wire; FSS: force to start the sliding; FDS: force during the sliding; DSS: displacement to start the sliding.
Kruskal–Wallis one-way analysis of variance (α=0.05); #Mann–Whitney post hoc test (Bonferroni correction α=0.0125).
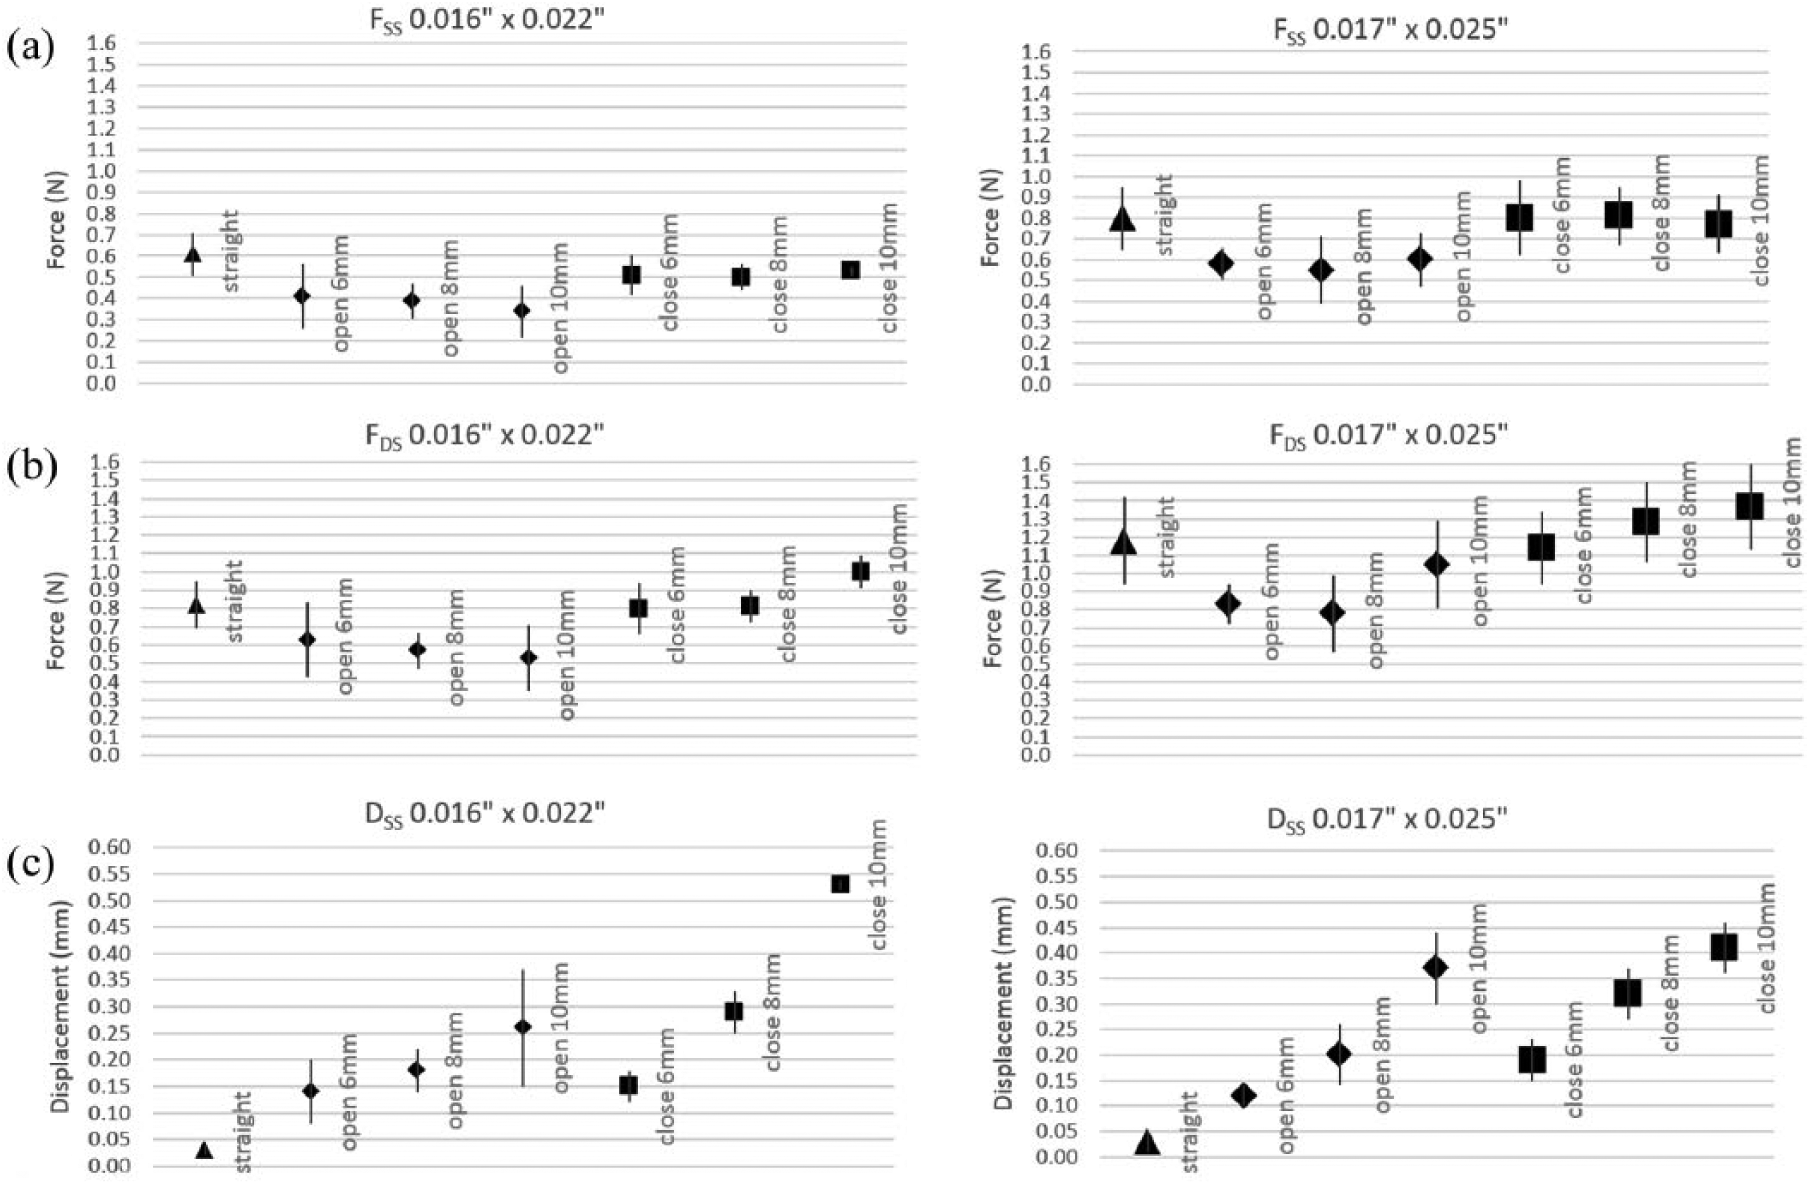
Average values of the 0.016″×0.022″ wire (left, markers of small size) and of the 0.017″×0.025″ wire (right, markers of large size), relatively to force to start the sliding (
Relative to the FDS, among the 0.016″×0.022″ samples, the lowest FDS was shown by high open loops (0.53 N) and the greatest by high closed loops (1.00 N). Among the 0.017″×0.025″ samples, results were similar, with the lowest value associated to high open loops (0.78 N) and the greatest to high closed loops (1.37 N) (Table 1 and Figure 4B).
Wires with loops always revealed greater DSS than straight wires. Among the 0.016″×0.022″ samples, the greatest DSS was shown by close high loops (0.53mm), and among the 0.017″×0.025″ samples by close high loops as well (0.41 mm) (Table 1 and Figure 4C).
Relationship with loop height
Regarding FSS, open loops resulted in lower values compared to straight wires of both 0.016″×0.022″ (p<0.001) and 0.017″×0.025″ (p=0.004) size. Similar results were shown by closed loops in the 0.016″×0.022″ size (p=0.016), but the 0.017″×0.025″ size did not show significant difference to straight wires (p=0.873) (Table 1).
FDS had a similar behavior with regard to open loops, which showed lower values compared to straight wires in both the 0.016″×0.022″ (p=0.002) and 0.017″×0.025″ (p=0.001) size. However, a less regular pattern was shown by 0.016″×0.022″ loops, and no significant differences to straight wires were shown by 0.017″×0.025″ loops (p=0.372) (Table 1).
All values of DSS increased from straight wires to high loops, for both close and open loops of 0.016″×0.022″ and 0.017″×0.025″ size. Significant differences were present in all samples compared to straight wires (p<0.001), and among almost all different loop heights (Table 1).
Comparison between different loop types
Significant differences were found between open and closed loops regarding both FSS and FDS (p=0.019 to p<0.001). Absolute differences ranged from 0.11 N to 0.50 N, and relative differences between 22.0% and 80.4%, with closed loops always related to greater force.
Concerning the DSS, closed loops were associated with greater values compared to open ones. Differences ranged from 0.01 mm to 0.27 mm in absolute values and from 6.7% to 50.9% in relative values (Table 2).
Absolute and relative (%) differences (Δ) between loop type (open vs close) and diameters (0.016″×0.022″ vs 0.017″×0.025″), concerning FSS, FDS, and DSS.
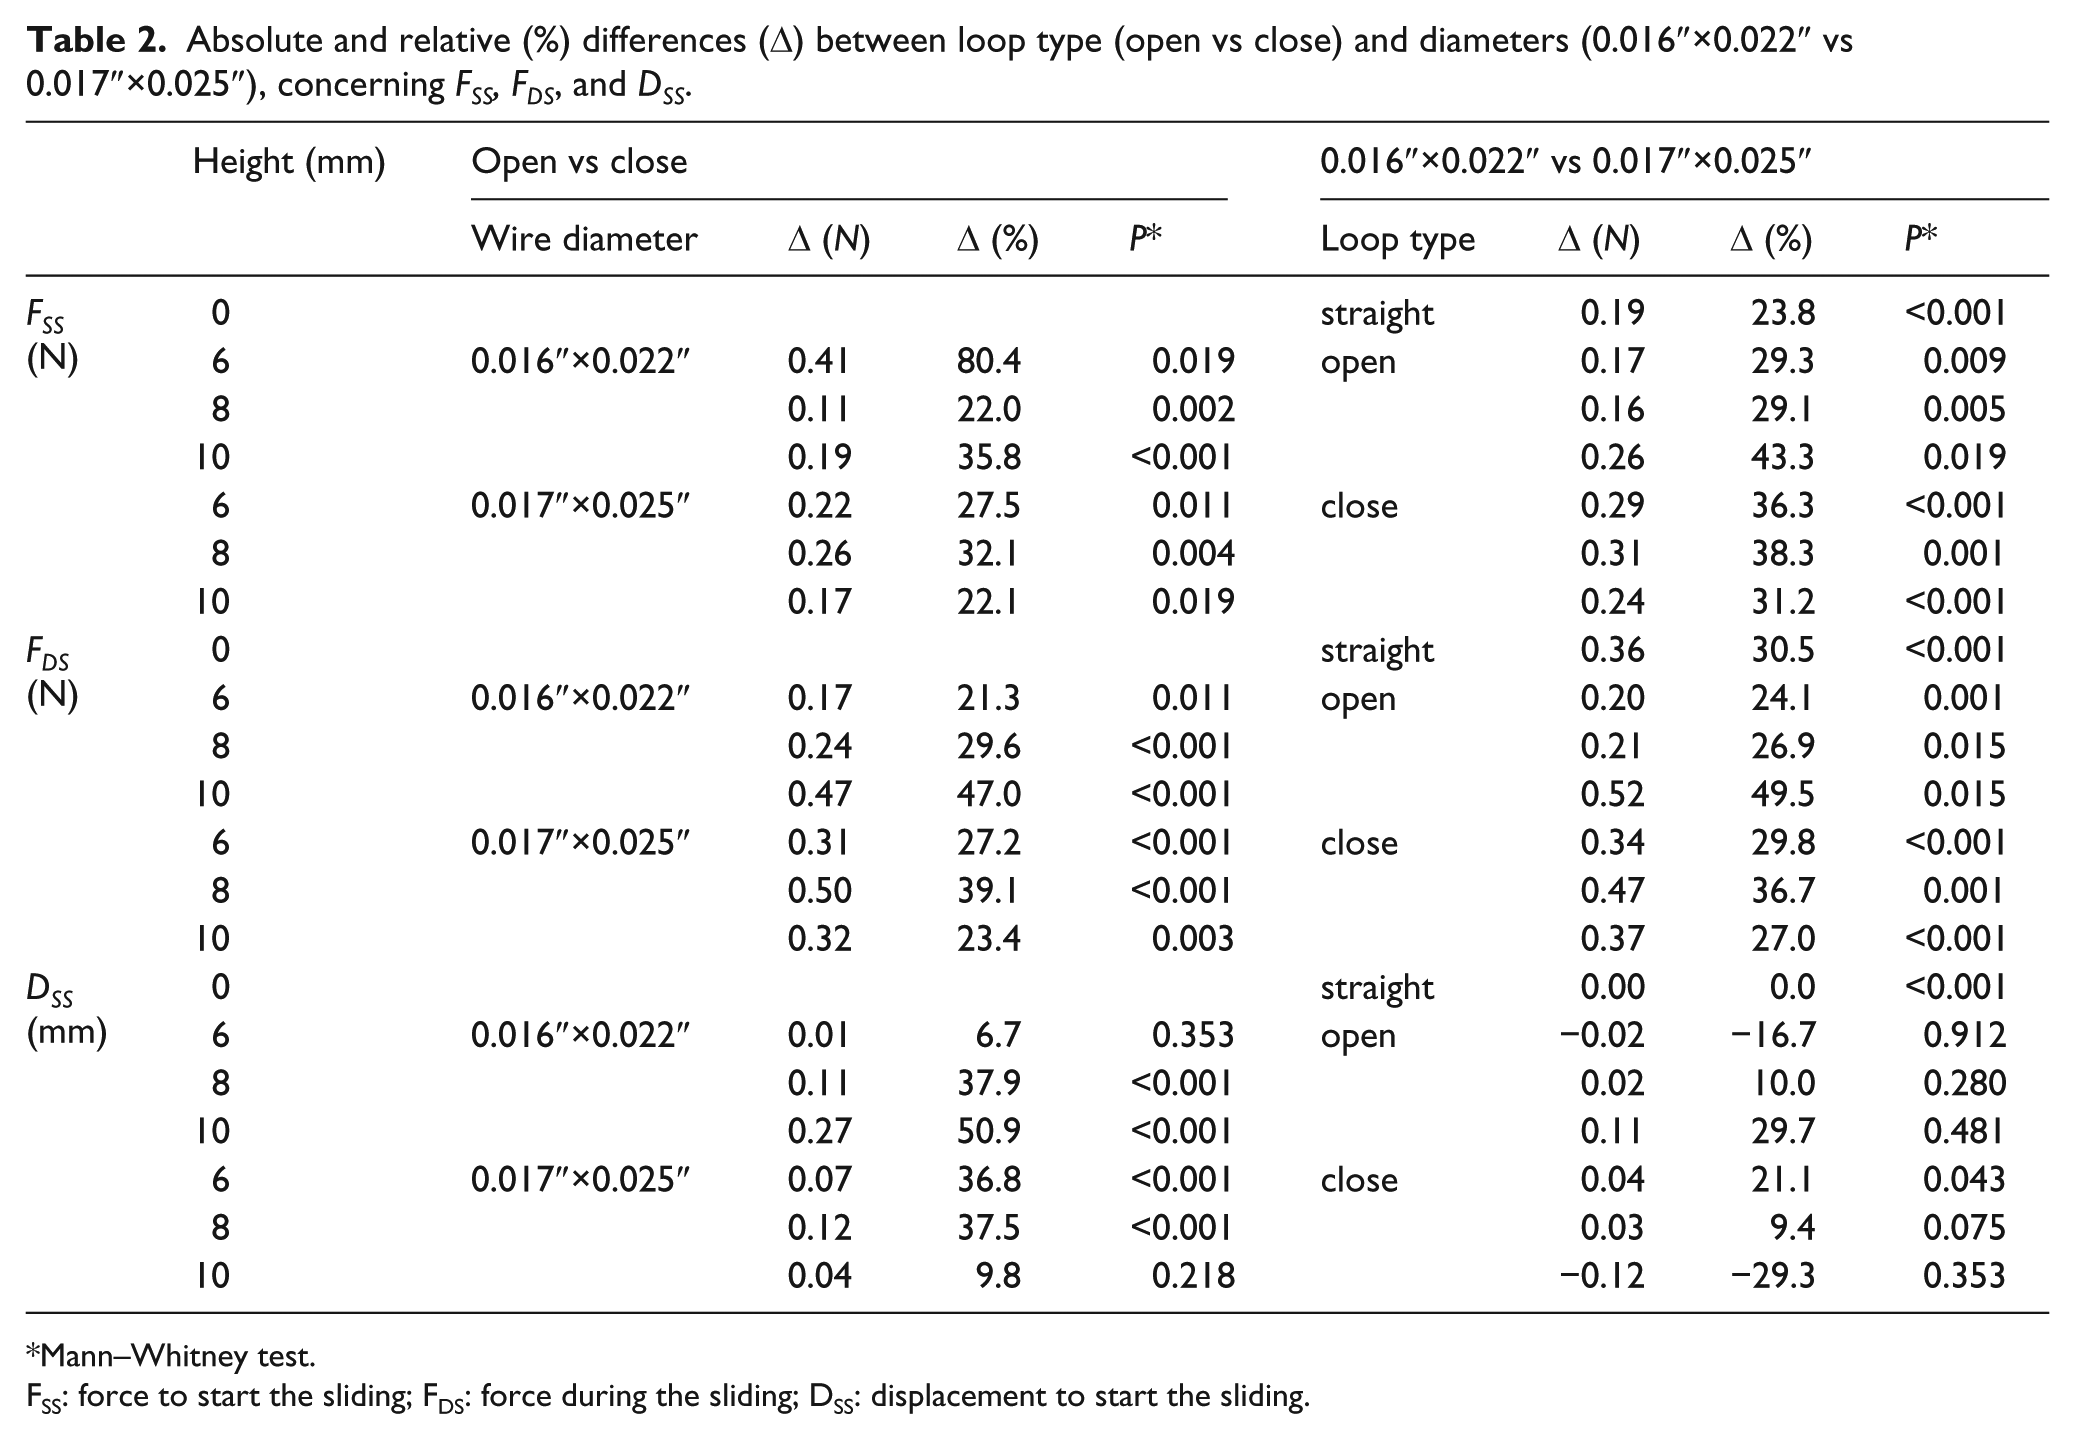
Mann–Whitney test.
FSS: force to start the sliding; FDS: force during the sliding; DSS: displacement to start the sliding.
Comparison between wire sizes
Significant differences were found between the 0.016″×0.022″ and 0.017″×0.025″ sizes regarding both FSS and FDS (p=0.019 to p<0.001). Absolute differences ranged from 0.16 N to 0.52 N, and relative differences between 24.1% and 49.5%, with 0.017″×0.025″ size always related to greater force.
Concerning the DSS, no significant differences were found between different sizes, apart in case of the 6 mm close loop (p=0.043) (Table 2).
Discussion
Most of the literature about the RS in orthodontics has been focused on the influence of materials and surface characteristics.3, 4, 20–23 After the suggestion to divide the RS in classic friction, binding, and notching,5, 24 more attention has been paid to the three-dimensional interaction between bracket and wire. However, the interest still focused on the bracket characteristics rather than the wire. In fact, even though the wire elasticity plays a fundamental role in RS, very few articles have investigated this phenomenon.9, 10 Furthermore, one of the most used and well-established methods to control the elasticity of orthodontic wires, that is, forming loops on the wire, has not been taken into consideration in the context of the RS.
In the present study, force values related to the presence of loops varied in respect to straight wires. The current results explain that loops can influence the FSS and are mainly able to reduce it, up to -44% in the case of a 0.016″×0.022″ wire with an open loop of 10 mm, compared to a straight wire (p<0.001) (Table 1). It is worth noting that the sliding of the bracket on the wire, or vice versa, is not characterized by a continuous movement, but is rather made of continuous starts and interruptions of the sliding, known as stick-slip, 25 and the FSS can be particularly relevant in this context. In particular, because the static friction is usually greater than the dynamic one, 11 the FSS may account for most of the RS encountered during orthodontic clinical movement.
Regarding the FDS, wires with loops had more variable behavior, such that loops were capable of decreasing the FDS compared to straight wires, up to -35% in the case of a 0.016″×0.022″ wire with an open loop of 10 mm (p=0.001), or to increase it up to +22% in the case of a 0.016″×0.022″ wire with a close loop of 10 mm (p=0.005) (Table 1). A possible explanation is that during sliding the loop opens until a point that achieves an angular divergence between the two ends of the wire that leads to the critical contact angle, thus causing an increase in the RS. 5 Macroscopically, such a situation has already been noticed when the activation of a closing loop determines the angulation of the mesial and distal part of the wire.26–29 Furthermore, the above-mentioned stick-slip behaviour 25 may also be triggered by this change in angulation. In fact, FDS values showed fluctuations after reaching the plateau (Figure 3). Overall, results regarding FSS and FDS support the use of open loops to reduce the RS, because the ability of closed loops to increase it is less evident and of limited clinical relevance.
Accordingly, 0.017″×0.025″ wires showed smaller RS differences with straight wires compared to 0.016″×0.022″ wires. This was evident with closed loops, which did not show statistical significance in the FSS (p=0.873) and FDS (p=0.372). A possible explanation is related to the greater moment-to-force ratio exhibited by smaller wires compared to larger sizes, as already reported during loop activation. 30 Thus, if clinicians aim at using loops to control the RS, 0.016″×0.022″ wires appeared to be more indicated compared to wires of a larger size.
Concerning the DSS, a fair comparison with a straight wire was not possible because no displacement is present in absence of a loop, unless the ultimate stress of the wire is reached. In fact, the DSS results related to straight wires were very close to zero (0.02 mm and 0.03 mm) with significant differences in the displacement values compared to wires with loops (p<0.001) (Table 1). In addition, the height of the loop could greatly influence the DSS, introducing a displacement dependency of the beginning of the sliding, a phenomenon that is not possible with straight wires. Interestingly, this delay in the onset of the sliding was noticed in all samples, and it was significantly different between each loop height of both close and open loops (p<0.001) (Table 1). In this regard, loop type also played a significant role, and closed loops were associated with higher displacement values compared to open ones (Table 2). This behavior suggests the use of open loops when the delay in the beginning of the sliding has to be minimized.
Finally, the results indicate that some loop height and type combination might enable the clinician to use wires of greater sizes without increasing the RS. This is particularly relevant when both an increased control of tooth position and a reduced RS are required, such as during retraction of the anterior teeth with sliding mechanics utilizing skeletal anchorage. 17 For example, this behavior was noticed when a 0.016″×0.022″ straight wire was compared to a 0.017″×0.025″ wire with a 6 mm loop, showing the straight wire of smaller size to have higher FSS (0.61 N) than the larger wire with a loop (0.58 N) (Table 1).
By comparing loops of the same height, significant differences were found between open and closed loops regarding FSS and FDS, for both 0.016″×0.022″ and 0.017″×0.025″ wires, confirming the relevance of open loops to reduce the RS. Greater RS with closed loops may be explained by the helix, which has been associated to reduced load-deflection ratio, 19 and greater wire deflections leading to earlier binding. 5
Not surprisingly, RS values were different between 0.016″×0.022″ and 0.017″×0.025″ wires, with larger wires increasing the FSS up to 43.3% and the FDS up to 49.5% compared to smaller ones. However, no significant differences were found in the DSS when comparing wire thickness (Table 2).
Limitations
Compared to the common discrimination between static and kinetic friction adopted in classical RS, further considerations were necessary in the presence of a sliding loop. For example, even though the three main parameters, that is, FSS, FDS, and DSS, were analyzed separately, the transition from the opening of the loop and the beginning of the sliding could not be defined at a single point, because of an overlapping region of opening and sliding. This said, once the force reaches its plateau, the amount of opening of the loop is stabilized as well, and the displacement is completely imputable to the sliding.
The loop design (Figure 1) was kept as simple as possible to allow good reproducibility of the shape while changing the selected variable, that is, the height from 6 mm to 10 mm. Furthermore, although a 10 mm loop may not be clinically applicable, the inclusion of such high values is aimed at better understanding the proportionality between the RS and the loop height.
The choice to test the same wire 10 times was made because orthodontic archwires are usually removed from the brackets at each appointment, and often re-inserted and re-ligated without substitution of the wire. Because the ligating method is the usually main parameter involved in the RS, re-ligating the same wire aimed at simulating the variability of the procedures, which is probably more relevant than the variability in the wires. However, the friction between the two materials may have generated microscopic surface roughness in the two accessories, which may have eventually affected the RS values. 4 In addition, using the same wire may have increased the chance of type I error and false positive results.
Conclusions
The loops should be considered as significant variables in the RS, because significant differences were found in the FSS and in the FDS between wires of different sizes, as well as between wires with different loop types. However, the height of the loop influenced mainly the DSS.
The present findings suggest that in some phases in which the inter-bracket distance is large enough to allow sliding of a loop, an open loop may be utilized to reduce the RS. This is of interest when the clinician aims at reducing the RS while maintaining control of the tooth movement by using the same wire size.
The decrease of RS was proportional to the open loop height, and it was particularly evident with 0.016″×0.022″ wires. Further studies are necessary to confirm these preliminary findings.
Footnotes
Acknowledgements
This research is part of the Thesis of Dr Fabio Savoldi for the Degree of Doctor in Dental Sciences at the Dental School of the University of Brescia (Brescia, Italy). Dr Fabio Savoldi worked on part of this project at the Dental Material Science Unit of the Faculty of Dentistry of The University of Hong Kong (Hong Kong) from December 2012 to March 2013. Dr Savoldi was a visiting student with scholarship of the University of Brescia. The authors would like to thank Professor JP Matinlinna, Dr JKH Tsoi, and Dr ATH Tang for their professional support, and Mr P Lee for his technical assistance during the experiments.
Declaration of Conflicting Interests
The author(s) declared no potential conflicts of interest with respect to the research, authorship, and/or publication of this article.
Funding
The author(s) received no financial support for the research, authorship, and/or publication of this article.