
Abstract
Background:
Hypertension is a significant global health issue, including in Ethiopia, where it remains poorly controlled despite effective treatments, leading to complications and death. This study aimed to estimate time to death and identify predictors among adult hypertensive patients in Dire Dawa, Ethiopia.
Method:
A retrospective cohort study was conducted among 530 randomly selected adult hypertensive patients from June 28, 2020 to June 28, 2023. Data were collected by Kobo Toolbox and cleaned in Excel, while analysis was done by Stata version 17. The Kaplan-Meier survival curve was computed to estimate the time to death. A log-rank test was used to compare the differences in survival distributions among groups of independent variables. Cox proportional hazards regression models were fitted to identify the predictors of time to death. A p-value of <0.05 was considered significant.
Results:
The median survival time was 24 months, with a mortality rate of 7.9 per 1000 person-months. Significant independent predictors of mortality included higher education (AHR: 0.17), use of amlodipine (AHR: 0.19), combining amlodipine and hydrochlorothiazide (AHR: 0.17), smoking (AHR: 6.64), alcohol consumption (AHR: 2.66), obesity (AHR: 5.55), being overweight (AHR: 5.66), and having comorbidities (AHR: 3.84).
Conclusion:
Factors such as education, medication adherence, lifestyle choices, and comorbidities significantly influence mortality among hypertensive patients. Comprehensive management strategies addressing these risk factors are crucial for improving survival in similar healthcare settings.
Introduction
Hypertension is defined as persistent systolic blood pressure (SBP) of 140 mm Hg or higher and/or diastolic blood pressure (DBP) of 90 mm Hg or higher in adults, based on an average of two or more measurements taken during two or more office visits.1,2 An increase in diastolic and systolic blood pressure by 10 mm Hg doubles the risk of cardiovascular death, while a decrease by 2 mm Hg can significantly reduce the risk of death from heart disease and stroke.3,4 Most hypertensive patients (90%–95%) have primary or essential hypertension, influenced by genetic and environmental factors such as age, family history, obesity, high sodium intake, lack of physical activity, and excessive alcohol consumption. 5 Secondary hypertension, caused by other medical conditions, includes kidney disease, adrenal disease, thyroid problems, and obstructive sleep apnea. 6 Despite the advantages of maintaining strict blood pressure control, the rates of controlling blood pressure levels below 140/90 mm Hg are low. 7
Hypertension is a leading cause of premature death globally, affecting around 1.28 billion adults, mostly in low- and middle-income countries (LMICs). Only 42% of those with hypertension are aware of their condition and receiving treatment, and just one in five adults with hypertension have their blood pressure under control. 8 Research in Ethiopia highlights the significant impact of hypertension on mortality rates. Studies in Addis Ababa show high mortality rates due to hypertension complications. 9 A study conducted in Bahirdar revealed the impact of blood pressure dynamics on patient outcomes. 10 A meta-analysis found that the prevalence of hypertension in Ethiopia is 19.6%, with higher rates in urban areas, and rates of hypertension in men and women were 20.6% and 19.2% respectively. Additionally, hospital-based investigations revealed that hypertension accounted for 70% of strokes in Ethiopia. 11
Hypertension is a significant chronic disease in developing countries, and its timely management is crucial to prevent dangerous complications.12,13 Therefore, effective blood pressure control is crucial, as uncontrolled hypertension can lead to severe consequences such as stroke and heart disease.14,15 Consistent blood pressure control is a strong determinant of all-cause mortality among US veterans, with mortality rates significantly varying based on BP control. 16
Several predictors affected the time to death for hypertension patients, such as older age, 17 being the female, 18 comorbidities1,2 Uncontrolled blood pressure, 19 and non-adherence to medication. 3 Younger individuals have higher rates of uncontrolled hypertension, and more frequent follow-up visits result in better control rates. 20 Hypertension is also linked to lifestyle, diet, physical inactivity, urbanization, and socioeconomic status, with projections of 125 million hypertensive persons by 2025 in Sub-Saharan Africa.21,22
Due to these various factors, the survival time for hypertension patients varies significantly between nations. According to studies, patients with hypertension typically have higher survival rates in high-income nations with developed healthcare systems because of early diagnosis, efficient treatment options, and thorough disease management. 23 Low- and middle-income nations, on the other hand, frequently deal with issues including poor treatment adherence, limited access to healthcare, and greater levels of risk factors like smoking and obesity, which result in worse outcomes. 24 Moreover, lifestyle factors and public health policies also play a crucial role in shaping survival outcomes across different regions. 25
The time to death from hypertension varies across different settings, highlighting the need to study this timeframe and its predictors to improve our understanding of the disease. Such research can help identify early indicators for timely diagnosis and intervention. In Ethiopia, there is limited research that has examined time-to-event data for hypertension. Therefore, this study aimed to investigate the time to death and its predictors among adult hypertensive patients attending public health facilities in Dire Dawa, Ethiopia.
Methods and materials
Study design and setting
The retrospective cohort study was conducted among 530 adult hypertensive patients on follow-up in Dire Dawa from June 28, 2020, to June 28, 2023. Dire Dawa is one of Ethiopia’s two federal city administrations, located 515 km east of Addis Ababa. The city is served by two public hospitals, a military hospital, 15 health centers, and 34 health posts. The Resolve to Save Lives (RSTL) initiative aimed at hypertension prevention and control and included 74 health facilities and 200 health posts across Ethiopia, five of which are located in Dire Dawa. 26 The study took place in those five public health facilities under the RTSL project, namely Sabian General Hospital, Dechatu Health Center, Goro Health Center, Genda Gerada Health Center, and Malka Jebdu Health Center. Data collection took place from April to June 30, 2024.
Population and sampling
The source population was all adult hypertensive patients enrolled in the treatment/medical follow-up program at selected public health facilities in Dire Dawa. The study population was adult patients aged 18 years and above, who were free from events (death) during the first diagnosis, and were enrolled in the study at selected health facilities between June 28, 2020 and June 27, 2023. The study included adult patients aged 18 years and above with a confirmed diagnosis of hypertension who were on follow-up at public health facilities and had attended at least two follow-up visits. Prior history of hypertension, such as a previous diagnosis or prescription for blood pressure-lowering medication, a history of cardiovascular diseases that served as study endpoints, incomplete medical records, or a diagnosis of pregnancy-induced hypertension, were excluded.
A survival analysis approach was employed to estimate the sample size necessary for evaluating the time to death among adult hypertensive patients. Based on parameters such as expected event rate, hazard ratio, power, and significance level, the required sample size was calculated using the Cox proportional hazards model. 27 With support from online calculators and using assumptions of a two-tailed type I error (α) of 0.05, a type II error (β) of 0.20, from a previous study conducted in Ethiopia. 28 A baseline event rate (BER₀) of 0.35 (events/unit time) for Group 0, a median survival time (ST₀) of 1.98 months in Group 0, a censoring rate (CR) of 0.3 (censored/unit time, assumed equal for both groups), and a planned average length of follow-up (FU) of 5 years. These parameters yielded a total required event count of 279. Ultimately, with continuity correction included, the final sample size is calculated to be 530 participants.
All five public health facilities that were under follow-up by the RTSL project were purposively selected and utilized a simple mobile-based app in Dire Dawa. The selected health facilities include Sabian General Hospital, Dechatu Health Center, Genda Gerada Health Center, Goro Health Center, and Malka Jebdu Health Center. The sample size was proportionally allocated across these facilities based on patient counts of three-year data, followed by simple random sampling of eligible patients.
Operational definitions
Cohort: The retrospective cohort began on the day of diagnosis and finished on the date of the first controlled BP measurement or the study’s closing date, which was June 28, 2023.
Event (death): The event was defined as death from any cause during the follow-up period.29,30
Time to death: The time between the initiation of treatment and the occurrence of the event (death) during the follow-up period.
Censored: The time between the initiation of treatment and the occurrence of the event (death) during the follow-up period. 31
Loss to follow-up: When the patient misses an appointment from the previous month
Hypertension: A recorded sustained high blood pressure (SBP ≥140 or DBP ≥90 mm Hg). 32
Uncontrolled hypertension was defined as SBP ≥140 mm Hg and/or DBP ≥90 mm Hg for the general hypertensive population or SBP ≥130 mm Hg and/or DBP ≥80 mm Hg in patients with established diabetes mellitus (DM) or chronic kidney disease (CKD). For patients aged ≥60 years, it was defined as SBP ≥150 mm Hg and/or DBP ≥90 mm Hg.33,34
Controlled blood pressure: Was defined as SBP <140 mm Hg and/or DBP <90 mm Hg for the general hypertensive population or SBP <130 mm Hg and/or DBP <80 mm Hg in patients with established diabetes mellitus (DM) or chronic kidney disease (CKD). For patients aged ≥60 years, it was defined as SBP <150 mm Hg and/or DBP <90 mm Hg.33,34
Medication adherence: According to the WHO, patients show good adherence when they follow the recommendations of health professionals, such as personal behavior changes, taking medication, following a diet, and changing lifestyle. In addition, adherence was rated as good or poor based on the percentage of the drug dose calculated from the total monthly hypertensive drug dose. Therefore, good was reported if equal to or greater than 80% of their medication in a previous month; that is, medication adherence, or poor if the patient takes less than 80% of prescribed medicine doses per month.35,36
Data collection and quality control
Data were collected using a data extraction checklist, which was developed after reviewing relevant literature and previous similar studies.2,37–39 Then compiled by the study’s objectives. The checklist was written in English and included five parts: assessment of socio-demographic variables, behavioral and lifestyle-related factors, treatment plan and adherence, baseline anthropometric and laboratory findings, and assessment of disease comorbidity and all-cause mortality. The checklist was then entered into the Kobo Toolbox to facilitate data collection 40 and then collected from patient records (charts) and the database of a simple mobile app. The health management information system (HMIS) card number was used to identify an individual’s patient card. A team of five BSc public health experts collected the data under the supervision of two MPH experts who provided oversight, support, and monitoring.
To ensure data accuracy and consistency, structured data extraction tools were pretested involving 5% of the sample size, which was conducted outside the study area to evaluate the tools, with feedback incorporated to improve quality. Data collectors and supervisors received 2 days of training on the study’s objectives, procedures, and ethical considerations. Regular monitoring by the supervisor and principal investigator ensured data completeness and consistency throughout the collection period, followed by a thorough cleaning process to address missing values, outliers, and inconsistencies.
Data analysis
Data entered into the mobile-based Kobo Tool data collection 40 and then downloaded and cleaned using Microsoft Excel Office 2021 41 followed by analysis with Stata version 17. 42 For continuous data, summary statistics such as mean with standard deviation and median with interquartile range were used to describe patient follow-up characteristics. Frequency and percentage were used for categorical data. The incidence of death was calculated for the entire study period per 1000 person-months. A survival table was employed to estimate survival probabilities after diagnosis of hypertension at different time intervals. Kaplan-Meier survival curves were generated to illustrate time to death, and log-rank tests were conducted to compare survival curves between groups. The variance inflation factor (VIF) and tolerance were computed to check the existence of multicollinearity before running the multivariable Cox proportional hazard regression model. The Schoenfeld and Cox-Snell residual tests were used to assess the Cox proportional hazards model’s assumptions statistically and graphically. A bivariate Cox proportional hazards regression model was fitted to examine the relationship between the outcome variable and each independent variable, with a p-value threshold of less than 0.25 for inclusion in the multivariable analysis. In multivariable analysis, adjusted hazard ratios with 95% confidence intervals were reported, and a p-value of 0.05 was considered statistically significant.
Results
A total of 530 charts of adult hypertensive patients were reviewed, of which 511 (96.4%) records met the enrollment criteria in the final analysis. The remaining 19 charts were incomplete because the date of hospitalization or the outcome (death or censored) was not recorded. Out of the 511 hypertensive charts followed for 36 months, 482 were censored, and 29 died.
Sociodemographic and behavioral risk factors
Of the 530 records reviewed, 19 were excluded, leaving 511 for analysis (Figure 1). The mean age at diagnosis was 55 ± 10.8 years, with 36.2% aged ≥60 and 31.1% aged 45–54. Females made up 55.5% of participants. The majority (97.9%) resided in urban areas. Regarding religion, 46.2% were Orthodox, 36.8% Muslim, and 17.0% Protestant. Educational levels showed 19.8% completed primary school, 18.8% were illiterate, and 15.3% had higher education. About 88.1% were married, and 31.9% had a family history of hypertension. Non-smokers constituted 86.3%, and 75.5% abstained from alcohol. However, 53.0% used khat, 86.4% had unhealthy diets, and 83.2% were physically inactive (Table 1).
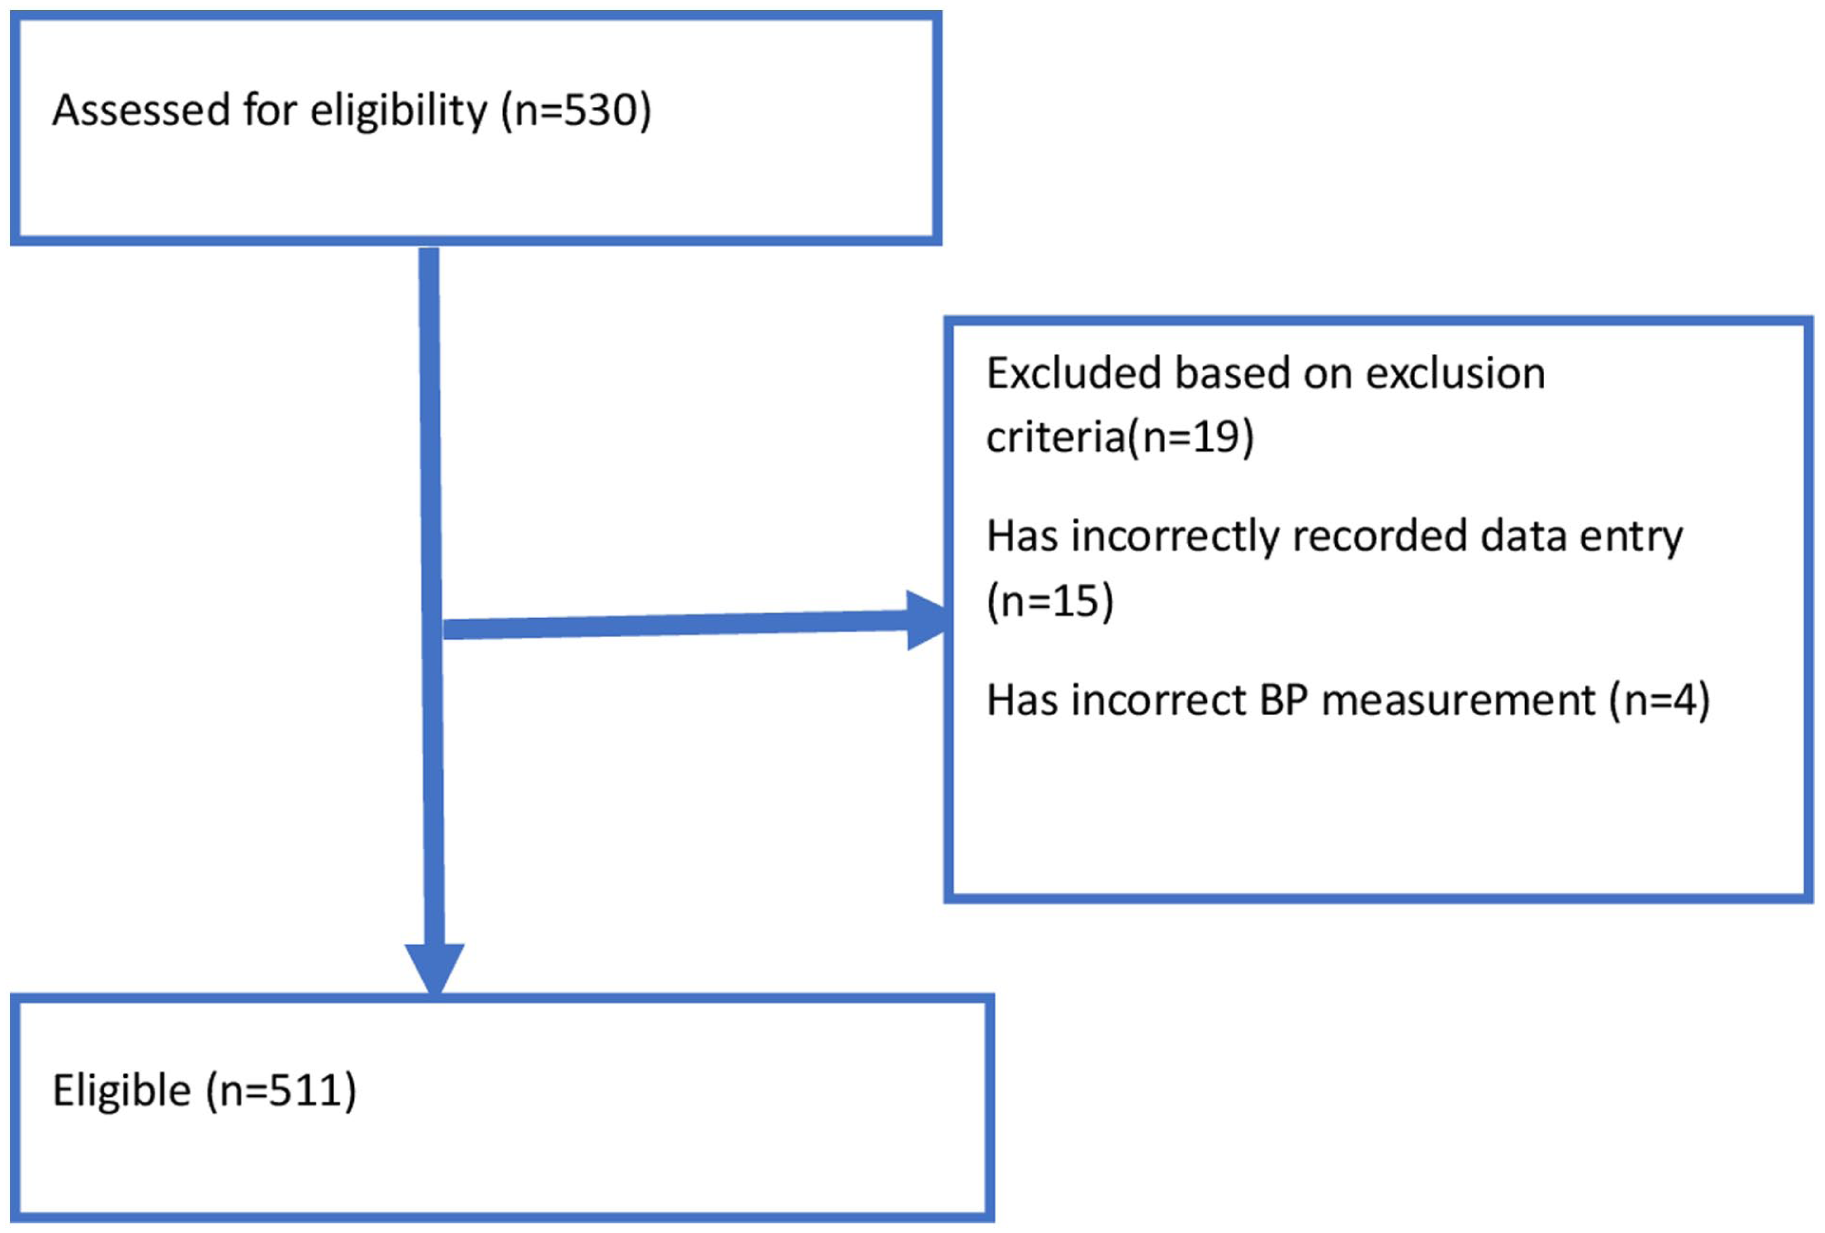
Hypertension patient selection flowchart of adult hypertensive patients on follow-up at Dire Dawa public health facilities, 2020–2023.
Sociodemographic and baseline lifestyle risk factors of hypertensive adults in Dire Dawa, Eastern Ethiopia (2020–2023).

Baseline anthropometric and laboratory assessment
The study’s findings revealed that the average systolic and diastolic blood pressures were 163.15 and 90.47 mm Hg, respectively. Hypertension was categorized into Stage 1 (42.66%), Stage 2 (35.42%), Stage 3 (19.77%), and Hypertension Urgency (2.15%) (Table 3). The mean body mass index (BMI) was 25.9 kg/m², with 43.64% of patients having a normal BMI, 41.88% being overweight, and 14.09% classified as obese (Table 2).
Baseline anthropometric and laboratory assessment of adult hypertensives in Dire Dawa, Eastern Ethiopia, 2020–2023.

Treatment plan and medication adherence
Among the 511 patients, 24.9% managed their hypertension with only lifestyle interventions, primarily those in Stage 1. Monotherapy was the most common treatment, used by 62.8% of patients, especially in Stage 1 hypertension. Combination therapy was employed by 12.3% of patients, mainly in Stages 2 and 3. Amlodipine was the most frequently prescribed antihypertensive, given to 56.0% of patients. However, only 33.5% of patients demonstrated good medication adherence (Table 3).
Treatment plans and medication adherence among adult hypertensive patients attending public health facilities in Dire Dawa, Eastern Ethiopia, 2020–2023.

Comorbidity-related diseases and causes of mortality
In this study, various comorbid conditions and causes of mortality were identified. The most common comorbid condition was diabetes, affecting 177 (34.6%), followed by hyperlipidemia at 96 (18.8%) and stroke at 25 (4.9%). Regarding mortality causes, cardiovascular diseases (including stroke, myocardial infarction, and heart failure) were the leading cause, accounting for 3.3% of deaths. Other causes included dengue, HIV (human immunodeficiency virus), tuberculosis, cancer, COVID-19 (coronavirus disease 2019), and kidney disease, each contributing to less than 2% of deaths (Table 4).
Comorbid conditions and mortality causes in adult hypertensive patients on follow-up at public health facilities in Dire Dawa, Eastern Ethiopia, 2020–2023.

Survival of patients with hypertension and Kaplan‑Meier estimation of survival function
The total person-month follow-up was 3669 person-months, with an overall mortality of approximately 7.90 deaths per 1000 person-months (95% CI = 5.49–11.37). The overall survival probability of hypertensive patients in the follow-up at the end of 36 months was found to be 0.49 (95% CI = 0.31–0.65), while the survival probability of hypertensive patients at the end of 12 months was 0.91 (95% CI = 0.86–0.95) (Table 5).
Statistical test for the proportional hazard’s assumption of covariates with their time interaction and Schoenfeld residuals.
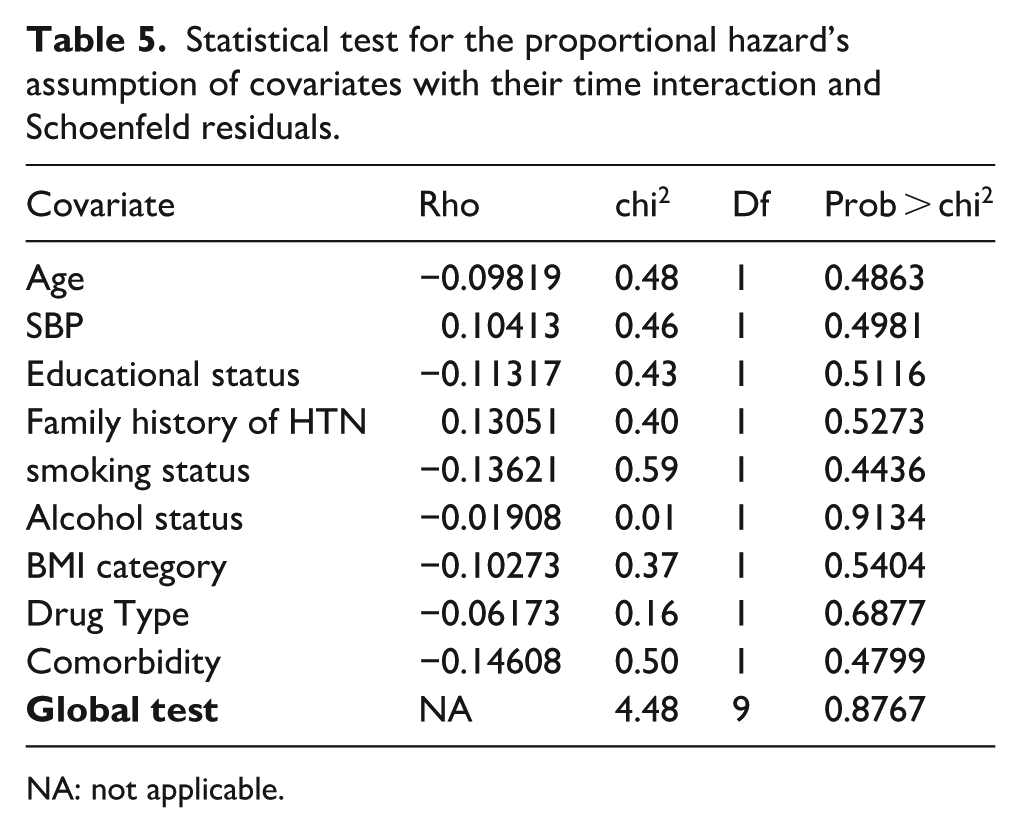
NA: not applicable.
Overall survival rate of patients with hypertension
The median time at which half of the patients experienced the event (death) was approximately 24 months, as indicated by the survival graph (a), Kaplan-Meier survival function. The initial period shows low cumulative hazard; as time progresses (especially noticeable around 10 months), the cumulative hazard begins to increase, suggesting a trend in increased risk of the event occurring. Understanding this plot is crucial for assessing the timing and risk of events in survival studies, providing insights into the expected duration until an event and the safety of a treatment or intervention over time (b) Kaplan-Meier failure function (Figure 2). The Kaplan–Meier curve with log-rank p-value shows differences in survival function between the categories of variables: The Kaplan-Meier survival analysis by sex (Graph a) shows no significant difference in survival probabilities between males and females (log-rank p = 0.9821), with both curves remaining close throughout the follow-up period. In contrast, survival by smoking status (Graph b) shows a significant difference between smokers and non-smokers (log-rank p < 0.0001), with non-smokers having higher survival probabilities, suggesting smoking as a risk factor for lower survival. The survival curves for alcohol consumption (Graph c) also reveal a significant difference (log-rank p < 0.0001), with non-drinkers showing higher survival probabilities, indicating alcohol’s association with reduced survival. Survival based on comorbidity status (Graph d) is significantly different (log-rank p = 0.0108), with those without comorbidities showing better survival outcomes. Analysis by treatment type (Graph e) reveals that patients on drug treatment have higher survival probabilities than those on lifestyle interventions (log-rank p = 0.0015), suggesting improved survival with drug treatment. Lastly, survival by cholesterol status (Graph f) shows no significant difference (log-rank p = 0.3493), indicating similar survival outcomes regardless of cholesterol levels (Figure 3).

Kaplan-Meier survival function graph (a) and Kaplan-Meier failure function graph (b) of adult hypertensive patients on follow-up at Dire Dawa public health facilities, 2020–2023.

Kaplan–Meier estimates for adult hypertension adult hypertensive patients on follow-up at Dire Dawa public health facilities, 2020–2023. Set by (a) sex, (b) smoking status, (c) alcohol drinking status, (d) comorbidity, (e) treatment type, and (f) cholesterol status.
Schoenfeld residuals
The Schoenfeld residual plot showed an approximate straight line for each covariate, indicating that the functional form of each variable is linear. To assess the proportional hazards assumption more thoroughly, a LOWESS (locally weighted scatterplot smoothing) curve was added to the plot. The LOWESS smooth line closely follows the residuals, further confirming that there are no significant departures from the assumption of linearity for each covariate. This suggests that the proportional hazards assumption holds for the variables in the model (Figure 4).

Scaled Schoenfeld residuals plot of covariate fitted with time and lowess for adult hypertensive patients on follow-up at Dire Dawa public health facilities, 2020–2023.
Cox–Snell residuals
The Cox–Snell residuals plot showed that the cumulative hazard estimate aligns along a 45° line through the origin, confirming that the proportional hazards (PH) assumption holds. This result indicates that the model reasonably fits the data (Figure 5). Together, these four residual plots confirm that the selected final model for the hypertension dataset provides a good fit.
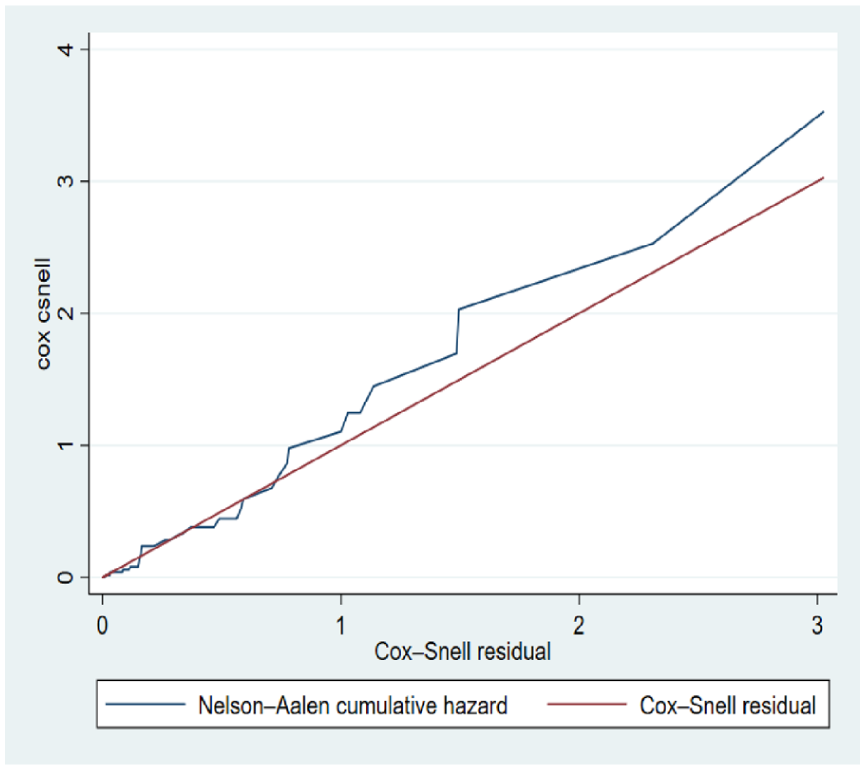
Cox–Snell residual plot of fitted model for adult hypertensive patients on follow-up at Dire Dawa public health facilities, 2020–2023.
Predictors of time to event among hypertensive patients
In this study, variables with a p-value of ≤0.25 in the bivariable Cox regression model were selected as candidates for the multivariable analysis. After identifying these candidates, a selection method was applied to fit the Cox proportional hazards model. The bivariable analysis identified several important factors, including age, educational level, and family history of hypertension, smoking status, alcohol use, drug type, BMI category, systolic blood pressure (SBP), and comorbidity. These variables were then incorporated into the multivariable analysis to assess their combined influence on the outcome more accurately. In the multivariable Cox analysis, higher education (adjusted hazard ratio (AHR): 0.17, 95% confidence interval (CI): 0.03–0.91), use of amlodipine (AHR: 0.19, 95% CI: 0.08–0.46), combining amlodipine and hydrochlorothiazide (AHR: 0.17, 95% CI: 0.05–0.58), being a smoker (AHR: 6.64, 95% CI: 2.79–15.82), alcohol consumption (AHR: 2.66, 95% CI: 1.18–6.01), being obese (AHR: 5.55, 95% CI: 1.75–18.34), being overweight (AHR: 5.66, 95% CI: 1.79–17.89), and having comorbidity (AHR: 3.84, 95% CI: 1.49–9.85) were key significant predictors of time to death among adult hypertensive patients (Table 6).
Bivariate and multivariable analysis of predictors of time to death among adult hypertensive patients on follow-up at public health facilities in Dire Dawa, Eastern Ethiopia, 2020–2023.

AHR: adjusted hazard ratio; BMI: body mass index; CHR: crude hazard ratio; CI: confidence interval; HCTZ: hydrochlorothiazide; SBP: systolic blood pressure.
Discussion
This study identified significant predictors of mortality among adult hypertensive patients on follow-up in Dire Dawa, Ethiopia. Cox regression analysis revealed that educational level, smoking status, BMI category, medication use, alcohol consumption, and comorbidities were critical factors influencing the hazard of death.
In this study, the overall incidence of mortality was 7.9 per 1000 person-months. This study aligns with findings from Uganda, where heart failure patients had an all-cause mortality incidence of 3.58 per 1000 person-days. 43 However, it is lower than a study conducted in Ethiopia, which reported a rate of 16.35 per 1000 person-months. 44 In Tanzania, the incidence was even higher at 33 cases per 1000 person-years. 45 Additionally, hypertension was associated with a 64% higher mortality rate at a 2-year follow-up in patients from Guinea-Bissau. 46 These variations could be due to differences in healthcare systems, patient demographics, and their associated comorbid conditions.47,48
This study also revealed that individuals with a college or university education had a significantly lower hazard of mortality compared to those with no formal education. A similar study in Ethiopia found that individuals with a college education had significantly lower mortality risk compared to those without formal education. 49 Similarly, a study conducted in China reported that individuals with higher education attainment have lower risks of developing hypertension and better blood pressure control compared to those with elementary education or below. 50 Reduced educational attainment is associated with heightened mortality risks. For instance, individuals with less than a high school education have a 20% higher risk of all-cause mortality compared to those with a college degree. 51 Educational disparities significantly affect cardiovascular mortality, with a 40% increased risk observed in lower educational groups. 51
The study also found that both obese and overweight individuals had significantly higher hazards of mortality compared to those with a normal BMI. These results are consistent with the findings from the study in China that reported that higher BMI is linked to increased blood pressure and a higher risk of hypertension-related complications. 52 A study in Indonesia further supports this, showing that obesity significantly raises the risk of hypertension and related mortality. 53 The study conducted in the United States found that class III obesity was associated with a hazard ratio (HR) of 1.63 for cardiovascular mortality compared to normal BMI. 4 Among hypertensive patients, the risk of mortality escalates with higher BMI categories. The metabolically unhealthy obese (MUO) group showed significantly elevated risks for heart disease and hypertension-related mortality. 54 This result could be due to the presence of obesity could complicate the management of hypertension, as it often requires more intensive treatment strategies and lifestyle modifications, which may not always be effectively implemented. Additionally, social and psychological aspects of obesity, such as stigma and reduced quality of life, may also contribute to poorer health outcomes.
Additionally, the study revealed that there is an association between smoking and elevated mortality risk, with smokers having a hazard approximately 6.6 times higher than non-smokers. Studies from Indonesia and Malaysia report a 48% and 79% increased risk of death, respectively, while similar findings emerge from Berlin and China.4,55–57 In a large cohort of Chinese men, smoking over 20 pack years combined with hypertension resulted in a hazard ratio of 2.30 for cardiovascular mortality. 58 Additionally, a survival model in Ethiopia identified tobacco use as a significant predictor of reduced survival time among hypertensive patients. 59 Longitudinal studies demonstrate that the combination of smoking and hypertension markedly increases mortality risk, with one 34-year study showing a 3.6-fold increase for cardiovascular mortality. 60 Similarly, a 27-year cohort study revealed that smoking elevated risk to 5.2 times for cardiovascular mortality, and among hypertensive patients specifically, smoking increased mortality risk by 2.1 times compared to non-smoking hypertensive individuals. 61
This consistent relationship highlights the detrimental effects of tobacco use on cardiovascular health, necessitating robust public health strategies to reduce smoking prevalence among hypertensive individuals. Research indicates that smoking is associated with a 1.79 adjusted hazard ratio for all-cause mortality among Malaysian adults. 56 However, one Ethiopian study found that tobacco use was not significantly associated with survival time. 62 This discrepancy could be due to differences in sample size; the sample size is higher in this study than in the study conducted in Yekatit-12 Hospital in Ethiopia. Additionally, demographic factors like urbanization and cultural acceptance of smoking may differ, influencing smoking behaviors and intensity between the two study areas. 63
Similarly, alcohol consumption significantly increases the hazard by about 2.7 times compared to non-drinkers, reinforcing the adverse effects of alcohol on blood pressure management and overall health, as documented in studies from Ethiopia and the UK.12,64 These lifestyle factors should be prioritized in clinical practice, with healthcare providers emphasizing the importance of lifestyle modifications in conjunction with pharmacological interventions. Moreover, the use of Amlodipine by about 0.19 (HR: 0.19, 95% CI: 0.08–0.46), and the combination of amlodipine and HCTZ approximately lowers the hazard by about 0.17 (HR: 0.17, 95% CI: 0.05–0.58) (HR: 0.28 and HR: 0.09, respectively), suggesting their effectiveness in managing blood pressure and ameliorating adverse outcomes, as supported by investigations in Gondar and Jimma.65,66
Furthermore, in this study, the presence of comorbidities was shown to increase the mortality hazard approximately 3.8 times. This result aligns with findings from studies conducted in Ethiopia, Sweden, and the United States, which have similarly identified chronic conditions such as diabetes and heart failure as critical factors influencing mortality in hypertensive populations.4,17,37,57 This indicates that it is a strong predictor of mortality, indicating that managing multiple health conditions is crucial for improving survival rates. 67
Limitations of the study
The study’s limitations include the retrospective design, which relies on existing medical records and can lead to missing or incomplete data and potential biases, affecting the study’s validity. The lack of comprehensive follow-up data beyond the 36 months may miss long-term outcomes, such as late morbidity and mortality events related to hypertension. Additionally, unmeasured confounding factors like socioeconomic status and cultural influences could affect blood pressure control and mortality risk. Also, it may not be generalizable to certain populations. Lastly, baseline lifestyle factors were collected at a single time point, which may not accurately reflect long-term behaviors or changes over time. Therefore, future studies should consider these limitations. Especially, future prospective studies with larger sample sizes, longer follow-up periods, and a broader range of variables are needed to enhance the statistical power and generalizability of the findings, to provide a more comprehensive understanding of the long-term outcomes and mortality trends among hypertensive patients, and to understand the multifactorial nature of mortality in this population.
Conclusion
The findings of this study indicated that patients with higher educational attainment, normal BMI, being non-smokers, non-alcohol consumption, and those using Amlodipine or combination therapy had better survival probabilities. In contrast, those with higher BMI, smokers, alcohol consumers, and patients with comorbidities had lower survival probabilities. In conclusion, our study emphasizes the multifaceted challenges of managing hypertension and highlights the critical need for tailored interventions. Interventions aiming to improve lifestyle factors, enhance medication adherence, and effectively manage comorbidities are paramount for reducing mortality risk and achieving better health outcomes among hypertensive patients in Ethiopia. A comprehensive approach that integrates public health initiatives, community support, and healthcare provider training is essential to bolster hypertension management and improve overall patient outcomes in the region.
Footnotes
Acknowledgements
We would like to extend our heartfelt gratitude to Haramaya University, College of Health and Medical Sciences, for providing us the opportunity to conduct this research. We deeply appreciate the cooperation and support of the Dire Dawa health office, the RTSL project team, the PHEM staff, and the health centers (Sabian, Goro, Dechatu, Melka Jebdu, and Genda Gerada) in facilitating data collection.
Ethical considerations
Ethical clearance was obtained from the Institutional Health Research Ethics Review Committee (IHRERC) of Haramaya University College of Health and Medical Sciences with grant number (Ref.No. IHRERC/253/2023). A formal letter of permission and support was provided to all five public hospitals where Haramaya University conducted the study. Informed, voluntary, written, and signed consent was obtained from the heads of the respective participant health facilities after explanations about the aims, objectives, benefits, and potential harms of the study. Patient confidentiality and data protection were ensured throughout the study.
Author contributions
AA conceived the idea, analyzed the data, and drafted the manuscript. AA, AM, DF, and AT contributed to data analysis, writing, and editing the manuscript. Finally, all the authors read and approved the final version and agreed on all aspects of this work.
Funding
The authors disclosed receipt of the following financial support for the research, authorship, and/or publication of this article: This study was supported by Haramaya University as part of a master’s thesis project.
Declaration of conflicting interests
The authors declared no potential conflicts of interest with respect to the research, authorship, and/or publication of this article.
Data availability statement
The raw data supporting the conclusions of this article will be made available by the authors without undue reservation.