
Abstract
Purpose:
The standard bibliometric indexes (“m-quotient “H-,” “H2-,” “g-,” “a-,” “m-,” and “r-” index) do not considered the research’ position in the author list of the paper. We proposed a new methodology, System of Authorship Best Assessment (SABA), to characterize the scientific output based on authors’ position.
Material and Methods:
Four classes S1A, S1B, S2A, and S2B include only papers where the researcher is in first, first/last, first/second/last, and first/second/second-last/last position respectively were used for the calculation of H-index and number of citations The system was tested with Noble prize winners controlled with researchers matched for H-index. The different in percentage between standard bibliometric index and S2B was calculated and compared.
Results:
The percentage differences in Noble prize winners between S2B-H-index versus Global H-index and number of citations is very lower comparing with control group (median 4.15% [adjusted 95% CI, 2.54–5.30] vs 9.00 [adjusted 95% CI, 7.16–11.84], p < 0.001; average difference 8.7% vs 20.3%). All different in percentage between standard bibliometric index and S2B except two (H2- and m-index) were significantly lower among Noble prize compared with control group.
Conclusion:
The SABA methodology better weight the research impact by showing that for excellent profiles the S2B is similar to global values whereas for other researchers there is a significant difference.
Introduction
The identification of correct metric system to objectively assess the impact and visibility in literature of a researcher represents a critical need in academic and non-academic perspectives. These are related to the academic and professional progression, to the transnationality, to the commercial effects, to the diffusion of the products and to the relapses that his research has induced in terms of knowledge as well as to the probability to obtain funds and research grants. 1
In the past years several methodologies have been suggested in order to quantify the value of the researcher in particular the total number of citations, the Hirsh-index.2,3 These systems have several strengths in their application, and these are accepted as good systems to quantify the impact and visibility in literature of a researcher. However, this strength (the impact of the research papers of a researcher) could be at the same time the weakness of these systems because it is not the production of the researcher (in terms of papers written or leaded) to be computed but the papers he/she authored or co-authored. 4
This fact is linked to a new phenomenon: the increase in the number of authors included in a research paper as showed in Nature by Greene. 5 Some authors speculated that this increase in the number of authors in a research paper could be explained by the new level of complexity the research where “fewer and fewer people know enough to work and write alone”5,6 whereas other authors hypothesize that the increased number of authors included for a paper is also linked to bibliometric needs and/or honorary authorship7,8 even if there are the International Committee of Medical Journal Editors (ICMJE) criteria that address what the rules that allow a researcher to be consider author or not. 9 More recently other indexes such as m-quotient, g index, H2 index, an index, m index and r index 10 were introduced to compensate some drawbacks of H-index and number of citations (the details of the indexes and their advantages over H-index are displayed in Table 1).
Various indexes in literature. 10

Moreover, another debatable point is that search and database engine of authors/papers such as Scopus or Google scholar, widely used for bibliometric analysis, include in their output quantification analysis not only the “authors” but also “contributors”: this means that it is possible to see papers with 30 authors and 200 contributors and the system of analysis compute in the same way the authors and the contributors (!) with consequent impact to citations and H-index. Interestingly for multi-authors papers some colleagues, such as Rennie et al., 11 suggested that in our era of multi-author articles, the concept of authorship should be replaced by that of contributorship that is quite different from the authorship. It is noteworthy, that those type of papers, with several contributors, are usually highly cited 12 with the paradoxical effect that for some authors most of the research citations is generated by papers where they are not authors but, simply, contributors.
Therefore, we hypothesize that the H-index does not measure the impact of an author correctly because it does not take into account the actual intellectual property. A potential solution could be generating new metric system, that should not substitute the other already used, but could be useful to derive further information necessary to have a better insight of the researcher impact and not the that of the papers where is co-author/contributor and in this scenario the position of the author in the list plays a fundamental role.
The first author is usually the researcher who has made the most significant intellectual contribution to the paper, in terms of designing, acquiring and analyzing data from experiments, and writing the manuscript. The importance of the first author is reflected in the common practice of referring to a paper by the first author’s name for example, “Jones et al. report that. . .” The last author is commonly the senior (lead-group author) who has supervised the research whereas second and second last positions usually represent are attributed to the second most important contributor and second senior contributor. For this reason, we introduce a new criterion that “weighs” the order in the list of authors, because we believe that this balances the effective intellectual property better, and to check its effectiveness we evaluate if, unlike the H-index, it can discriminate the Nobel winners from a group of authors matched for discipline and H-index to the Nobel winners themselves.
The purpose of this paper is to present a new methodology, System of Authorship Best Assessment (SABA), that weight the impact of the position name of the authors by checking this system on two homogeneous (on the basis of traditional H-index) cohorts of high-level researchers but different according to the accomplishment of result of excellence (Nobel Prize). Furthermore, the SABA methodology was applied to other bibliometric indexes.
Method
The SABA methodology was tested into two different ways. Firstly, the four classes listed below were compared among Nobel prize winner and control group for H-index and total number of citations. Secondly, the difference in percentage between global and S2B in the other bibliometric indexes (m-quotient, a-index, m-index, H2 index, g-index and r-index) were confronted between Nobel prize winner and control group.
The SABA methodology considers the position of the authors, and the following groups were considered:
S1A = included in the analysis only papers with author in first position
S1B = included in the analysis only papers with author in first/last position
S2A = included in the analysis only papers with author in first/second/last position
S2B = included in the analysis only papers with author in first/second/second-last/last position
SnA = included in the analysis only papers with author in first/second//n/second-last/last position
SnB = included in the analysis only papers with author in first/second//n/n-last/second-last/last position
The system could be applied to the all the metric systems used:
• Hirsch index (H-Index)
• Total number of citations (Nc, tot).
• Impact factor (IF)
• Total number of papers (Np)
Study’s population
In order to test the effect of this metric systems, the System of Authorship Best Assessment was applied to a group of high-level researchers in biomedical field by testing the effects to tow of the most used parameters: H-index and citations number. Two homogeneous (on the basis of traditional H-index) cohort of high-level researchers but different according to the accomplishment of result of excellence (Nobel Prize) were selected. It is assumed that the Nobel Prize is a criterion for the impact of scientific production, or if one has won the Nobel Prize is an irrefutable element of the impact of its production and quality.
In the first phase of the analysis, the winners of the Nobel Prize in Physiology or Medicine from 1997 to 2017 for a total of 50 researchers were therefore included and another group matched for similar H index, possible, age, gender, and topic of research, were matched with the Nobel Prize winners. The global number of researchers assessed was 100.
Four classes analysis
In the second phase a Scopus database analysis was performed and the CSV files with the output was exported for each researcher. Therefore, for each one, all papers were classified according to five categories:
S1A: papers with researcher in first position
S1B: papers with researcher in first/last position
S2A: papers with researcher in first/second/last position
S2B: papers with researcher in first/second/second-last/last position
Global: papers with researcher in other positions.
Accordingly, the H factor was calculated for S1A, S1B, S2A, S2B, and Global categories (global category included all the papers and therefore represents the current H-index factor as indicated by Hirsch 3 ). The absolute difference in H-index between the S2B and Global as well as the percentage differences was calculated. Moreover, the percentage difference was grouped in four classes (<5%, 5%–10%, 10%, 15%, and >15%).
Bibliometric indexes tests
For each bibliometric indexes including m-quotient, a-index, m-index, H2 index, g-index and r-index (Table 1) the percentage different between global and S2B calculation were calculated in Nobel prize winner and in control group. Subsequently, the differences were compared between the two groups
Outcomes
The primary outcome was to assess the effect of the research position in the author list of the paper on H-index and number of citations between Noble prize winner and control group depending on the four classes (S1A, S1B, S2A, S2B) and Global
The secondary outcome was to compare the percentages difference between Global and S2B class of all bibliometric indexes among Nobel prize winner and control group.
Statistical analysis
The normality of each continuous variable group was tested using Kolmogorov-Smirnov Z test and because the normality was rejected nonparametric tests were applied. Mann-Whitney test was used for comparing all bibliometric indexes between global and S2B class of all bibliometric indexes among Nobel prize winner and control group. A p value <0.05 was regarded to indicate statistical significance and all correlation values were calculated using a two-tailed significance level. R software (www.r-project.org) was employed for statistical analyses.
Results
The summary of H-index and citation analysis according to the System of Authorship Best Assessment for Nobel Winners and control group are given in the Tables 2 and 3 respectively.
Summary table for H factor analysis in Nobel prize winner groups and controls calculated for S1A, S1B, S2A, S2B, and Global categories including absolute difference in H-index between the S2B and Global and percentage difference. In the last column “difference class” the percentage difference between the S2B and Global H are grouped into four classes (<5%, 5%–10%, 10%, 15%, and >15%). The name of the Scientists of the control group are blinded for privacy but are at disposal previous authorization and upon specific request.

Summary table for citation analysis in Nobel prize winner groups and controls calculated for S1A, S1B, S2A, S2B, and Global categories including absolute difference in H index between the S2B and Global and percentage difference. In the last column “difference class” the percentage difference between the S2B and total number of citations are grouped into four classes (<5%, 5%–10%, 10%, 15%, and >15%). The name of the Scientists of the control group are blinded for privacy but are at disposal previous authorization and upon specific request.

From the data analysis it is extremely clear that at the class S2B, the H values of the Noble winners of the are extremely close to the global H index with a mean % difference of 6.54% and 62% of the cases with a variation <5%, in 20% of cases a variation between 5% and 10%, in 10% of cases with a variation between 10% and 15% and only in 8% of cases with a variation >15%; with only 8% of the analyzed researchers with differences >15% between H-index with S2B correction and Global H index. In the control group the percentage differences between H measured with S2B correction and Global H-index showed a statistically significant difference (Wilcoxon analysis showed a p value = 0.0008) with 20% of cases with difference with a difference >15% and an average difference of 10.7%.
The same approach was applied by analyzing the effects to the number of citations and the results are summarized in the Table 3. In this case the mean % difference between those obtained in S2B and the total number is 9.13% with 36% of the cases with a variation <5%, in 34% of cases a variation between 5% and 10%, in 20% of cases with a variation between 10% and 15% and only in 10% of cases with a variation >15%; therefore, only 10% of Nobel prize winners have differences >15% between the number of citations with S2B correction and the total number of citations. In the control group the percentage differences between global number of citations and values obtained with S2B show a statistically significant difference (Wilcoxon analysis showed a p value = 0.0001) where 56% of control group researchers have difference is >15%; average difference 20.3%).
In the Table 4 the percentages of differences are showed in order to have an easy view of the differences in H-index and Citations for Nobel and non-Nobel group whereas in the Figure 1 the boxplot is given.
The percentages of differences are showed in order to have an easy view of the differences in H-index and citations for Nobel and non-Nobel group.


Box-plot representing the percentage differences in Nobel prize winner groups and controls for H-index and citations.
In order to better understand the impact of the different categories to the H-index and total number of citations a bar-percentage graph was created (Figure 2) where the percentages of the contributions of H and total number of citations derived respectively from each class (S1A, S1B, S2A, S2B, Global) are computed for Nobel and non-Nobel group.
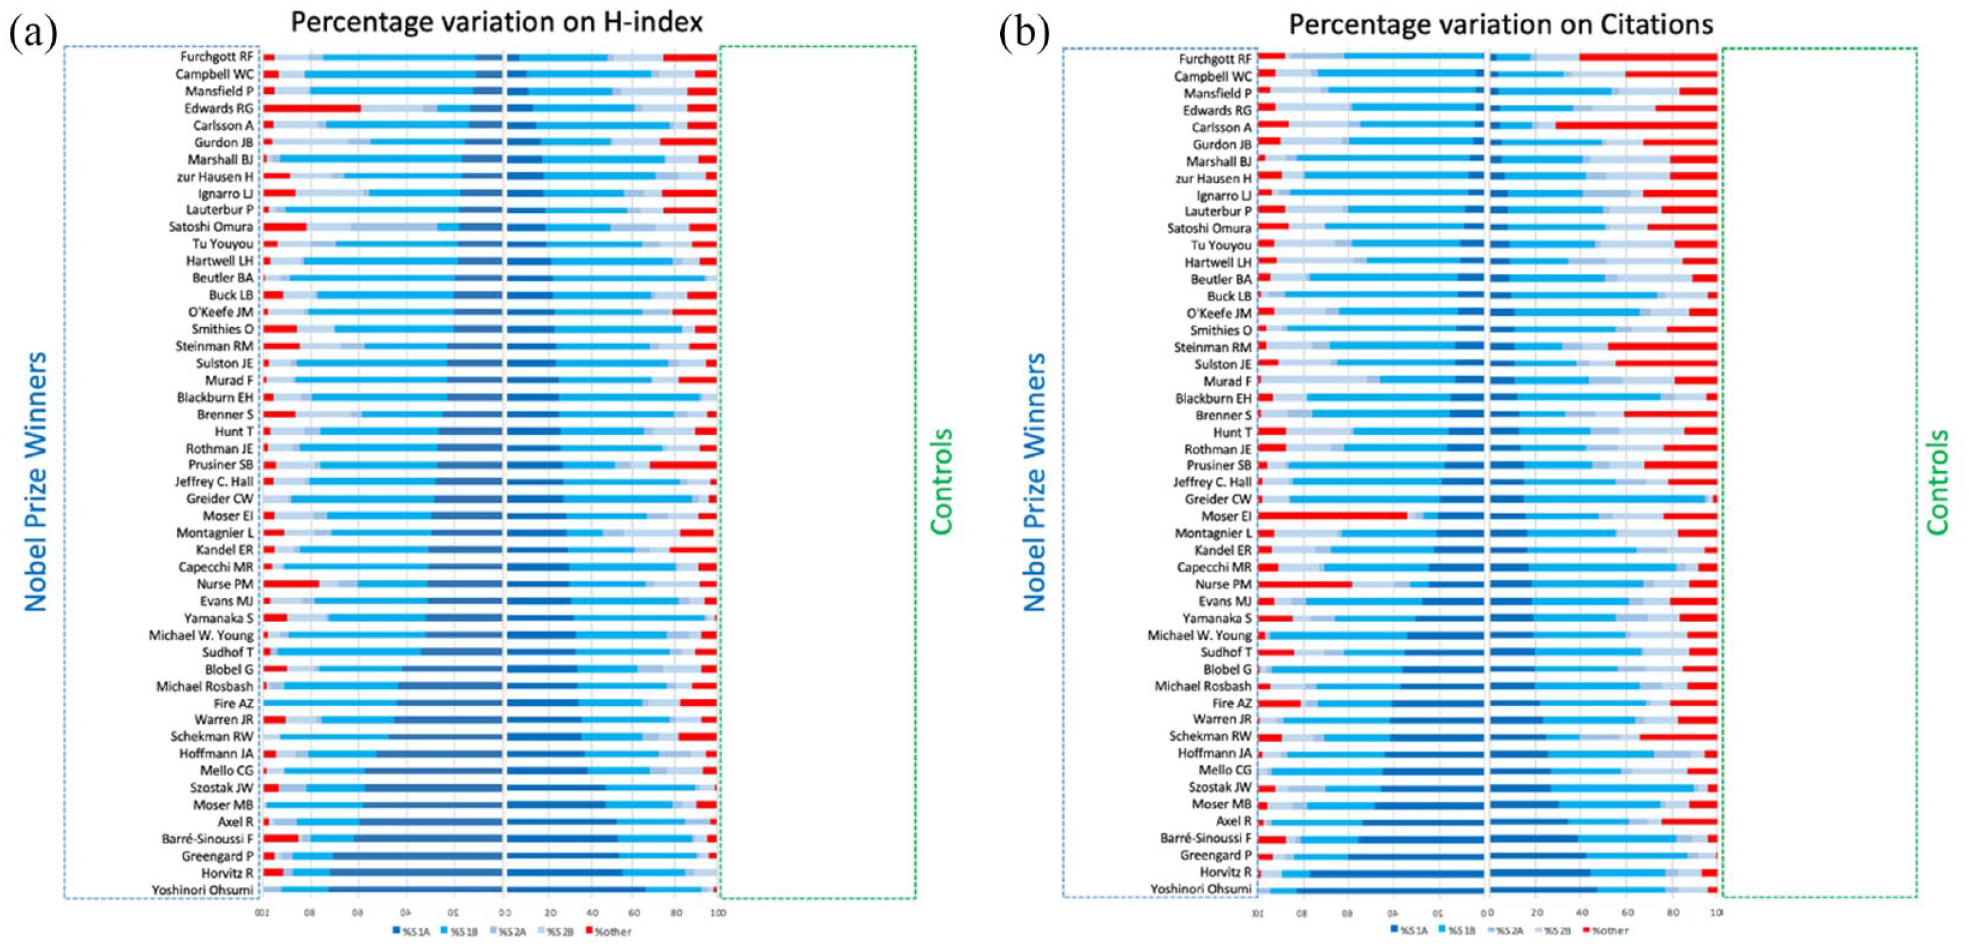
Percentage effect to H index (panel a) and citations (panel b) of the S1A-S1B-S2A-S2B and Global positions in author list in Noble prize winners and controls. The name of the Scientists of the control group are blinded for privacy but are at disposal previous authorization and upon specific request.
Concerning the other bibliometric indexes all but two (H2- and m-indexes) percentages differences resulted significantly lower in Nobel prize winner comparing with control group. In particular, the median differences for a-index was 3.5% (adjusted 95% CI, 1.6–5.5), for g-index was 3.1% (adjusted 95% CI, 0.8−5.0), for H index was 4.2% (adjusted 95% CI, 1.7%–6.7%), for H2 index was 0.0 (95% CI,−4.5−0.0), for m-quotient was 4.2% (adjusted 95% CI, 1.5–6.7), for m-index 0.5 (adjusted 95% CI, −1.5–2.8) and for r-index was 4.2% (adjusted 95% CI, 2.0–6.0). The complete results are displayed in Table 5.
Analysis of the variations among different metric systems.

Discussion
The purpose of this paper was to present a new methodology, the System of Authorship Best Assessment, that weight the impact of the position name of the authors as system to better characterize the scientific output of a researcher compared to other methods currently used. The need of such type of system relies on the fact that the increase in the number of authors included in a research paper 5 together with the automated method of calculation of scientific output performed by tools such as Google scholar or Scopus, makes complex to distinguish the real impact of a researchers. The Nobel prize winner have less reduction of all bibliometric indexes respect to the control group between Global and S2B class.
The first phase was to test the difference of our model compared to traditional system (H-index and citations) in excellent researchers. The first question was: how we can identify quite “objectively” an excellent researcher? We decided to define such type of researcher as objectively excellent if he/she was awarded with the Nobel Prize. And we found that in this group of 50 people the System of Authorship Best Assessment shows results similar to the conventional H-index and global citation values: it is clear the impact derived from the papers not included in first/second/second-last/last position for the Nobel Prizes winners usually do not play a significant role whereas the most of the results came out from the first/last position and become almost complete by including also the papers in second and second-last position.
In the second phase we wanted to test if the results we found were generalizable or if on other groups of researchers, the system showed difference and quite surprisingly we found that in another cohort of excellent researcher (from bibliometric point-of-view) the system showed a statistically significant difference compared to the Nobel Prize winner groups by lowering the H-index and citations of the controls.
By applying our model seems to be possible to obtain a screenshot of the impact of a researcher by deleting the influences of papers where the author has not preeminent or significant position. Some authors, such as Kovacs, 13 suggested to consider the “weight” of the contributions of each author in a paper and the model proposed in the current paper tries to easily optimize this concept with the target to differentiate the global output of a researcher from his/her original capacity/contributions. The use of position in the authors list is not a novel idea for weighting the contribution of a single authors on H-index14,15 or in g-index, 16 however, to out knowledge this is the first paper that use Nobel prize winner as standard of reference for excellent research.
The effect of S2B methodology is confirmed also by the other bibliometric indexes. In fact, in all but two indexes the percentages reduction between global and S2B was significantly lower in Nobel winner group comparing with control group. The H-index 3 is a well-established bibliometric parameter for researcher evaluation. However, it is not free from drawbacks, in particular it is sensible to field of research, it is sensitive to scientific age, it does not taken into account the context of the citation and auto citations. 3 For example, two of the most important physics of all time, Paul Dirac and Richard Feynman had only H-index, calculated by Scholar, of 62 and 58. Some other bibliometric indexes were proposed in literature. 10 The present analysis confirmed that Nobel prize winner have more consistent research compared with control group with a more preeminent role in their articles. Interestingly, H2 and m-index have an inverse trend compared to the other ones. However, it could be reasonable that Noble prize winners have more citations in less articles (the articles that support the Nobel prize) respect to the control group in which the citations and the articles have a less skewed distribution. In this set, H2 and m-index could have a paradoxical effect. A finishing touch of bibliometric indexes seems to be important nowadays, in fact, Koltun and Hafner 17 demonstrated that the correlation of H-index to physics scientific award decline from 0.39 in 2010 to 0.00 in 2019 mainly due to hyper-authorship. In this set S2B may a reliable tool to overcome this trend.
It is evident that also this new system has limitations because it is possible that some academic biases could occur in the authorship position and because some complex research needs several people working on it, but it is unquestionable that the value of a first position is different from the indeterminate position. Moreover, in this analysis a perfect match for H-index, gender, age, and topic of research was not possible between Nobel and non-Nobel winners. Another limitation is that in some cases some of the control researchers shared publications with the Noble prize winners by generating a bias into the model.
This new System of Authorship Best Assessment could help to better understand the research output and could be useful to compare, in an unbiased way, different researchers in the scientific achievement by further expanding the knowledge derived from the simple H-index.
In conclusion two key results could be derived from this analysis
The H-index and number of citations calculated with the S2B (first/second/second-last/last position) correction for high-level researcher is similar to the global H-index and global number of citations
The percentage difference between H-index and citations calculated with the S2B correction and global H-index and total number of citations is very small for high level researcher (Nobel prize winners) and this evidence was confirmed by the performance of the other bibliometric indexes.
It is hoped that metric database systems (such as Google scholar, Scopus, ISI web, ResearchGate et al) incorporate these parameters in the researcher output quantification options and that further studies are being performed to test this model.
Footnotes
Declaration of conflicting interests
The author(s) declared no potential conflicts of interest with respect to the research, authorship, and/or publication of this article.
Funding
The author(s) received no financial support for the research, authorship, and/or publication of this article.
Significancy for public health
Bibliometric index is a critical need for academic and non-academic aspects. A new method is necessary for correctly evaluate research. h-index is limited by several drawback. The System of Authorship Best Assessment may help for better assess the researcher literature impact.