
Abstract
Assessing a population’s nutritional status and identifying specific causes and factors contributing to malnutrition are essential to implementing relevant interventions. This study aimed to assess the nutritional status and its correlates among adolescent girls and determine the most suitable growth chart/reference to estimate malnutrition among them. The cross-sectional sample consisted of 858 adolescent girls aged 10–19 years belonging to the rural and urban areas of district Ambala, Haryana. Height and weight were measured to calculate Body Mass Index (BMI). Socio-economic, demographic and dietary patterns were recorded using a structured questionnaire. Nutritional status was evaluated with the help of BMI using two different standards. Correlates of nutritional status were investigated using Chi-square test. According to the classification of WHO, stunting was shown by 60.73% of rural and 38.62% of urban girls. Wasting was witnessed in 52.43% of rural girls compared to 25.67% of urban girls. As per IAP growth charts, the maximum percentage (7.32%) of thinness was seen among rural girls, while only 1.96% of urban girls reported thinness. Urban girls exhibited a maximum percentage (19.36%) of overweight and obesity compared to 5.42% of rural girls. Undernutrition (underweight, stunting and wasting) was more prevalent among the rural girls, while the urban girls showed more incidence of overnutrition, that is, overweight and obesity. Socio-economic variables (parents’ educational status, occupation and monthly family income), demographic variables (family size, birth order and size of sib ship) and dietary habits (frequency of meals per day, food habits, consumption of milk and type of lunch) showed significant association with the nutritional status of the girls. Receiver Operating Characteristic Curve (ROC) analysis revealed the IAP growth charts to be the most suitable for assessing malnutrition among adolescent girls compared to WHO criteria.
Introduction
Adolescence is a crucial phase of growth and sexual maturation in the journey of human development. Nutrition, an important determinant of growth in adolescents, warrants special attention. Poor nutrition during adolescence can have adverse effects resulting in unpleasant outcomes. It can increase disease susceptibility and impair adolescents’ work capacity or productivity in their later years. Undernourished young girls grow into stunted women, and a vicious intergenerational cycle of malnutrition and ill-health continues if left unchecked.
India has the largest population of adolescents in the world, approximately 253 million (UNICEF). A national review has reported that adolescent girls are particularly vulnerable and commonly affected by the paradox of under- and over-nutrition (Sunitha & Gururaj, 2014). The National Family Health Survey-5 (NFHS-5) (2020–2021) reported malnutrition in children under 5 years of age in the state of Haryana with the prevalence of wasting (11.5%), stunting (27.5%) and underweight (21.5%). Some studies have been conducted to assess the nutritional status of adolescent girls in the state of Haryana, for example, among rural and urban girls of district Rohtak by Vashisht et al. (2009), rural girls of Agroha, district Hisar by Choudhary et al. (2015) and SC girls of district Yamuna Nagar by Goyal and Talwar (2020). Most of these studies have focussed on undernutrition among adolescent girls. However, as per the NFHS-5 report, 11.4% of urban and 16.9% of rural Haryanvi women (15–49 years) were categorised into BMI below normal category (<18.5 kg/m²), while 37.5% of urban and 30.9% rural women were in the overweight or obese category (BMI ≥ 25.0 kg/m²). It indicates that overnutrition is slowly becoming a significant cause of malnutrition in rural and urban areas. Rani and Rani (2016), in a study among rural and urban adolescents in the Fatehabad district of Haryana, found that the daily mean intake of energy in the diets of adolescents was significantly lower than their respective Recommended Dietary Allowances (RDA) given by National Institute of Nutrition (NIN, 2010). So, there is a complex interplay of many factors behind malnutrition. More in-depth research is needed to understand the underlying causes of malnutrition among adolescent girls and to design interventions for them specifically. Therefore, the present study was undertaken to assess the nutritional status and associated factors (socio-economic, demographic and lifestyle) among rural and urban adolescent girls of district Ambala, Haryana. An attempt has also been made to apply and compare two standard classifications of malnutrition, that is, WHO (2007) reference data and growth charts given by the Indian Academy of Paediatrics (2015), to determine the most suitable growth chart/reference to estimate malnutrition among them.
Material and Methods
Area and People
District Ambala is located between 27-39″-45′ North latitude and 74-33″-53′ to 76-36″-52′ East longitude in the northeastern corner of Haryana. District Yamuna Nagar is in the southeast of district Ambala, Kurukshetra to its south and Patiala, Ropar districts of Punjab and Chandigarh (Union Territory) in the west. Shivalik Range of Solan and the Sirmaur district of Himachal Pradesh are situated in the north. Ambala district has an area of 1,574 km2. It includes 1,440.40 km² of rural area and 133.60 km² of the urban area. Ambala has three sub-divisions which are also considered its tehsils, that is, Naraingarh, Ambala and Barara. There are 470 villages in the three tehsils (Naraingarh—170; Ambala—164; Barara—136). Ambala district has a population of 1,128,350 as per the 2011 census. Out of the total population, 627,576 persons live in rural areas, whereas 500,774 persons live in urban areas, that is, about 44.4% of the district’s total population (Census of India, 2011).
Participant Recruitment and Data Collection
The present study was conducted on adolescent girls of district Ambala, Haryana. The method of sampling used for data collection was the random sampling method. A cross-sectional sample of 858 participants aged 10–19 years belonging to rural and urban areas of district Ambala was collected. The total female population of district Ambala according to the 2011 census was 529,647 out of which 57,148 were in the age range of 0–6 years. Hence, subjects were selected from the actual population of 472,499 based on a random sampling method for data collection. The sample size of 858 is representative of the population of 472,499 at a 95% confidence level and with a confidence interval of 3.34.
Ethical clearance was taken from the departmental Ethics Committee of Panjab University, Chandigarh, and formal approval for data collection was taken from the District Education Officer of Ambala district. Prior written consent was obtained from the parents and participants after explaining the objective and methodology of the study. Each subject was also briefed about the purpose of the study before data collection.
Each subject’s birth date was recorded from the school/college register. The ages were calculated from the date of birth to the date of investigation, using the decimal age calendar given by Tanner et al. (1966). The data were divided into ten age groups, each with a magnitude of one year. Height and weight were taken on each subject using standard techniques given by Weiner and Lourie (1981). The instruments used to take measurements included an anthropometric rod for taking height and a weighing machine for taking body weight. Technical error of measurement (TEM) was recorded for both the measurements and was found to be less than 1%. For weight, the subject was asked to stand erect with head in the F.H. plane (Frankfurt Horizontal plane) on a weighing machine while keeping the body weight equally on both feet without shoes. For height, the subject was asked to stand erect, barefooted on a levelled surface with the heels together and head held in the FH-plane. The horizontal arm of the anthropometric rod was brought down to touch the highest point (vertex) of the head, and the reading was recorded in centimetres.
Classification of BMI/Nutrition Status [Based on References Developed by WHO (2007) z-scores (de Onis et al., 2007) and Revised Growth Charts by Indian Academy of Paediatrics IAP (Khadilkar et al., 2015)]
The nutritional status was assessed with the help of BMI [BMI= Wt (kg)/Ht (m²)] using two reference standards, namely references developed by WHO (2007) and Revised Growth charts by IAP (Khadilkar et al., 2015). As recommended by WHO (2007), the nutritional status of each subject was calculated as z-scores or S.D. scores for BMI-for-age and height-for-age, using WHO Anthroplus software. The cut-off point for malnourished children was taken as −2 S.D. scores below the reference median, while the cut-off points for mild, moderate and severe malnutrition were −1.1 to −2.0 S.D., −2.0 to −3.0 S.D. and less than −3.1 S.D., respectively. As per the Revised Growth charts by IAP (2015), the 3rd percentile was used to define thinness, and the 23rd and 27th adult equivalent percentiles were the BMI cut-offs for overweight and obesity, respectively.
A structured questionnaire was used to collect the participants’ personal information related to their socio-economic status (educational and occupational status of parents, household income) and demographic details (family type, size of family, birth order, sibship size). Prior to this, a pilot study was conducted on a cross-sectional sample of 120 adolescent rural and urban girls for pre-testing the structured questionnaire. The necessary modifications were done according to the received feedback. The participants were also asked about their dietary habits, including frequency and type of meals and milk consumption. A 24-hour dietary recall questionnaire was used to collect data on their food preferences and frequency of dietary intake. The socio-economic status of the participants’ families was assessed using Kuppuswamy’s revised socio-economic scale (Gururaj & Maheshwaran, 2014).
Statistical Analysis
The data were analysed using SPSS 16. ROC curve analysis was performed to determine the classification that best estimates malnutrition among girls. Pearson’s chi-square test was used to examine the association between nutritional status and its correlates in the study.
Results
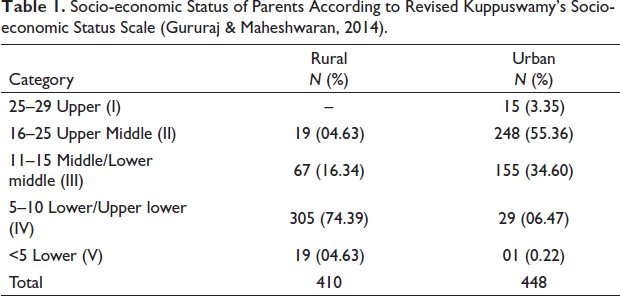
According to Kuppuswamy’s revised socio-economic scale (Gururaj & Maheshwaran, 2014), the majority of rural participants (74.39%) in the present study belonged to the Lower/Upper Lower socio-economic category, while a majority of urban girls (55.36%) belonged to Upper Middle-class families (Table 1). Among rural girls, most fathers (33.33%) had an education up to middle school, and 33.74% of mothers were educated up to the primary level. Among urban girls, most fathers (41.39%) and mothers (47.32%) were graduates, whereas 8.39% of fathers and 24.21% of mothers of rural girls were illiterate. On the other hand, 4.03% of fathers and 1.34% of mothers of urban girls had professional degrees (Table 2).
Socio-economic Status of Parents According to Revised Kuppuswamy’s Socio-economic Status Scale (Gururaj & Maheshwaran, 2014).
Educational and Occupational Status of Parents According to Revised Kuppuswamy’s Socio-economic Status Scale (Gururaj & Maheshwaran, 2014).
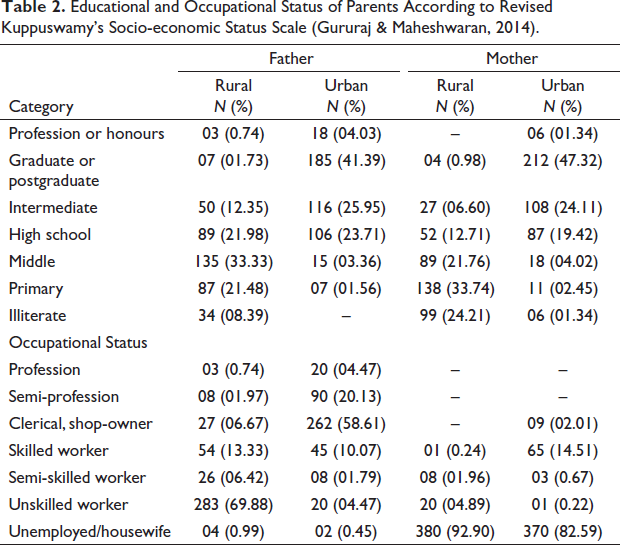
Fathers of rural participants mainly worked as unskilled workers (69.88%), while a majority of fathers of urban girls had clerical jobs or small businesses/shops (58.61%). Most of the mothers of urban girls (82.59%) were homemakers, out of which many (47.32%) had a graduate degree. About 92.9% of mothers of rural participants were homemakers. A total of 65.64% of girls belonged to nuclear families, whereas 25.87% were from joint and 8.49% from extended families.
The percentage distribution of adolescent girls in Ambala district in different z-score categories by height for age according to WHO (2007) classification is presented in Table 3. A total of 39.27% of rural girls were found to be normal (with a z-score of −1 S.D or less) and the remaining 60.73% were found to be in different categories of stunting, that is, 48.05% mildly stunted, 11.22% moderately stunted and 1.46% severely stunted. A total of 61.38% of urban girls were classified as normal (with a z-score of −1 S.D or less), while the rest of 38.62% were found to be in different categories of stunting (mild, moderate and severe; 32.59%, 5.58% and 0.45%) respectively.
Prevalence of Stunting Among Rural and Urban Adolescent Girls of Ambala According to WHO (2007) Classification.
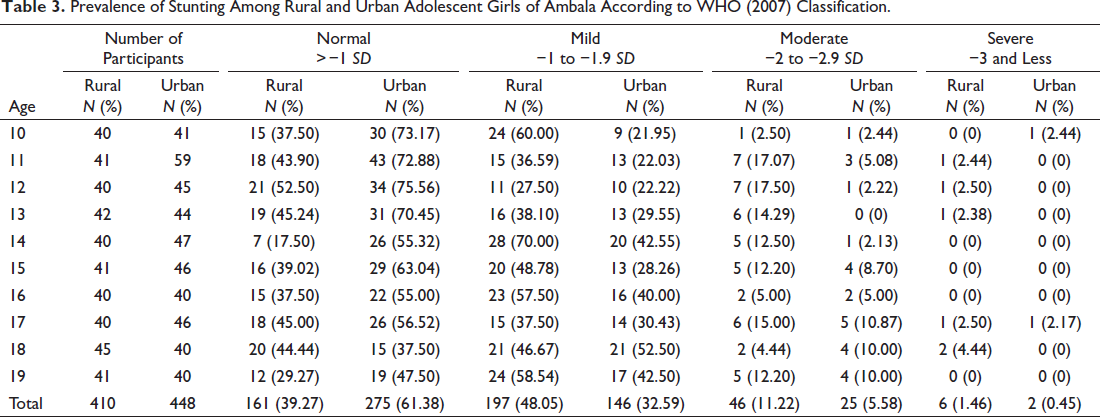
In comparison, the percentage of stunting (60.73%) among rural girls was higher in all three categories, that is, mild, moderate and severe, than in their urban counterparts (38.62%). In contrast, the percentage of urban girls in the normal category was more (61.38%) than rural girls (39.27%) (Figure 1).
Prevalence of Stunting Among Rural and Urban Adolescent Girls of Ambala with Respect to (Height-for-age) Z-score.
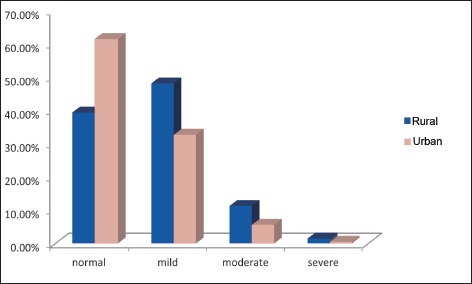
Table 4 presents the age-wise percentage distribution of adolescent girls in different z-score categories with respect to BMI for age. A total of 47.56% of rural girls were classified as normal (with a z-score of −1 S.D or less) and the remaining 52.43% were underweight (with a z-score −1 SD to −3 SD or less). A total of 31.46% of girls were in the mild underweight or wasting category and 16.58% and 4.39% were classified as moderately and severely underweight, respectively. A total of 74.33% of urban girls were classified as normal (with a z-score of −1 S.D or less), and 25.67% were found to be in different categories of underweight or wasting (mild, moderate and severe, 18.97%, 6.25% and 0.45%, respectively). The percentage of undernutrition (52.43%) among rural girls was more in all the three categories, that is, mild, moderate and severe; than their urban counterparts (25.67%), whereas the percentage of urban girls in the normal category (74.33%) was more than rural girls (47.56%) (Figure 2).
Prevalence of Wasting Among Rural and Urban Adolescent Girls of Ambala According to WHO (2007) Classification.
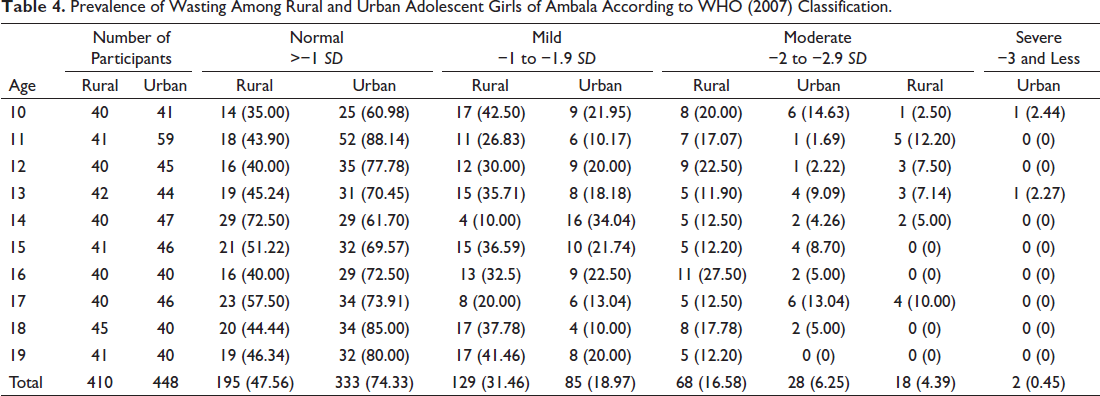
Prevalence of Malnutrition Among Rural and Urban Adolescent Girls of Ambala with Respect to (BMI-for-age) Z-score.
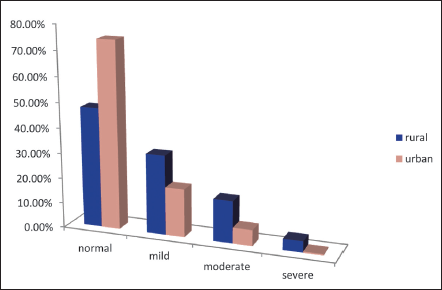
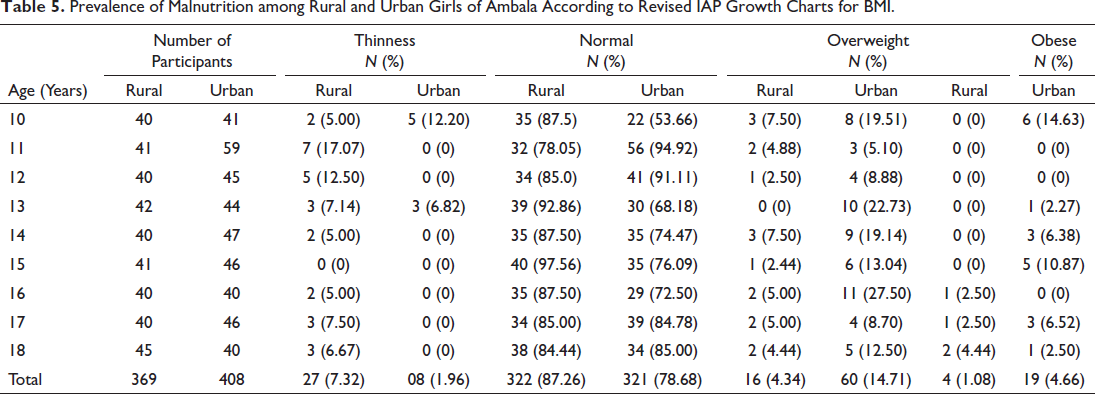
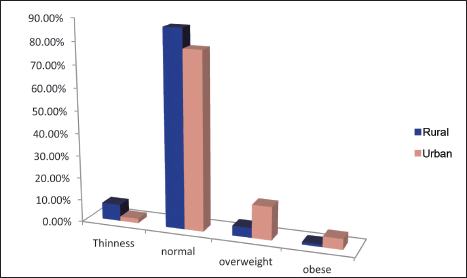
Table 5 presents the percentage distribution of thinness, normal, overweight and obese categories among the rural and urban adolescent girls of district Ambala according to classification by IAP charts for BMI. It was revealed that the percentage of thinness among rural girls (7.32%) was more than their urban counterparts (1.96%). The percentage of overweight (14.71%) and obesity (4.66%) among urban girls was higher than in rural girls, that is, 4.34% and 1.08%, respectively. In the normal category, rural girls (87.26%) overtook urban girls (78.68%) (Figure 3).
Prevalence of Malnutrition among Rural and Urban Girls of Ambala According to Revised IAP Growth Charts for BMI.
Percentage Distribution of Malnutrition Among Adolescent Girls of Ambala According to Revised IAP Growth Charts for BMI.
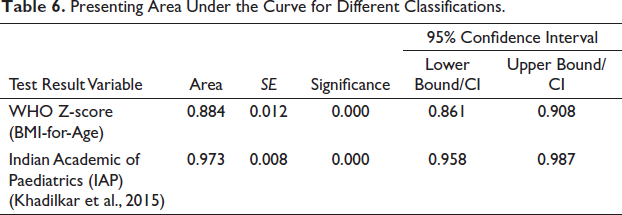
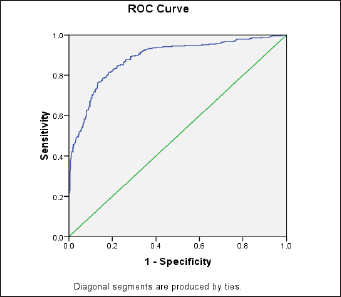
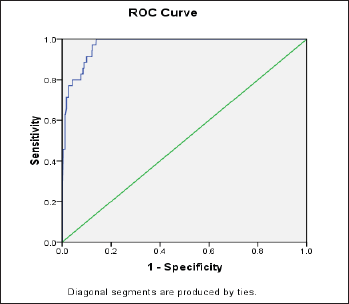
A comparison of the two classifications revealed that the combined prevalence of wasting among rural and urban girls was higher (38.46%) when classified according to WHO z-scores (BMI for Age) than by IAP (2015) classification (4.5%). WHO (2007) classification did not show any prevalence of overweight+obesity in the participants. The ROC analysis, as shown in Table 6, revealed that both standards significantly determined malnutrition. But the area under the curve (AUC 0.973) given by IAP (2015) was higher than (AUC 0.884) provided by the WHO (2007) reference, making the BMI classification proposed by IAP (Khadilkar et al., 2015) the most appropriate criteria to estimate malnutrition of adolescent girls in the present study (Figures 4 and 5).
Presenting Area Under the Curve for Different Classifications.
Correlates of Nutritional Status
In the present study, the nutritional status assessment of participants with respect to socio-economic, demographic and dietary habits has been done using BMI cut-offs given by the revised Indian Academy of Paediatrics (IAP) (Khadilkar et al., 2015) as it was found the most appropriate standard as per the ROC curve analysis. Since these growth charts include BMI percentiles up to 18 years of age only, participants of 19 years were excluded. Therefore, here our sample size has been reduced to 777 participants consisting of 369 rural and 408 urban girls. However, to get the complete picture, a chi-square test was also conducted between the selected variables and the nutritional status of the participants, assessed with the help of z-scores (WHO, 2007).
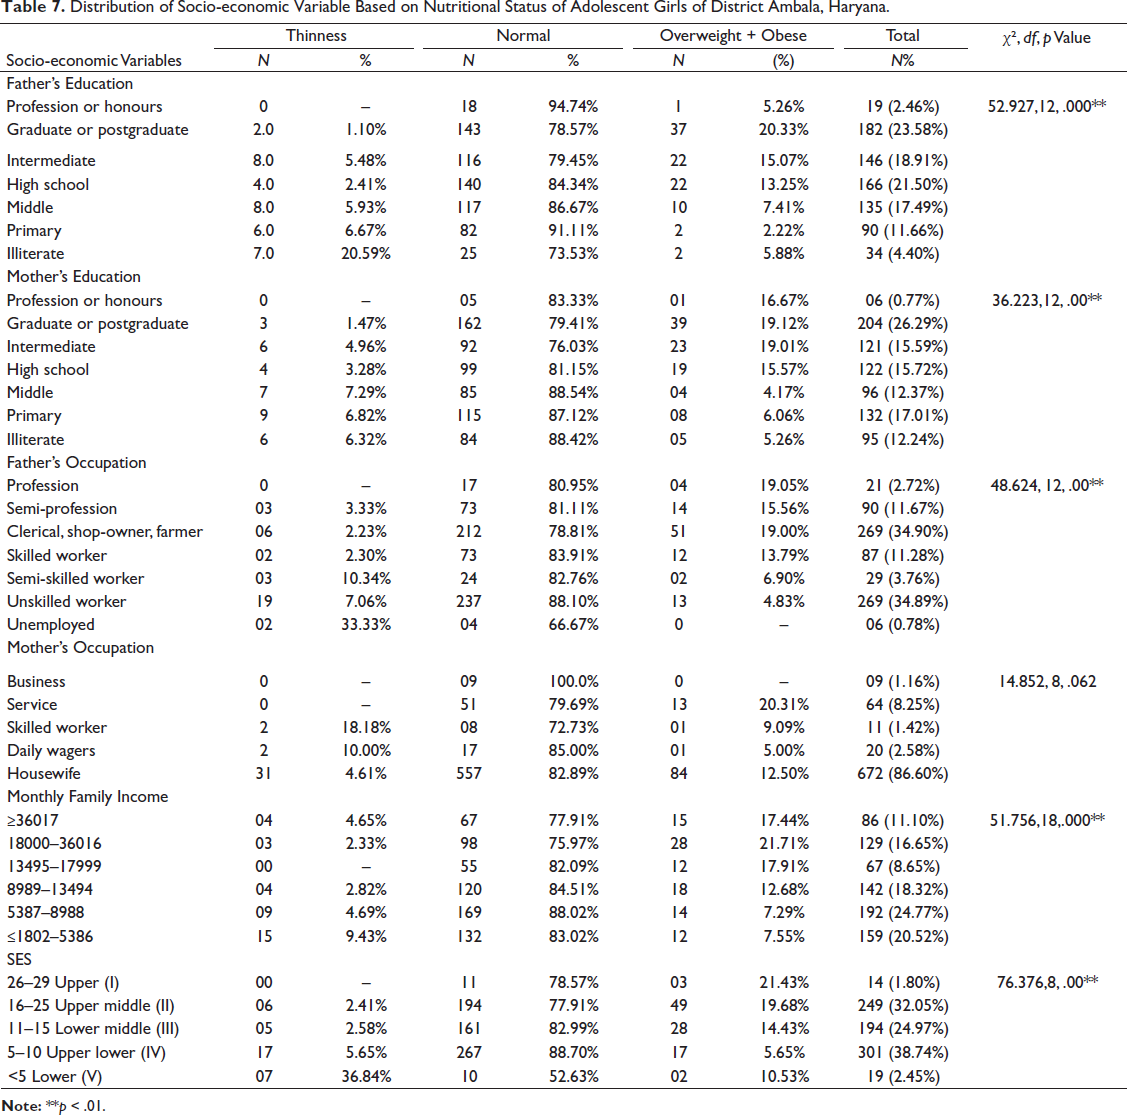
Among the socio-economic variables, χ² values exhibited a significant association of nutritional status of the participants under study with respect to educational status of their parents; fathers (χ² = 52.927, p value = .000**); mothers (χ² = 36.223, p value = .000**); occupational status of fathers (χ² = 48.624, p value = .000**) and monthly family income (χ² = 51.756, p value = .000**) (Table 7).
Distribution of Socio-economic Variable Based on Nutritional Status of Adolescent Girls of District Ambala, Haryana.
ROC Curve for Indian Academic of Paediatrics (IAP) to Estimate Undernutrition.
ROC Curve for WHO Z-score (2007) to Estimate Undernutrition .
Socio-economic status (SES) of the participants was calculated as per the revised Kuppuswamy’s socio-economic status scale (2014), and a significant relationship was found between SES and the nutritional status of participants (χ² = 76.376, p value = .000**). The maximum percentage (38.74%) of girls belonged to Upper lower (IV) socio-economic status, while the minimum percentage (1.8%) was from Upper (I) socio-economic status.
The girls residing in nuclear families, with a family size of ≤4 members, living in their own houses, with a sibship size of two and of first birth order showed better nutritional status. Family size (χ² = 17.612, p value = .000**) birth order (χ² = 5.919, p value = .052*) and size of sib ship (χ² = 20.484, p value = .000**) also affected significantly the nutritional status of adolescent girls of the present study (Table 8).
Distribution of Demographic Variables Based on Nutritional Status of Adolescent Girls of District Ambala, Haryana.
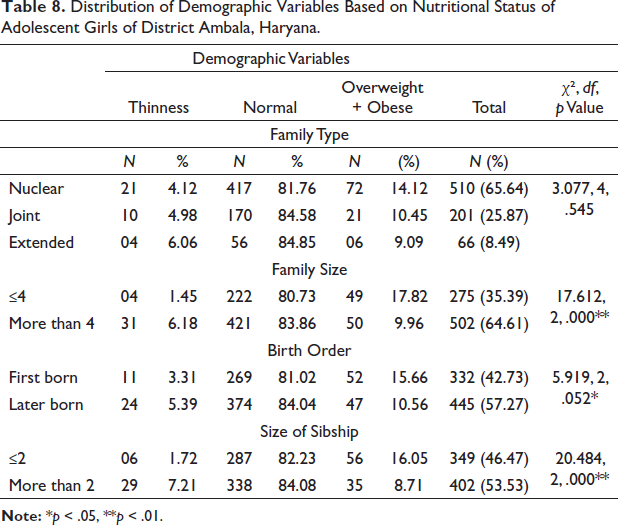
Table 9 shows the dietary habits and patterns of adolescent girls of district Ambala based on data collected through a 24-hour dietary recall questionnaire. It is evident from the table that a maximum number of participants, that is, 90.86% had three or less than three meals in a day, out of which 4.82% belonged to the thinness category, 83.43% normal and 11.76% belonged to overweight+obese category. Maximum participants (78.64%) were vegetarians, followed by non-vegetarians (14.93%) and eggitarians (6.44%). A significant association was revealed between the nutritional status and dietary patterns and dietary habits, that is, frequency of meals per day and food types as exhibited by χ²values (χ² = 7.969, p value = .019*; χ² = 27.358, p value = .00**).
Number and Percentage Distribution of Adolescent Girls of Ambala Based on Dietary Habits and Dietary Pattern among Different Nutritional Categories.
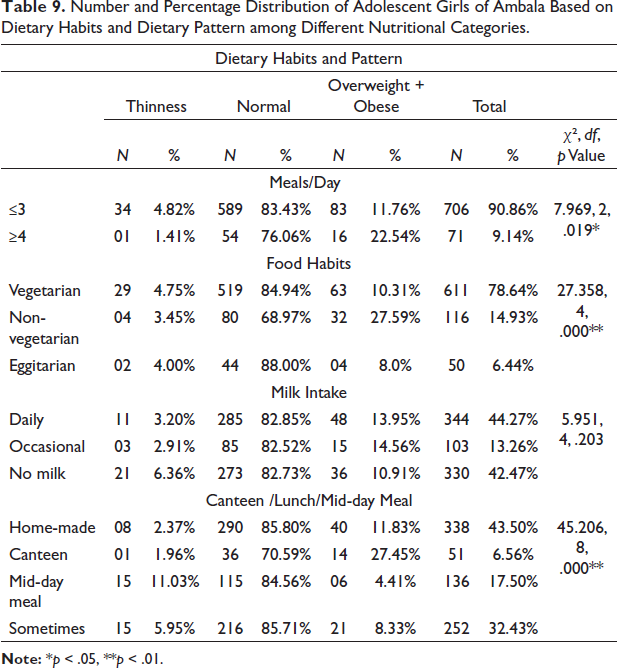
The maximum percentage of thinness (11.03%) was witnessed among those who had lunch provided by the school (Mid-day Meal) while the maximum percentage (27.45%) of girls in the overweight+obese category bought food from the canteen. In the normal category, the maximum percentage was of those girls who brought homemade food for lunch (85.80%). The Chi-square test showed a significant association between different food preferences during lunch-time and the nutritional status of adolescent girls (χ² = 45.206, p value = .00**).
No significant association was found between the participants’ nutritional status and their mothers’ occupation, type of family and milk intake.
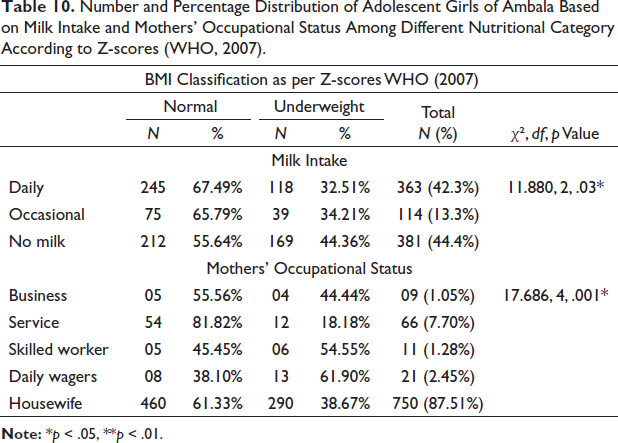
The associations found between nutritional status and their correlates among participants as per z-score classification (WHO, 2007) were the same as those found with IAP (2015) classification. However, a statistically significant association of nutritional status with frequency of milk consumption (χ² = 11.880, p value = .003*) and mothers’ occupation (χ² = 17.686, p value = .001*) was also reported (Table 10).
Number and Percentage Distribution of Adolescent Girls of Ambala Based on Milk Intake and Mothers’ Occupational Status Among Different Nutritional Category According to Z-scores (WHO, 2007).
Discussion
The nutritional status of adolescent girls warrants much attention as it affects not only their future health but also the health and development of the next generation. In the present study, the nutritional status of adolescent girls in Ambala, Haryana, was evaluated using two reference standards. According to the classification of WHO (2007), stunting was shown in 60.73% of rural and 38.62% of urban girls. Wasting was witnessed by 52.43% of rural girls compared to 25.67% of urban girls. As per IAP growth charts, the maximum percentage (7.32%) of thinness was seen among rural girls, while only 1.96% of urban girls reported thinness. Girls from urban areas exhibited the maximum percentage (19.36%) of overweight and obesity compared to 5.42% of girls from rural areas. Undernutrition (underweight, stunting and wasting) was more prevalent among the rural girls, while the urban girls showed more incidence of overweight and obesity, that is, overnutrition. It could be explained by existing social and economic disparities among rural and urban areas, lack of knowledge of their nutritional needs and a reflection of changing lifestyles. Increased adolescent obesity in urban areas could be attributed to higher socio-economic status and a complex interplay of various factors such as a change in food habits with fast food or more energy-dense food, reduced physical activity and the socio-cultural aspect of feeding and consumption. The ‘nutritional transition’, that is, shifting from traditional dietary patterns to a global platter has led to variety and increased choices but has not notably improved the nutritional quality of food consumed in urban areas (Popkin, 2003).
A comparison of the prevalence of undernutrition in the present study with various national studies has been presented in Table 11. The comparative profile of these studies showed that the prevalence of underweight/thinness among rural adolescent girls of district Ambala was lower than most of the population groups but higher than rural girls of district Palwal, Haryana and school-going girls of district Rajkot, Gujarat (according to IAP classification). However, the prevalence of stunting among rural girls was higher than that of most of the population groups except for Scheduled Caste girls of district Yamuna Nagar, Haryana and school-going girls of district Barnala and Mansa, Punjab. Similarly, the prevalence of wasting was also higher among the rural girls of the present study except for Scheduled Caste girls of Yamuna Nagar district, Haryana and rural girls of Kolar district, Karnataka.
Comparison of Prevalence of Malnutrition in the Present Study with Various National Studies Among Various Populations of India.
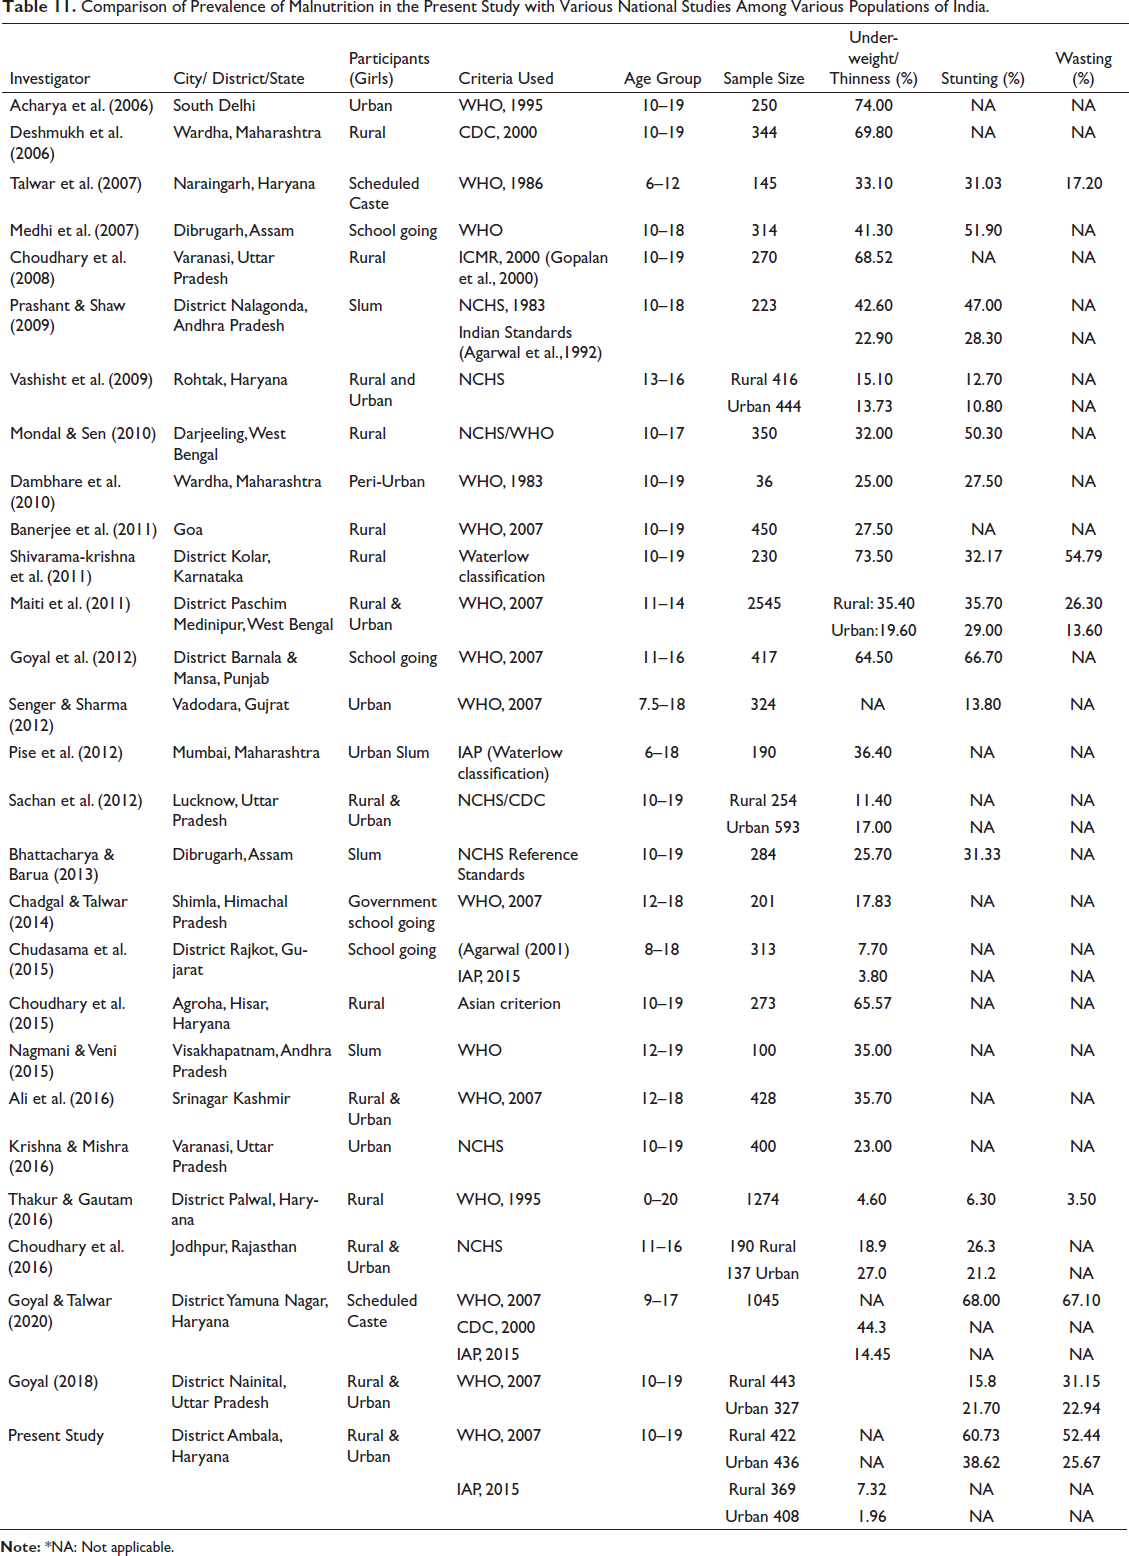
The prevalence of underweight/ thinness among urban girls in the present study was lower than the girls of compared population groups. The prevalence of stunting was higher than some of the population groups but lower than school-going girls of Dibrugarh, Assam; slum girls of district Nalgonda, Andhra Pradesh, classified according to NCHS standards; rural girls of Darjeeling, West Bengal; school-going girls of district Barnala and Mansa, Punjab and Scheduled Caste girls of district Yamuna Nagar, Haryana. Incidence of wasting among urban girls was also higher than Scheduled Caste girls of Naraingarh, Haryana; urban girls of district Paschim Medinipur, West Bengal; rural girls of district Palwal, Haryana; urban girls of district Nainital, Uttar Pradesh and lower than rural girls of Kolar district, Karnataka; rural girls of district Paschim Medinipur, West Bengal; Scheduled Caste girls of district Yamuna Nagar, Haryana and rural girls of district Nainital, Uttar Pradesh.
The differences noted in the above population groups can be attributed to different genetic and environmental correlates, such as diverse dietary habits and socio-economic backgrounds. Differences in sampling methods, age ranges and cut-off points used as standards to determine undernutrition may also add to these disparities.
Based on ROC curve analysis, the BMI classification proposed by IAP (2015) for Indian children was found to be the most appropriate criteria to estimate malnutrition in the present study compared to WHO (2007) reference data. In line with the result found in the present study, Venkatesh et al. (2015), in a comparative study among adolescent girls of Pondicherry, revealed that WHO (BMI-for-Age) z-scores (2007) overestimate the prevalence of thinness compared to revised IAP growth standards. Similarly, Haq et al. (2017), in a separate study, concluded that the WHO reference might be less suitable for use, especially in the Indian adolescent context, as it underestimates overweight and obesity prevalence.
The trend in recent public health research has been to view a man in the context of his total environment. The covariates of malnutrition are complex, and multiple factors come into play here. Identification of these factors is vital for making effective interventions. In the present study, among the socio-economic variables, the parents’ education was found to be significantly associated with the nutritional status of participants. Many studies reported similar results (Ahmed, 2003; Fokeena & Jeewon, 2012; Nabag, 2011; Washi et al., 1993). Parents with higher educational levels are more aware of nutritious food (Sims, 1993). In the present study, most girls in the thinness category had their mothers’ education up to middle school level (7.29%), which is in accordance with the findings of most of the studies, that is, low maternal education is a significant determinant of malnutrition. Education empowers women to make independent decisions, have greater access to household resources and increase awareness about personal hygiene and healthcare facilities that are vital for nutritional status (Das & Sahoo, 2011).
A significant association was also found between the nutritional status of adolescent girls with their parents’ occupational status, monthly family income and socio-economic status. In line with the results of the present study, many studies on nutritional status have shown stunted and underweight children belonging to low-income families depend on the quantity and quality of food consumed (Ahmed et al., 1991; Pipes, 1981).
The results of the present study showed that with the rise in socioeconomic status, there was an increased prevalence of overweight +obesity (Table 7). It is similar to findings in the studies by Kotian et al. (2010) in South Karnataka, Guo et al. (2012) in China and Ghosh (2014) in Kolkata. Here rise in obesity among girls of high socio-economic status shows that a rise in income does not necessarily mean knowing to make the correct food choices. On the other hand, as socio-economic status reduced, malnutrition’s prevalence increased, as a higher percentage of participants belonging to lower SES (36.84%) were underweight. Higher income helps provide access to healthcare, education and nutrition facilities.
The twin burden, that is, undernutrition and overnutrition in the present study is due to income disparities and their rural–urban residence. Similar findings from other high-inequality states of our country, India, have been reported by Subramanian et al. (2007).
Among the demographic variables, a significant association was found between family size and nutritional status, with girls from smaller families showing a lower percentage of thinness (1.45%) than girls belonging to bigger families (6.18%) (Table 8). Many studies reported similar findings, suggesting that larger family size leads to overcrowding and inadequate spacing, leading to severe malnutrition among children (Abdelaziz et al., 2015; Bhattacharya & Barua, 2013; Wolde et al., 2015).
A significant association of birth order and sibship with the nutritional status of adolescent girls was also observed. The maximum percentage of girls in the thinness category had more than two siblings (7.21%). According to Dewhurst et al. (1984), the effect of family size and birth order is due to socio-economic influences on nutrition.
Most malnutrition or thinness (5.39%) was seen among those born second or later in the present study. It can be attributed to the economic burden on the family after the birth of a second child and the negligence of subsequent children after the first child (Chandrashekarappa et al., 2017). Many other studies reported similar results showing demographic variables influencing the nutritional status of adolescents (Doustmohammadian et al., 2009; Mulugeta et al., 2009; Ozguven et al., 2010).
The association between nutritional status and dietary pattern of participants was studied, and the number of meals taken and food habits were found to be statistically significant, concomitant with the findings of other studies (Abdelaziz et al., 2015; Janssen et al., 2005). The minimum frequency of non-vegetarians was found in the thinness category (3.45%). Dror and Allen (2011) reported that intake of animal-source foods decreased stunting and improved growth, thereby reducing morbidity and mortality among malnourished children.
Most participants who drank milk daily were in the normal category (82.85%), and the maximum percentage in the thin category was those who did not drink milk (6.36%). A significant association was seen between milk consumption and the nutritional status of girls as per the z-score classification (WHO, 2007). Dairy foods are vital sources of calcium and other bone-building nutrients. Optimal calcium intake during adolescent growth is critical for adolescents to obtain their full genetic potential for peak bone mass (Cadogan et al., 1997).
It was found that mid-day meals were inadequate to meet all participants’ nutritional needs. The maximum percentage (11.03%) of girls in the thinness category had mid-day meals provided by school authorities (Table 9). The chi-square test showed a significant association between food preference and the nutritional status of adolescent girls. These findings agree with studies by Wolde et al. (2015) and Ali et al. (2016).
Various programmes like adolescent health programme, Weekly Iron-Folic Acid -IFA tablet Supplementation (WIFS), Rashtriya Kishor-Kishori Swasthya Karyakram (RKSK) and, more recently, Poshan Abhiyan have been implemented by Government of India to improve the nutritional status of adolescents. Adolescent girls are more vulnerable to iron deficiency and anaemia due to increased iron requirements during this period. The fortification of diet and supplementing of iron and folic acid for adolescent girls has been an important part of Govt initiatives. But there are problems with regular supply and distribution and the uptake of IFA tablets because of perceived and actual side effects such as gastric problems, constipation, weight gain and nausea (Sedlander et al., 2018).
Gender bias leading to poor-quality diet is also one of the reasons for inadequate diet among adolescent girls. The present study reinforces the need to identify and remove barriers like social norms and lack of awareness to enhance the reach of the current health and nutrition interventions.
Conclusion
In conclusion, it can be stated that growth charts by IAP (2015) were found to be the most suitable criteria for monitoring nutritional status. For rural and urban adolescent girls of district Ambala, malnutrition remains a significant problem. The challenge is to find ways to address both ends of the nutrition spectrum; undernutrition and overnutrition. A significant association between nutritional status to socio-economic variables (parents’ educational status, occupation and monthly family income), demographic variables (family size, birth order and size of sibship) and dietary habits (frequency of meals per day, food habits, consumption of milk and type of lunch) was exhibited by χ² values.
The limitation of our study is that being a cross-sectional study; it only depicts the current status of nutritional status of adolescent girls. The number of calories consumed by the participants and the level of nutritional deficiency among them could not be estimated.
Further investigation about how these correlates influence nutritional status and the prevalent cultural beliefs about food and health are needed to design appropriate intervention strategies. Regular monitoring of the nutritional status of children and adolescents in specific population groups is required to select the right indicators for targeting and evaluating dietary programmes.
Footnotes
Acknowledgements
Acknowledgments are due to the District Education Officer of district Ambala for providing permission to carry out data collection from various schools/colleges of the district and to the parents, principals and teachers of various schools for extending their cooperation to carry out the work.
Declaration of Conflicting Interests
The authors declared no potential conflicts of interest with respect to the research, authorship and/or publication of this article.
Ethical Approval
Ethical clearance for the collection of data on human subjects was obtained from the Panjab University, Chandigarh. A prior permission was obtained from the District Education Officer and Principals of schools along with the written consent of parents/legal guardians after explaining the objective and methodology of the study.
Funding
The authors received no financial support for the research, authorship and/or publication of this article.