
Abstract
Background:
Multimorbidity is prevalent and related to adverse outcomes. The effect on mortality is disputed, possibly because studies show differences in the diseases which operationalize multimorbidity. The aim of this study is to analyze the effects of three multimorbidity patterns (representing subgroups of diseases) on mortality.
Methods:
We conducted a longitudinal observational study based on insurance claims data of ambulatory care from 2005 to 2009. Analyses are based on 46 chronic conditions with a prevalence ≥1%. We included 52,217 females and 71,007 males aged 65+ and insured by the Gmünder ErsatzKasse throughout 2004. Our outcome was 5-year overall mortality documented as exact time of death. We calculated hazard ratios by Cox regression analyses with time-dependent covariates. Three statistical models were analyzed: (a) the individual diseases, (b) the number of diseases in multimorbidity patterns, and (c) a count of all diseases, all calculated separately for genders and adjusted for age.
Results:
During the study period, 12,473 males (17.6%) and 7,457 females (14.3%) died. The general effect of multimorbidity on mortality was small (females: 1.02, 1.01–1.02; males: 1.04, 1.03–1.04). The number of neuropsychiatric disorders was related to higher mortality (1.33, 1.30–1.36; 1.46, 1.43–1.50). Cardiovascular and metabolic disorders had inconsistent effects (0.99, 0.97–1.01; 1.08, 1.07–1.09). Psychiatric, psychosomatic, and pain-related disorders were related to higher life expectancy (0.87, 0.86–0.89; 0.88, 0.87–0.90).
Conclusions:
Chronic diseases have heterogeneous effects on mortality and generalized measures of multimorbidity reflect and even out the effects of the single diseases. In multimorbidity studies, a careful selection of diseases is therefore important.
Introduction
During the last two decades, there has been great interest in multimorbidity by researchers, health-care professionals, and policymakers. Studies estimate a prevalence of multimorbidity of at least 50% in the elderly population, 1,2 which even ranges up to 99% in the primary care population aged 80 years and older. 3 Many researchers found an association between multimorbidity and adverse outcomes, including increased health-care utilization and costs, poor health-related quality of life, or functional limitations. 4 However, multimorbidity is a complex phenomenon which comprises a huge number of diseases and disease combinations with inhomogeneous effects on outcomes. 5
Study results on the effects of multimorbidity reflect this complexity and sometimes report conflicting results. This is especially visible in the association between multimorbidity and mortality. Some studies found a strong relationship between these two factors, 4,6 while others did not confirm this association 7 or stressed interactions with other factors like disability. 8 One reason for these contradicting findings might be that studies show large differences in the disease spectrum by which multimorbidity is operationalized. 2,4 Studies including mostly serious and life-threatening conditions like cancer or dementia might show stronger associations between multimorbidity and mortality than studies that include mainly nonfatal diseases like joint arthrosis or somatoform disorders.
Multimorbidity patterns representing subgroups of diseases have been identified by various research groups to reduce the complexity of multimorbidity by considering frequent disease combinations. 9 For example, three multimorbidity patterns identified by factor analysis explained between 75% and 78% of the variance in the disease spectrum. 10 Until now, the role of the disease spectrum in the association between multimorbidity and mortality has not been systematically investigated. The aim of our study therefore is to analyze the effects of three different multimorbidity patterns on the 5-year overall mortality in an elderly population.
Methods
The analyses are based on claims data of the Gmünder ErsatzKasse (GEK, now BARMER/GEK). The GEK was a statutory health insurance company with 1.7 million insurants (in 2008), which corresponded to 2.4% of the statutory insured population.
In Germany, about 90% of the population is insured in statutory health insurance companies, because there is an obligation to be part of the statutory insurance system. The only exceptions are public servants (“Beamte”), clerics, professional soldiers, self-employed people (except artists and farmers), and people with an income over €52,000/year who decide that they want to leave the statutory health insurance system. People in Germany, who are not part of the statutory insurance system, can be insured by private health insurance companies.
Before 1992, the GEK primarily insured craftsmen. However, since 1992, all German statutory health insurance companies (including the GEK) are open for all occupational groups (if they are eligible for statutory insurance) and all regions of Germany are included. The data set contains pseudonymous data from every insured member of this company and includes the years 2004 till 2009. The sample consists of all persons in the data set who were aged 65 years and older and continuously insured throughout the complete year 2004.
The analyzed claims data include all diagnoses reported for reimbursement by ambulatory physicians from both general practices and specialized care. All problems managed by physicians within the statutory health insurance system have to be coded in International Statistical Classification of Diseases and Related Health Problems, 10th Revision (ICD-10) and forwarded to the health insurance companies as regulated by section 295(1) of the German Social Security Code SGB V and section 44(3) of the Federal Collective Agreement within the statutory health insurance system in Germany. 11
For this study, the patients’ morbidity was summarized in 46 diagnosis groups. Conditions were defined by ICD-10 codes, which were grouped together if diseases and syndromes had a close pathophysiological similarity and if ICD codes of related disorders were used ambiguously by coding physicians in clinical reality, respectively. Criteria for the selection of the diagnosis group were chronicity (i.e. at least 50% of the patients had a disease duration of 6 months or longer) and a prevalence ≥1% in our claims data set. 5,11
To analyze the effect of the morbidity spectrum on mortality, we defined three multimorbidity patterns based on the results of a tetrachoric factor analysis presented in another paper. 10 The patterns are shown in Table 1 and comprise (1) cardiovascular and metabolic disorders, (2) psychiatric, psychosomatic and pain-related disorders, and (3) neuropsychiatric disorders.
Multimorbidity patterns by gendera—results from tetrachoric factor analyses.

PAOD: peripheral arterial occlusive disease; COPD: chronic obstructive pulmonary disease; GERD: gastroesophageal reflux disease.
a Gender-specific associations of diagnosis groups with a pattern are presented in italic letters.
Diagnoses at baseline and during the following study period were only considered if they were coded in at least three of four quarters (3-month periods within a calendar year). This criterion was chosen to increase the validity of the data by avoiding transitory or even accidental diagnoses. Because of this procedure, the year 2004 is needed to define the baseline and changes in morbidity are assessed for each quarter during the 5-year period from 2005 to 2009.
Our measure of mortality was based on the GEK’s documentation of people leaving the insurance company because they had died. This measure includes the exact time of death (i.e. day, month, and year). Mortality was monitored between January 1, 2005 and December 31, 2009. The data from people who left the GEK for other reasons than death were included into our analyses as censored data.
The main outcomes of our analyses are estimates of mortality risks expressed as hazard ratios with 95% confidence intervals, which were calculated by Cox proportional hazard regression analyses. Independent variables were introduced into our statistical models as time-dependent covariates.
We performed three steps to consider the association of multimorbidity with overall mortality. In a first step, we examined one multivariable model in which all diseases are represented and each disease therefore is adjusted for the influence of all other diseases. In a second step, we analyzed another multivariable model representing the three multimorbidity patterns. In the third step, the statistical model comprised a disease count representing all diseases included in our data set. All Cox regression analyses were calculated separately for both genders and they were controlled for the age of the patients. All analyses were performed using R version 3.0.3.
The research presented in this article was conducted according to the principles expressed in the Declaration of Helsinki. We did not have to obtain informed consent, because our research was based on insurance claims data and the data set was analyzed anonymously (as regulated by German law in section 75 SGB X). The study was approved by the Ethics Committee of the Medical Association of Hamburg including the waiver of consent (approval no. PV3057).
Results
The sample consists of 123,224 patients at baseline of which 52,217 (42.4%) were female and 71,007 (57.6%) were male. The mean age of the females (72.8 ± 6,7 years) was a little higher than the mean age of the males (71.4 ± 5,7 years); 76,540 (62,1%) patients were multimorbid, that is, they had three or more chronic conditions defined by our list of 46 diagnosis groups. Associations between diseases and multimorbidity patterns have been reported elsewhere. 11,12
Disease prevalence at baseline and prevalence curves in relation to the baseline sample are shown in Figures 1 and 2. The loss-to-follow-up over time is shown as a grey area, which is identical in all figures. The diseases with the highest prevalence are hypertension (prevalence in females: 47.6%; in males: 43.2%), chronic low back pain (29.9%; 24.4%), and lipid metabolism disorders (29.5%; 27.8%). The diseases with the lowest prevalence are documented tobacco abuse in females (0.6%) and anxiety in males (0.8%). In spite of the continuously increasing number of deaths and other losses-to-follow-up, in almost every disease the total number of affected people is growing over time or at least staying at the same level. This indicates that the prevalence rates in the remaining population are increasing for all of the 46 diagnosis groups included into our analyses.

Relationship between disease prevalence and loss-to-follow-up in female patients.

Relationship between disease prevalence and loss-to-follow-up in male patients.
The number of events and the amount of censored data are shown in Figure 3. Both genders had a comparatively low number of censorings; 861 females (1.6%) and 717 males (1.0%) dropped out of the study for reasons other than mortality. There was a higher relative number of deaths in the male population than in the female population; 12,473 males (17.6%) and 7,457 females (14.3%) died during the study period.
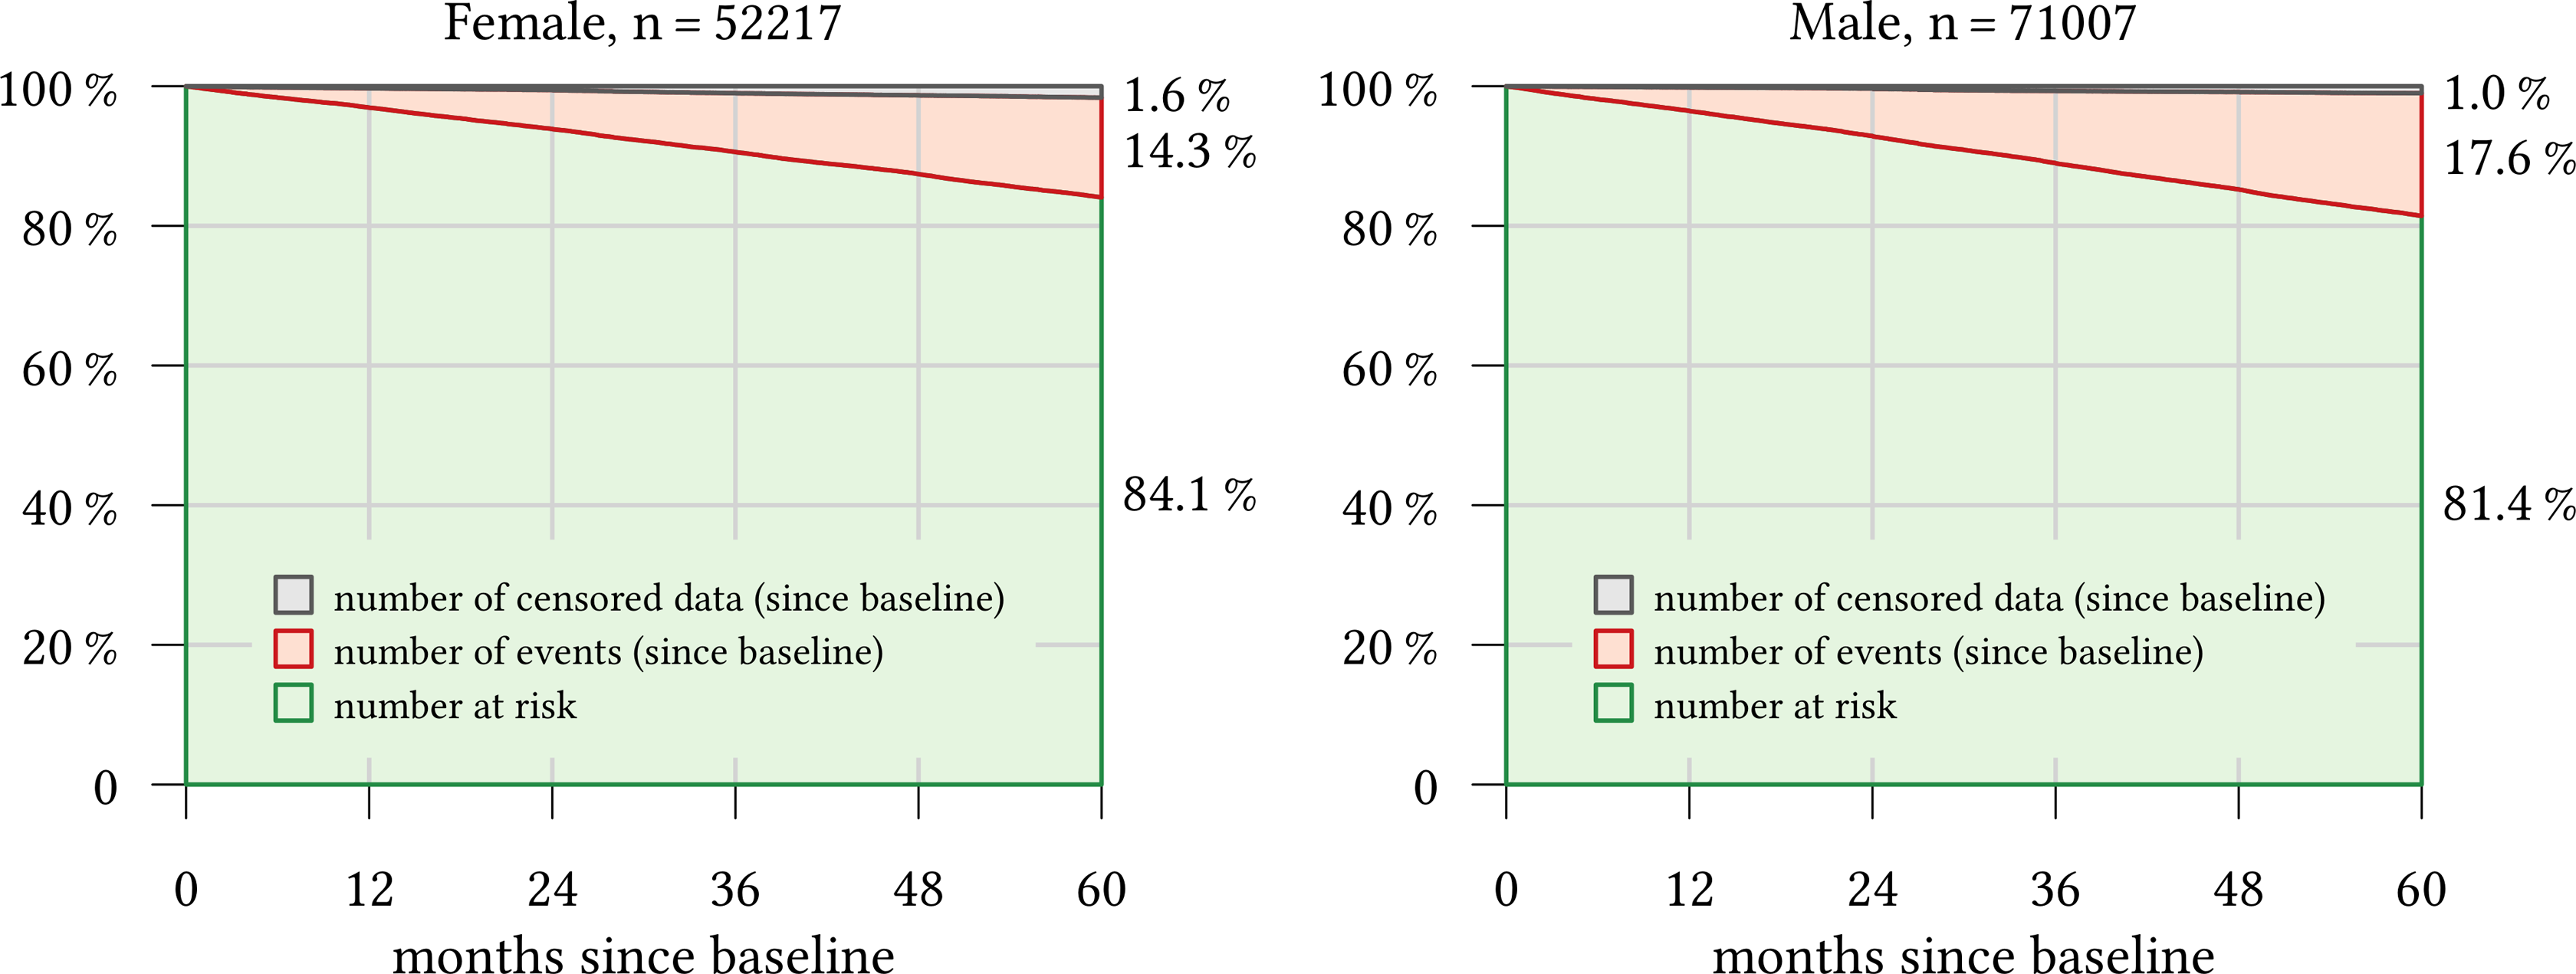
Number at risk, number of events, and censored data since baseline.
The results from the multivariable Cox regression analyses, in which the effect of all 46 diseases is adjusted for age and the effect of the other diseases, are shown in Figures 4 and 5. In these analyses, patients who have the specific disease are compared to patients who do not have it. For example, a hazard ratio of 1.13 for depression in females means that—irrespective of their additional morbidity—female patients with depression have a 13% higher risk of death within the next five years than female patients without depression.

Five-year overall mortality depending on chronic conditions in female patients: time-dependent HRs and 95% confidence intervals. HR: hazard ratio.
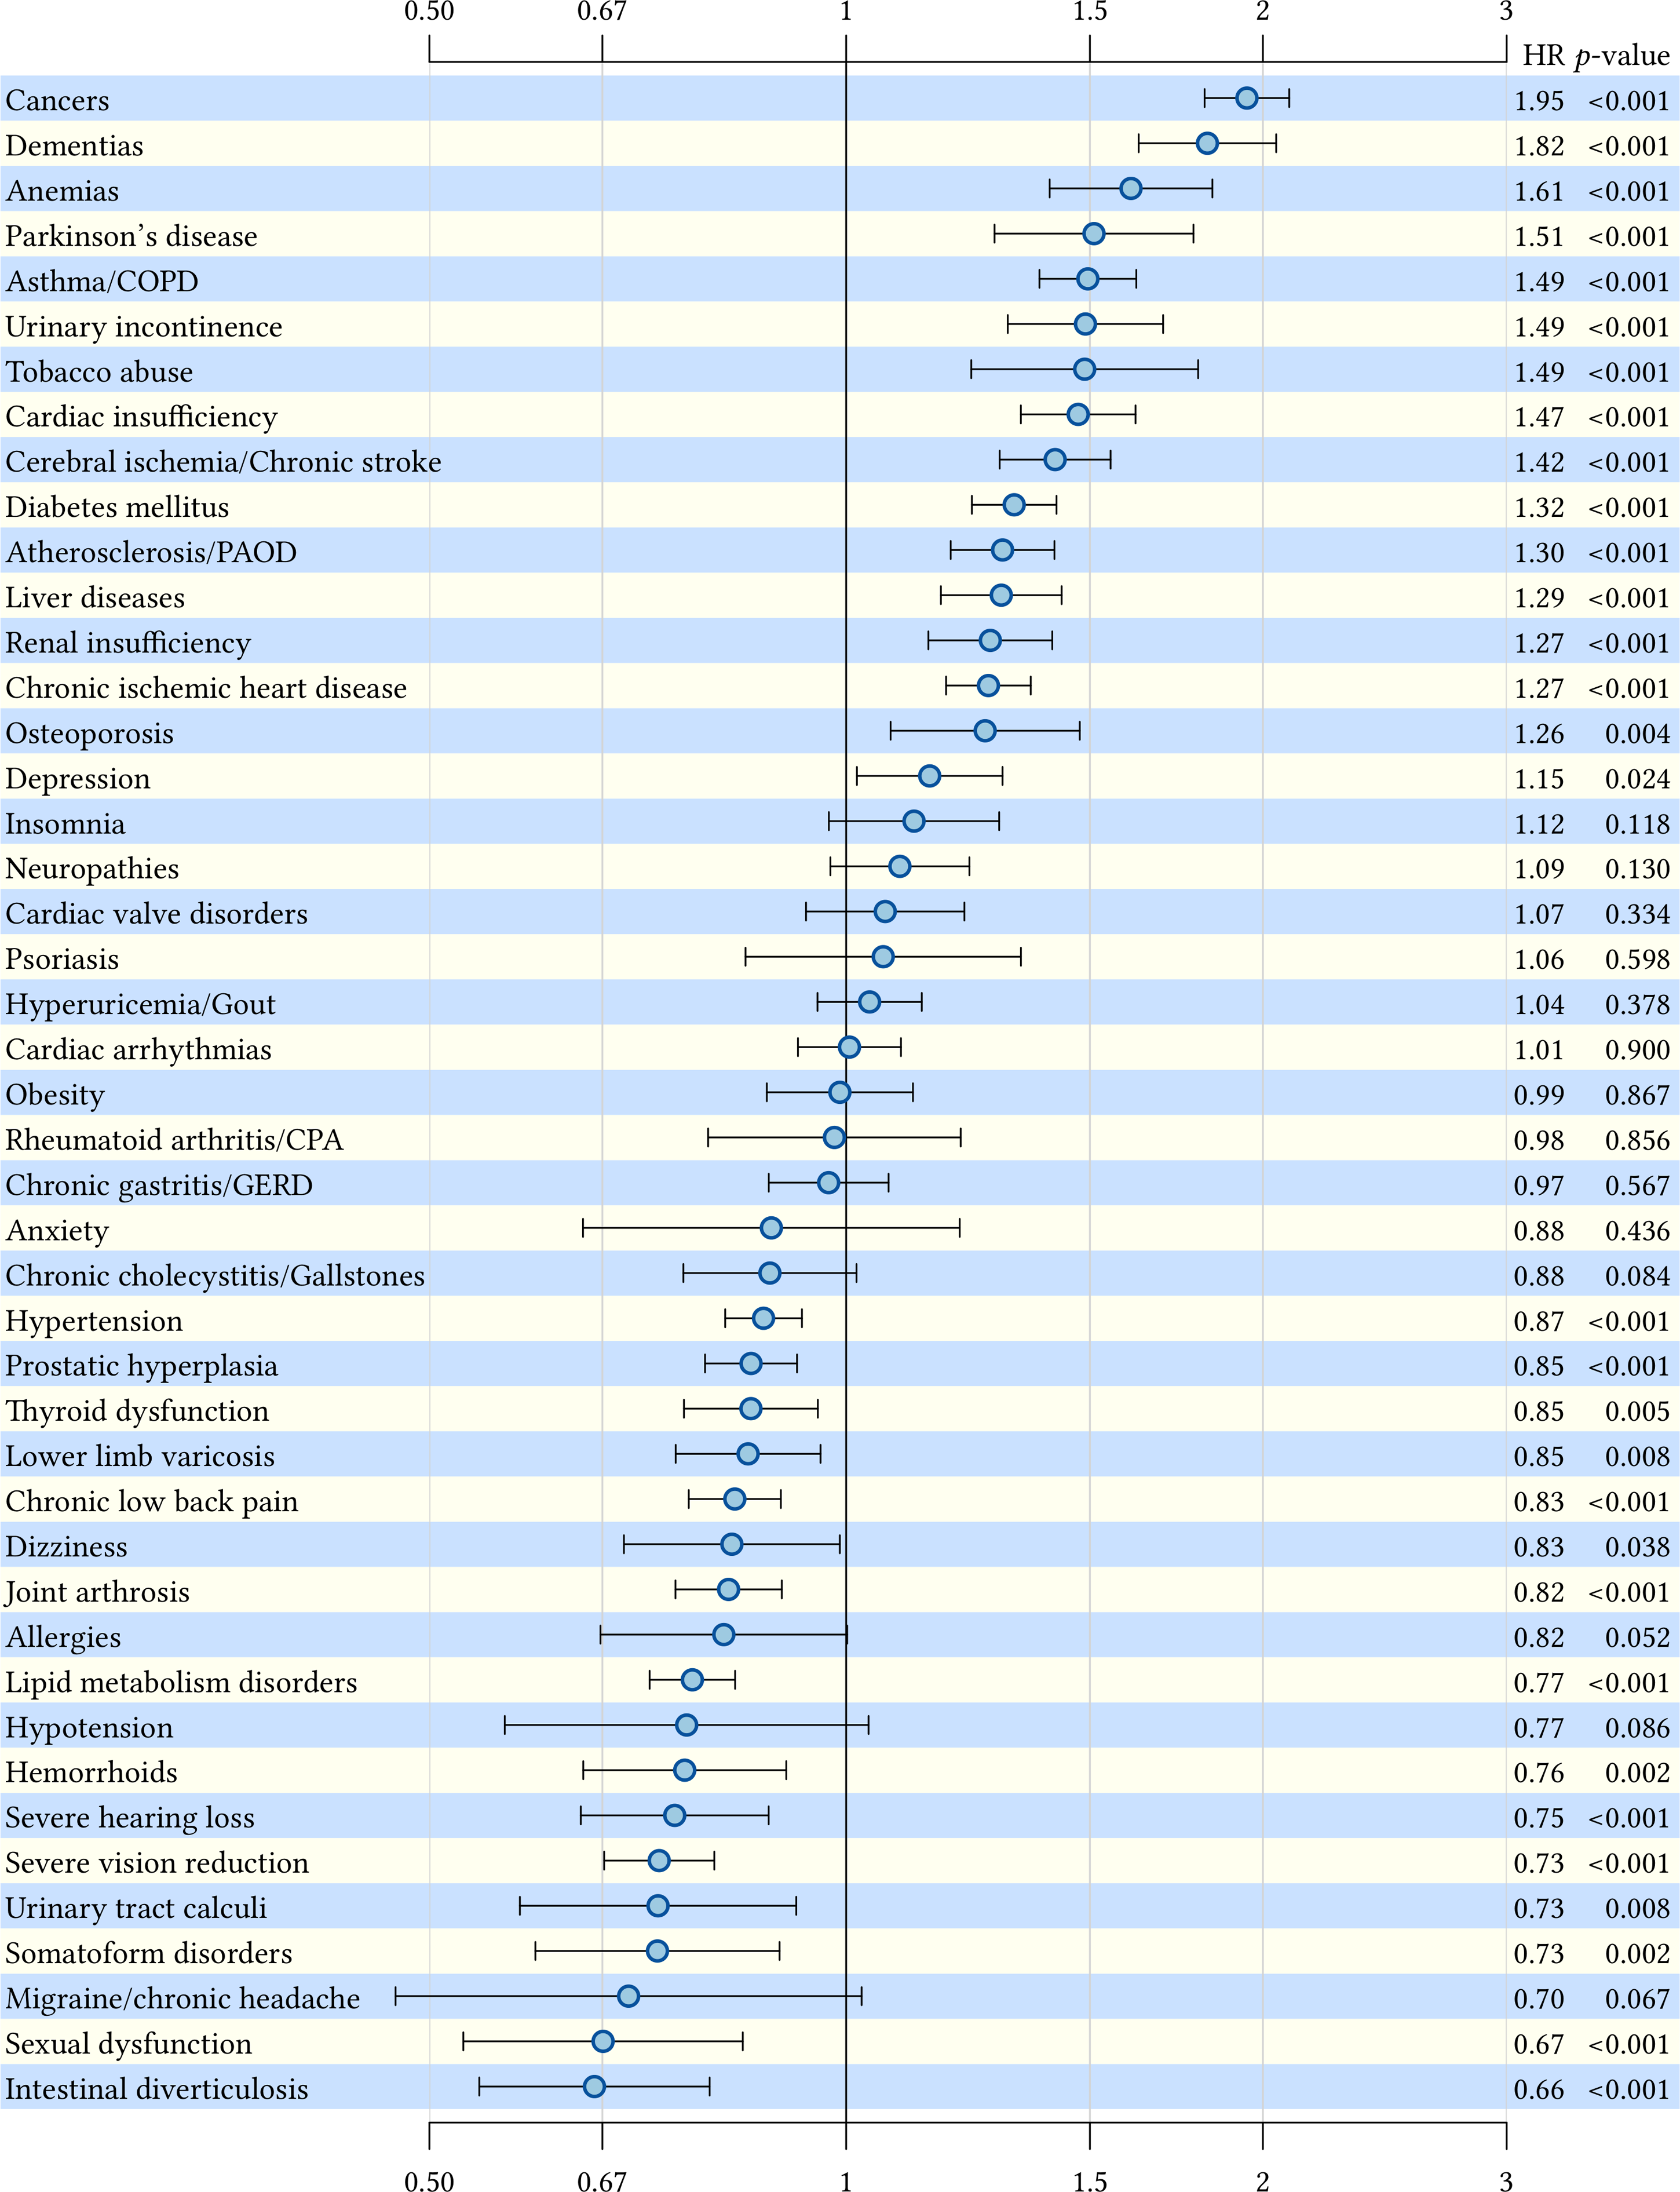
Five-year overall mortality depending on chronic conditions in male patients: time-dependent HRs and 95% confidence intervals. HR: hazard ratio.
The highest mortality risks were found in female patients with documented tobacco abuse (hazard ratio: 2.29, 95% confidence interval: 1.88–2.80), cancers (2.07, 1.95–2.20) and dementias (1.81, 1.69–1.93) and in male patients with cancers (1.95, 1.82–2.09), dementias (1.82, 1.63–2.04) and anemias (1.61, 1.40–1.84). In both genders, we found some diseases, which are associated with an increased life expectancy (i.e. a hazard ratio below 1.00). Intestinal diverticulosis in males (0.66, 0.54–0.80) and urinary tract calculi in females (0.70, 0.55–0.89) have the highest association with a better chance of survival.
In the analyses of each multimorbidity pattern, the results are adjusted for the number of diseases in the other patterns and hazard ratios refer to one additional disease in the respective pattern. For example, a hazard ratio of 1.08 for cardiovascular and metabolic disorders in males means that—independent of the number of diseases in the other multimorbidity patterns—one additional disease in the pattern of cardiovascular and metabolic disorder (e.g. one disease compared to no diseases or three diseases compared to two diseases) increases the mortality risk in male patients by 8%.
In both genders, the number of neuropsychiatric disorders is associated with a higher mortality risk (females: 1.33, 1.30–1.36; males: 1.46, 1.43–1.50). The number of cardiovascular and metabolic disorders also is significantly related to a higher death rate in males (1.08, 1.07–1.09) but not in females (0.99, 0.97–1.01). In contrast, the number of psychiatric, psychosomatic, and pain-related disorders is associated with an increased life expectancy in both genders (females: 0.87, 0.86–0.89; males: 0.88, 0.87–0.90).
The disease count representing all diseases has been analyzed separately and the hazard ratios here also relate to one additional disease. There is a statistically significant effect of the disease count on mortality showing that, with each additional disease, the mortality risk in both genders increases slightly (females: 1.02, 1.01–1.02; males: 1.04, 1.03–1.04). We also found an effect of age on mortality in both genders (females: 1.11, 1.11–1.11; males: 1.09, 1.08–1.09).
Discussion
Our study demonstrates that the morbidity spectrum in elderly patients is very heterogeneous regarding the effect on mortality. There are many diseases associated with a higher mortality risk and there are also many diseases that do not have a significant influence on mortality. Interestingly, there are also many diagnoses associated with a lower mortality risk, but this finding does not necessarily indicate that the respective diseases protect the patients from premature death. Rather, we have to keep in mind that we used claims data and that diagnoses depend not only on the health status of the patients, but also, to a certain degree, on the behavior of the patient and the physician. If patients and physicians have to focus on fatal illnesses, they might neglect diagnosis, treatment or documentation of conditions that do not influence life expectancy and, therefore, underdiagnose nonfatal diseases, for example, insomnia in patients with cancer. 13 For this reason, diagnoses associated with an increased life expectancy might just be a proxy for less severe comorbidity.
Apart from the effect of the individual diseases, we also analyzed the effect of multimorbidity (defined as the number of all diseases in the data set) and multimorbidity patterns (representing the number of a subgroup of diseases) on mortality. The number of neuropsychiatric disorders was clearly associated with an increased mortality risk, while cardiovascular and metabolic disorders seemed to have rather heterogeneous associations with mortality. In contrast, psychiatric, psychosomatic, and pain-related disorders were associated with an increased life expectancy. The mortality burden of the disease count representing all diseases was extremely small. With every additional diagnosis, the mortality risk increased by 2% in women and 4% in men. If we keep in mind that the effect of the individual diagnoses ranged from +129% to −52%, the effect of all diseases combined seems almost negligible.
Comparison with the literature
Considering the selected disease spectrum, our findings are in line with other studies on the association between multimorbidity and mortality. The effect of multimorbidity was higher in most studies if a higher number of individual diseases were associated with mortality. For example, St. John et al. found that the mortality risk increased by 6% with every additional disease after adjusting for age, sex, and education. The disease list included a few potentially fatal diseases like cancer or stroke, but also many general health problems without an obvious relation to a higher mortality risk like ear troubles or foot/ankle trouble. 14 In contrast, Lynch et al. included 16 chronic conditions into their analysis of which 13 had a statistically significant (positive) association with mortality. In their study, the effect of additional diseases was higher and depended on the kind of comorbidity. The risk of death increased by 20–50% with a second disease and by 20–110% with a third. 15
The small and inhomogeneous generalized effect of multimorbidity on mortality found in our study is also confirmed by other studies which showed that other factors like functional impairment performed better in predicting mortality than multimorbidity did. In a 2010 study of Landi et al., mortality depended more on disability than on multimorbidity. 8 A more recent longitudinal analysis in the same cohort came to similar conclusions. 16 Marengoni et al. found no effect of multimorbidity on mortality. However, as in the study by Landi et al., the mortality risk increased in the presence of additional functional limitations. 7 In a study by Wei and Mukamal, a multimorbidity index weighting conditions by their impact on physical health-related quality of life performed better in predicting mortality than a simple disease count. 17
The heterogeneity that we found in the association between multimorbidity and mortality has also been demonstrated for other outcomes, for example, long-term care dependency. 18 However, most studies on the association between multimorbidity and functional impairment did not report estimators for the individual diseases. Some of these studies found a significant association between multimorbidity and functioning 7,19 while others did not confirm this 20 or only under certain circumstances, for example, if one of the diseases was a rheumatic condition. 21 Recent systematic reviews also came to diverse conclusions and either stated that “multimorbidity predicts future functional decline” 22 or that the “consideration of multimorbidity in isolation is insufficient for predicting these outcomes.” 23
Strengths and weaknesses
Multimorbidity was defined by the number of diseases in each patient and statistical analyses were adjusted for the patients’ age and gender. However, the severity of each disease, other disease-related factors like functional limitations or geriatric syndromes and additional sociodemographic factors like educational level or marital status could not be considered, because they were not documented in the insurance claims data we analyzed.
Our study includes diagnoses of all highly prevalent chronic conditions (≥1%) in the age group 65 and older. In our analyses, morbidity was considered as time-dependent covariates, which meant that changes in morbidity throughout the whole observation period and time-to-event, as well as the length of exposure, were considered in our analyses. At baseline, many of the diagnoses had already existed for years; therefore, all disease stages were present from baseline on.
We performed a total of six statistical tests, but did not adjust for multiple testing. As different independent variables were included in the three statistical models, but all models were tested in both genders, Bonferroni-adjustment for two statistical tests (resulting in an alpha-level of p ≤ 0.025) could be justified. If we applied this adjustment, all reported associations with mortality—with the exception of liver diseases and neuropathies in females and dizziness in males—would remain statistically significant.
The data set did not comprise causes of death, so we had to use overall mortality as end point for our analyses. It is therefore possible that the patients died from other causes (e.g. acute diseases or injuries) than those represented in our statistical models.
Our measure of morbidity is based on coded diagnoses, which not necessarily correspond to the diseases. Although accidental and transitory diagnoses were excluded, in some cases, diagnoses might be imprecise, ambiguous, or incomplete because they were not clinically verified by the research staff. 24 It should be noted that setting and registry characteristics might influence the association between multimorbidity and outcomes, 25 so that results in other settings (e.g. inpatient care) or registries (e.g. data from other health insurance companies) might differ from those in our study.
In spite of these limitations, in our opinion, the benefits of claims data outweigh their disadvantages: We were able to include a large unselected population into our study, which represents real-world conditions and includes people living in protected institutions/nursing homes, as well as frail individuals, and the oldest-old. In choosing insurance claims data, we also avoided selection bias concerning service providers, and there is no recall bias concerning diagnosis data.
Conclusions
Chronic diseases have heterogeneous effects on mortality and generalized measures of multimorbidity reflect and potentially even out the effects of the single diseases included. Operationalizing multimorbidity in a multivariable model via the individual diseases might therefore be a better option to model the impact of morbidity. In this approach, the effect of multimorbidity can be calculated by adding the estimators for the individual diseases of one person.
Our study demonstrated that the effects of multimorbidity on mortality depend on the diseases by which multimorbidity is defined (e.g. mostly by cardiovascular and metabolic disorders or by psychiatric, psychosomatic and pain related disorders). This has implications for the right choice of selection criteria regarding the patients’ morbidity. On the one hand, studies interested in unbiased effects of multimorbidity should select the disease spectrum rather by applying neutral criteria like prevalence and chronicity than by relationship to the outcome under study. On the other hand, interventions in the field of multimorbidity should target patients with the highest risk of adverse outcomes. For example, our study suggests that patients with neuropsychiatric disorders might be an appropriate target population for interventions aiming to reduce the mortality risk of multimorbid patients.
Footnotes
Acknowledgement
The authors thank the health insurance company BARMER/GEK for providing the data.
Declaration of conflicting interests
The author(s) declared no potential conflicts of interest with respect to the research, authorship, and/or publication of this article.
Funding
The author(s) disclosed receipt of the following financial support for the research, authorship, and/or publication of this article: The study was funded by the German Federal Ministry of Education and Research (![]() ; grant numbers 01ET0725, 01ET0731 and 01ET1006A-K). The funders had no role in study design, data collection and analysis, decision to publish or preparation of the manuscript.
; grant numbers 01ET0725, 01ET0731 and 01ET1006A-K). The funders had no role in study design, data collection and analysis, decision to publish or preparation of the manuscript.