
Abstract
In sports, players transitioning between leagues often experience changes in performance statistics due to differences in competition level and player pools. For example, G League players (part of the NBA’s minor league system) may see declines in performance metrics when called up to the NBA. Quantifying league translation factors, i.e., the expected difference in performance between leagues, is crucial for accurately contextualizing player performance and understanding key differences between leagues. We present a new method for constructing league translation factors using a matching method and difference-in-differences (DD) estimator, providing a causal estimate of how a player’s existing statistics might have appeared in a different league. Unlike traditional approaches that rely on league-wide averages or
Keywords
Introduction
Evaluating player performance across different competitive levels is a fundamental challenge in sports analytics. For example, when a player transitions from the G League (the official minor league of the National Basketball Association (NBA)) to the NBA, their performance statistics often decline due to increased competition, not necessarily decreased skill. For example, in the 2022–23 season, Keon Ellis shot 51.7% from the field and 44.4% from three for the Stockton Kings (NBA G League), but the following season with Sacramento in the NBA, his field goal percentage fell to 46.1% and his three-point percentage to 41.7%.
This example illustrates a broader issue: statistics cannot be directly compared across leagues with differing levels of competition. A 50% field goal percentage in the G League is not equivalent in value to a 50% field goal percentage in the NBA. Quantifying how performance translates between leagues is therefore crucial for contextualizing player performance, facilitating fairer comparisons and supporting data-driven decision-making.
Formally, our goal is to estimate a league translation factor: the expected difference in a player’s observed performance statistic if they had played in one league rather than another, holding other factors constant. This goal can be framed as a causal inference problem under the potential outcomes framework, where the “treatment” is playing in a higher-level league and the “control” is remaining in the lower league. Estimating this effect requires controlling for confounding due to differences in player ability, opportunity, and development stage. Rather than projecting future performance, these factors provide a causal estimate of how a player’s existing statistics might have appeared if they had played in a different league under the same conditions, such as the same minutes played and career stage.
A simple but naive way to construct league translation factors is to compare league averages and adjust by the mean difference in values across leagues (see, for example, Table 1). However, this approach ignores differences in player pools and competition levels, leading to biased or counterintuitive results (see Section “Data” for further discussion).
Average field goal (FG), 3-point (3P) and free throw (FT) percentage for the NBA and G League 2023–24 season.

The challenge of comparing performance across leagues is not unique to basketball. In baseball, “major league equivalencies” (MLEs) were developed to adjust player statistics from the minor leagues to estimate expected performance in the majors. These factors, introduced by Bill James to compare player performance across eras and scoring environments rather than between competition levels (James, 2010), and later extended by others (FanGraphs, 2010), typically scale statistics additively or multiplicatively using ratios of league means.
One common variant uses standardized scores: a player’s statistic is expressed as a
Even when valid, these methods do not yield interpretable causal quantities. A more informative, publicly described method to construct league translation factors, when there are players that play in both leagues, is to compare performance of players that played in two different levels of the minor leagues (or a level of the minor leagues and the major leagues) within the same season. The difference in performance between the two levels can be averaged to get a general translation factor (FanGraphs, 2010). However, this method has limitations in basketball due to small sample sizes and instability in within-season estimates, as many players on two-way contracts (who play in the G League and NBA in the same season) appear in few NBA games and thus have small sample sizes in terms of free throw and field goal attempts as well as minutes played (see Figure 1).

Distribution of FTA (top plot), FGA (middle plot), and MP (bottom plot) for players that played in both the G League and NBA in the 2023–24 season. FTA, FGA, and MP in the G League and NBA are colored in blue and red respectively.
To address these challenges, we instead compare full-season performance across years, matching players who transition from the G League to the NBA with similar players who remain in the G League for a second season. This design increases sample stability and allows for adjustment for aging effects (Nguyen and Matthews, 2024; Page et al., 2013; Terner and Franks, 2021; Vaci et al., 2019). Matching on covariates such as age, position, usage rate, and prior-year statistics allows us to control for observable differences (Page et al., 2013; Stuart, 2010), while a difference-in-differences (DD) estimator isolates the average league effect (Bertrand et al., 2004; Card and Krueger, 1993; Meyer, 1995).
In this paper, we develop a framework for constructing league translation factors using matching and difference-in-differences methods. We apply this framework to estimate G League-to-NBA translation factors for a variety of basketball statistics and compare these estimates to those from existing methods. While causal inference approaches have been used in sports analytics (Gibbs et al., 2022; Vock and Vock, 2018; Yam and Lopez, 2019), this is the first application of a causal inference framework to the estimation of league translation factors.
This paper is organized as follows. In Section “Methodology” we describe our general methodology for constructing league translation factors. The data and metrics used to construct G League translation factors are described in Section “Data”, and we present the corresponding results in Section “G League-to-NBA Translation Factors”. Section “Discussion” concludes and discusses limitations and future directions.
Methodology
The most basic approach to constructing league translation factors is to calculate the average value of a statistic
Below, we define two other approaches that do not make strong distributional assumptions. The first looks at the average difference in statistic
Same season approach
One way to construct league equivalences is to consider players that play in two different leagues in the same season. For example, in basketball some players are “called up” from the G League to the NBA, thus getting playing time in both leagues in the same season. Furthermore, some players are on “two-way contracts.” Two-way contracts began in the 2017–18 season and allowed NBA teams to extend two (or three beginning with the 2023–24 season) players these contracts. Players under these contracts generally play in both the NBA and G League in one season.
To formalize this mathematically, let 
To address these potential issues we consider below a DD approach that matches players that played two consecutive seasons in the same league to players that played one season in one league and the next in a different league.
Difference-in-differences approach
Let
Under the potential outcomes framework, let 

To estimate
For the G League-to-NBA example, we implement genetic matching (Diamond and Sekhon, 2013) with replacement using the
Let 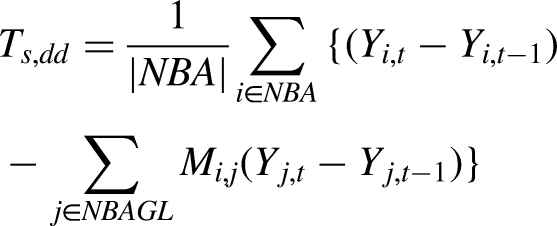
The validity of the difference-in-differences (DD) approach and the matching method relies on several key assumptions. First, the parallel trends assumption posits that, in the absence of treatment (in this case, transitioning from the G League to the NBA), the average change in performance statistics for the treated group (players who transitioned leagues) would have followed the same trajectory as the matched control group (players who remained in the G League). This ensures that any observed differences in performance can be attributed to the league transition itself rather than to underlying differences in player development or external factors.
In our setting, direct validation of the parallel trends assumption is constrained by data availability, as relatively few players remain in the G League for more than two consecutive seasons. Nonetheless, we assess its plausibility in two ways. First, we achieve close covariate balance on key predictors of player development (age, position, usage rate, and prior-season performance), reducing the likelihood that treated and control players would exhibit systematically different pre-treatment trajectories (see Appenidx B). Second, we compare pre-transition performance levels (season
For the matching method, the conditional independence assumption requires that, after accounting for the matched covariates (such as age, position, usage rate, and prior performance statistics), the potential outcomes are independent of the treatment assignment. In other words, once matched on these characteristics, players who transition to the NBA and those who remain in the G League should be comparable, allowing for a causal interpretation of the estimated translation factors. Additionally, our approach assumes sufficient overlap, meaning there is a comparable match for each treated player within the control group, which is necessary to avoid extrapolation and ensure robust causal estimates. Further discussion of these assumptions in our specific application, as well as balance tables demonstrating the quality of the matches, are provided in Section “Data” and Appendix B. These assumptions, when met, strengthen the causal interpretation of the translation factors and provide a more accurate representation of how performance metrics might translate between leagues.
While ideally we would estimate 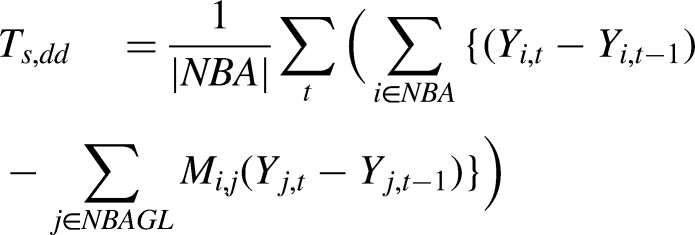
We can further condition
To quantify uncertainty in the estimated translation factors, we compute standard errors using a block bootstrap procedure that accounts for within-player dependence arising from repeated observations across matched comparisons (Otsu and Rai, 2017). Specifically, we resample players with replacement rather than individual player-season observations, ensuring that all appearances of a player are resampled together as a single block. This preserves the correlation structure within each player’s data. Standard errors are computed from the empirical distribution of translation factor estimates across 1,000 bootstrap replications.
Data
We consider G League and NBA data from the 2021–2022, 2022–2023 and 2023–2024 seasons. We pulled player performance data from www.basketball-reference.com/. Position and age data for G League players was extracted from https://basketball.realgm.com/. In the data cleaning process, there were 92 G League players that were missing age data. We manually added the age data extracted from gleague.nba.com.
For each player-season, we consider the following NBA and G League percentages (either per attempt or per 100 possessions as applicable): field goal, 3-point field goal, effective field goal, free throw, assist, offensive rebound, defensive rebound, steal, block and turnover. See https://www.basketball-reference.com/about/glossary.html for a complete list of definitions. Table 2 lists these statistics as well as the G League and NBA averages (with standard deviation in parentheses) across players (with more than 150 min played). These averages are used to calculate
Basketball statistics included in translation factor estimation.
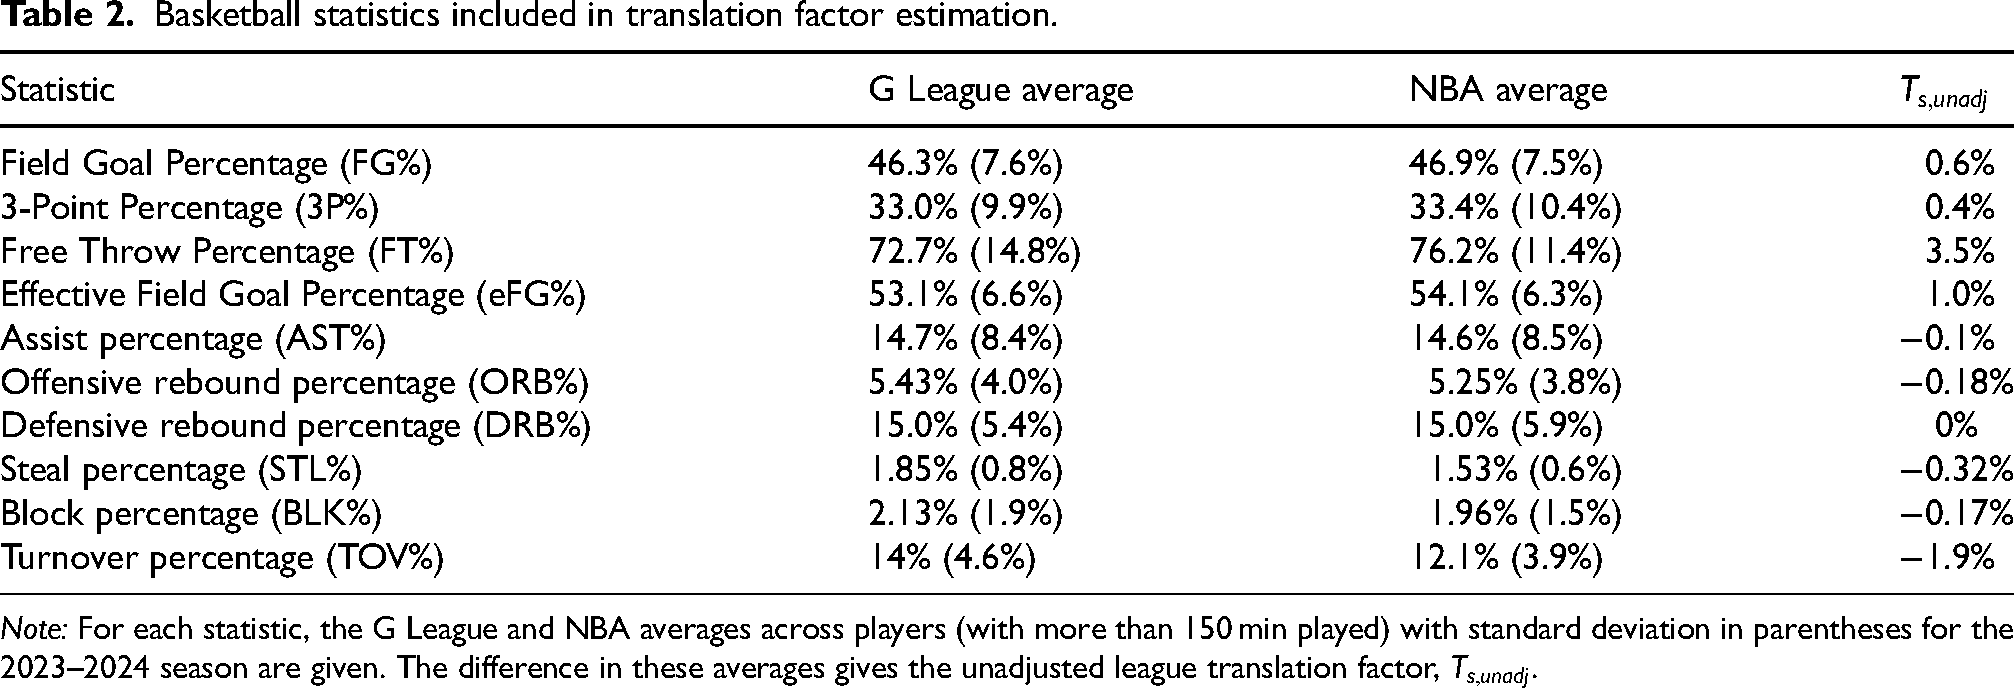
Note: For each statistic, the G League and NBA averages across players (with more than 150 min played) with standard deviation in parentheses for the 2023–2024 season are given. The difference in these averages gives the unadjusted league translation factor,
The G League has periodically implemented experimental rules, such as the Elam Ending and one-free-throw rule, to test potential NBA rule changes (Bontemps, 2022; Martin, 2024; NBA G League, n.d.). Because of these differences we focus solely on rate statistics, rather than raw totals or game outcomes, to ensure experimental rule variations are not expected to materially influence our estimates. Additionally, we restrict our sample to regular-season games, excluding the Tip-Off Tournament (formerly the Showcase Cup) since it precedes the regular season and follows a different competition format.
The values in Table 2 could also be used to calculate translations using the
In our analysis, we consider players that played in the G League for two consecutive seasons, and players that played in the G League one season and the NBA the next (2021–22 and 2022–23, or 2022–23 and 2023–24). If a player played in the G League one season and both the G League and NBA the following season, we consider their NBA data, in order to increase our sample size of G League-to-NBA players.
For each statistic we match NBA players to G League players based on that statistic the previous (G League) season, their age, usage rate, and their position. For FG%, eFG% and 3P% we match on all three statistics the previous year (FG%, eFG% and 3P%) to better summarize the underlying shooting ability of that player.
G League-to-NBA translation factors
In this section we present G League-to-NBA translation factors. In general, these translation factors should be interpreted as causal estimates of how a player’s performance might translate between leagues, given the same competitive timeframe.
Shooting statistics
We first consider G League-to-NBA translation factors for the four shooting statistics in our dataset: field goal percentage (FG%), three point percentage (3P%), effective field goal percentage (eFG%) and free throw percentage (FT%). For both the same season and DD methodology we consider only players that played at least 150 min in both the G League and NBA for the seasons considered for all statistics except FT% for which we considered players with at least 10 FTA in each league. As noted in Section “Methodology”, for the DD approach, players were matched based on age, position, usage rate, and the statistic of interest the previous year. For FG%, eFG% and 3P%, all three previous year statistics were matched on in the construction of the DD translation factor for each statistic.
For the same season method, there were 93 players (11 C/38 F/44 G) that met the 150 min played threshold and 89 players (10 C/39 F/40 G) that met the 10 FTA threshold across the 2022–23 and 2023–24 seasons. For the DD method, there were 81 matched pairs (equivalent to 162 players; 11 C/31 F/39 G) that met the 150 min played threshold and 88 matched pairs (equivalent to 176 players; 16 C/32 F/40 G matched pairs) that met the 10 FTA threshold. Balance improved across all statistics for the matched set of players. The standardized mean difference of the propensity score and all covariates is below 0.25, and the ratio of the variances of the propensity score and all covariates between the treated and control groups is below 2, satisfying the balance criteria recommended by Rubin (2001); Stuart (2010). See Appendix B for complete balance tables for each matched set.
In general, the DD approach yields translation factors that are smaller in magnitude than the same season approach. Both methods show a decrease in field goal, effective field goal, and three-point percentage for players transitioning from the G League to NBA. Table 3 presents the results of the same season and DD translation factors for the shooting statistics. Again we present these statistics as percentages to maintain consistent notation across all statistics in the paper.
G League-to-NBA translation factors calculated using the same season (
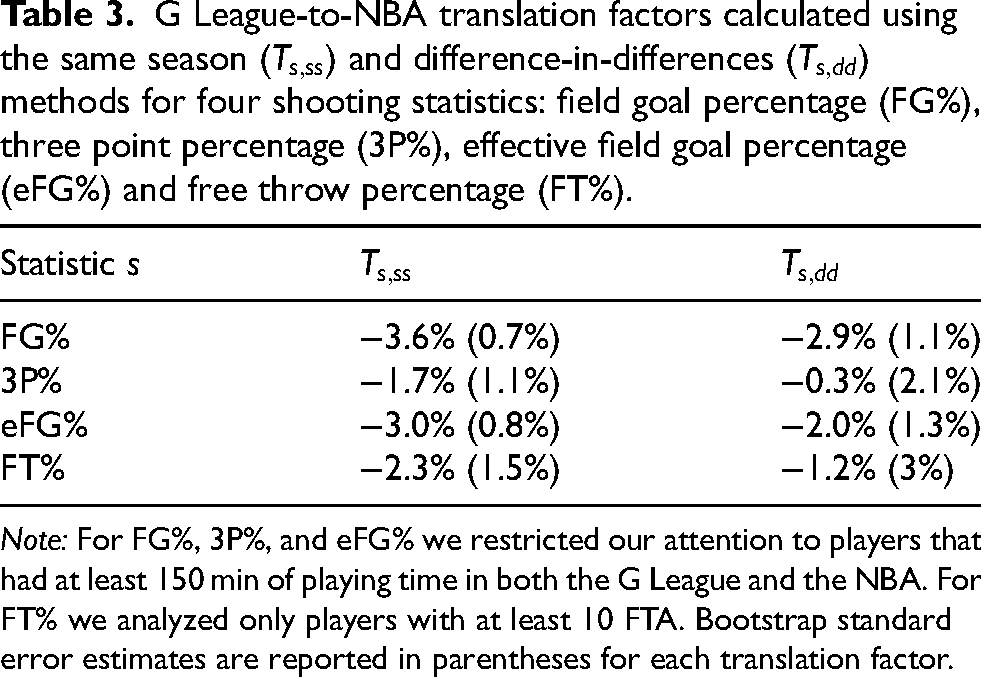
Note: For FG%, 3P%, and eFG% we restricted our attention to players that had at least 150 min of playing time in both the G League and the NBA. For FT% we analyzed only players with at least 10 FTA. Bootstrap standard error estimates are reported in parentheses for each translation factor.
Non-shooting statistics
Next we consider translation factors for six non-shooting statistics: assist (AST), offensive rebound (ORB), defensive rebound (DRB), steal (STL), block (BLK) and turnover (TOV) percentage. Again we consider only players that played at least 150 min in both the G League and NBA for the seasons considered for all statistics. As above, the sample size for the same season method was 93 players. For the DD approach, there were a total of 81 matched pairs (equivalent to 162 players; 11 C/31 F/39 G matched pairs). See Appendix B for details of the balance in the matched sets.
Both methods produce similar results, with the DD approach resulting in translation factors that are generally smaller in magnitude. Assist percentage sees the largest decline for players transitioning from the G League to NBA. Offensive rebound, steal and block percentage result in the smallest translation factors. Table 4 presents the results of the same season and DD translation factors for the non-shooting statistics.
G League-to-NBA translation factors calculated using the same season (

Note: We restricted our attention to players that had at least 150 min of playing time in both the G League and the NBA. Block bootstrap standard error estimates are reported in parentheses for each translation factor.
Discussion
In this paper, we develop a difference-in-differences and matching framework to estimate G League-to-NBA translation factors and compare it to standard approaches. The estimated translation factors have practical implications for player evaluation and league comparison. They provide a quantitative basis for comparing players across leagues on a consistent scale, offering baseline expectations for interpreting differences in observed performance between competitive environments. The results also help identify which performance metrics are most affected by league transitions, offering insight into which aspects of player performance are more sensitive to changes in competition level. Together, these estimates help in contextualizing league strength and enhancing cross-league comparisons.
Existing translation methods in sports often rely on comparing raw cross-league averages, which can be biased by differences in player pools and competition levels. When possible, we advocate for estimating league translation factors using subsets of players that played in both leagues, as in our proposed method, in order to get more accurate, empirically based estimates. Our approach requires some degree of player overlap between leagues to identify translation factors; extending the framework to settings with minimal or no overlap would require additional methodological development.
We compare our new approach to a same-season method previously used in baseball translation studies. In general, we find that our method tends to produce similar results directionally but that are smaller in magnitude. Our approach offers a substantial advantage by resulting in larger sample sizes in terms of minutes played per player. Figure 2 illustrates the distribution of minutes played (MP) and field goal attempts (FGA) for players included in the translation factor calculation for both the DD and same season methods. The DD method demonstrates a higher density of players with greater MP and FGA, contributing to more robust estimates. This advantage is especially useful when few players compete in both leagues within the same season, as it enables the estimation of translation factors even with limited same-season overlap.

Distribution of minutes played (MP) and field goal attempts (FGA) in the NBA for players included in the calculation of translation factors, described in Section “Methodology”, for the DD method (red) and same season method (blue).
Another key advantage of the DD method is its ability to account more explicitly for time and aging effects, offering a stable causal estimate rather than a potentially noisy projection. In contrast, the same season method does not adjust for changes in player performance over the course of a season, which can lead to less reliable estimates.
That said, the same season method may still be valuable in specific contexts, particularly when sample sizes are larger or when the goal is to derive projective translation factors for the specific subgroup of players who switch leagues within the same season. Future research could explore matching players in the same season approach to similar players who remain in the same league throughout the season, potentially reducing variability and enhancing the causal validity of the estimates.
One limitation of our framework is that it relies on only two adjacent seasons (i.e., one pre- and one post-transition) rather than multiple pre-treatment periods typically available in longitudinal difference-in-differences settings. As a result, we cannot empirically test the parallel trends assumption. Our design is therefore best viewed as a matched pre-post comparison that assumes conditional parallel change: after matching on relevant covariates such as age, position, usage, and prior performance, players who remained in the G League are assumed to represent the counterfactual trend for those who transitioned to the NBA. While this approach provides a transparent and interpretable estimate of average translation effects, it may still be sensitive to unobserved differences in player development trajectories.
Our method assumes that, conditional on observed covariates, league translation factors are additive, providing an interpretable approximation of league differences. Future work could explore nonlinear or interaction effects between covariates and translation factors to capture more complex player- or context-specific dynamics. Additionally, while our matching strategy achieved strong balance on observed covariates, any remaining unmeasured factors could introduce bias. Thus, our estimates should be interpreted as causal under a conditional independence assumption given the matched covariates.
Another limitation of our analysis is the relatively small size of the matched samples, reflecting the limited number of players who transition between the G League and NBA in consecutive seasons. Although this constraint is inherent to the available data, the use of matching with replacement and block bootstrap standard errors helps to mitigate concerns about power and variance estimation. The estimated translation factors should be viewed as representative of the population of players who make comparable transitions, rather than generalizing to all possible player movements across leagues.
This method has broad applicability across various contexts. While the box-score statistics presented in this paper have inherent limitations, translating these statistics can serve as a foundation for translating more complex composite metrics, such as Player Efficiency Rating (PER) (Basketball Reference, n.d.; Terner and Franks, 2021), which are constructed from weighted combinations of box-score metrics. In principle, the component-level translation factors could be combined to obtain translated composite metrics, although doing so would require validating how nonlinear weighting and covariance across components affect the resulting estimates.
Although our league translation factors provide a causal estimate rather than a predictive model, they could enhance existing projection methodologies by offering more accurate baseline inputs. For example, incorporating these translation factors into predictive models, such as player performance projections, could help refine expectations for players moving between leagues and improve the reliability of such projections. Furthermore, these methods can be extended to more advanced statistics, like expected possession value, and adapted to entirely different settings.
We note that these potential extensions, to composite metrics, advanced statistics, and other sports, are conceptual directions for future research rather than implemented analyses. The current paper establishes the empirical foundation for league translation using individual box-score statistics; demonstrating generalizability to other settings would require additional domain-specific validation. Nonetheless, the framework’s flexibility suggests broad applicability, from adapting to new performance metrics (e.g., expected possession value) to assessing player adaptability in other sports contexts, such as soccer or hockey.
Footnotes
Acknowledgement
The author would like to thank Ryan Elmore for his valuable feedback and support throughout the development of this research.
Funding
The author(s) received no financial support for the research, authorship, and/or publication of this article.
Declaration of conflicting interests
The authors declared no potential conflicts of interest with respect to the research, authorship, and publication of this article.
Appendix A. Z -score method assumptions
The
Figure 3 shows the FG% distribution for players in the NBA and G League with more than 150 minutes played in the 2023–24 season. The distribution of FG% in both leagues is roughly equivalent. It’s worth noting that both leagues also averaged a similar number of points per game: 113 in the G League and 114 in the NBA in 2023–24. Thus, a method like the one outlined by James (2010) which primarily involves scaling up or down statistics based on the average scoring per game in leagues, would result in little to no translation of statistics.
To evaluate the core assumption of the
Appendix B. Balance tables
Below we include balance tables for the matches used to construct translation factors in Section “G League-to-NBA Translation Factors”. Table 5 gives the balance table for the matched set used to calculate translation factors for FG%, eFG% and 3P%. Table 6 gives the balance table for the matched set used to calculate translation factors for FT%. Table 7 gives the balance tables for the matched sets used to calculate translation factors for AST%, ORB%, DRB%, STL%, BLK%, and TOV% (respectively, each matched set separated by a horizontal line). All matched sets exhibit substantially improved covariate balance relative to the unmatched samples, with standardized mean differences, variance ratios, and KS statistics meeting conventional balance thresholds for both individual covariates and the estimated propensity score (Rubin, 2001; Stuart, 2010).