
Abstract
The aim of this study was to analyse lap performance stability, stroke kinematic variables in the clean swimming phase and turn performance in the finals of the four 200 m short course (SCM) events (freestyle, backstroke, breaststroke, and butterfly). The sample included thirty-two elite female swimmers who competed in the 200 m finals at the 2019 LEN European Short Course Championships in Glasgow. Lap times, stroke kinematics, and turns were analysed using two approaches: (i) official lap time comparison (50 m), and; (ii) comparison of consecutive segments (25 m). Based on the official lap time comparison, performance significantly decreased over time (p < 0.001) with strong effect sizes in all strokes (η2 between 0.89 and 0.96). Pairwise comparisons between consecutive 25 m segments were not significant. Turn time increased in all four strokes with strong effect sizes (p < 0.001; η2 between 0.71 and 0.84). The start contributed ∼6% and turns ∼52% of the total race time. These findings highlight that traditional pacing analysis based on official splits may lead to misleading interpretations of performance in SCM events. Analysing 25 m segments provides a more accurate representation of race dynamics and contributes to a clearer understanding of pacing stability in short-course swimming.
Introduction
Comprehensive race analysis in competitive swimming has become an established framework for assessing all phases of the race (i.e., start, clean swim, turns, and finish) and for optimising training and performance strategies (Barbosa et al., 2021). Race analysis entails assessing swim performances to provide objective feedback on pacing, stroke kinematics, and overall performance. It also extends further by examining the data and making detailed recommendations to coaches and swimmers regarding race strategy, pacing, and technique refinement (Barbosa et al., 2021).
The literature indicates that different phases of a race contribute uniquely to swimming performance, with their influence varying by race distance (Gonjo and Olstad, 2020). For example, the start is particularly decisive in short events, such as the 50 m and 100 m, where rapid reactions and lower-limb power provide a competitive advantage (Arellano et al., 2022; Morais et al., 2019; Tønnessen et al., 2013). However, it should be noted that the importance of the start phase decreases as the race distance increases (Born et al., 2021). In general, swimmers often reach their highest speed during the start phase, followed by a continuous decrease in speed during the subsequent clean swimming (i.e., free-swimming) phase (McGibbon et al., 2018; Morais et al., 2022), a pattern characteristic of an all-out pacing strategy (Abbiss and Laursen, 2008). On the other hand, in longer races, such as 200 m and beyond, swimmers must regulate their energy expenditure more strategically, adjusting both starts and turns to sustain performance across the full race distance (Escobar et al., 2018; Veiga and Roig, 2016).
Clean swimming is a critical phase where increasing speed can affect the overall outcome of the race. Previous studies on 100 m events (Suito et al., 2015) indicate that in the final phase of the race, where fatigue accumulates most, swimmers need to regulate their speed to maintain propulsion and minimise deceleration and thereby optimise performance. However, it is important to note that there is considerable individual variability in pacing strategies. For example, in 100 m and longer races, some swimmers adopt a negative pacing strategy, improving performance towards the end despite a faster initial lap (Abbiss and Laursen, 2008; McGibbon et al., 2018). Conversely, middle-distance races (i.e., 200 m and 400 m) generally show a more even and stable pacing strategy from start to finish (McGibbon et al., 2018). Recent research in long course events, specifically the 200 m race, has shown significant variation between the four 50 m split times, which has been attributed to the high intensity demands of the event and the intentional modulation of pace within a controlled pacing strategy (Figueiredo et al., 2011; Morais et al., 2021). The turns require precise underwater technique (e.g., wall approach, rotation, push-off, and glide), as swimmers in the 200 m events strategically increase their underwater distance to conserve energy for the surface phase (Veiga and Roig, 2016). The finish becomes a critical segment, where clean swimming speed can have a significant impact on the final classification (Suito et al., 2015).
Building on this, evidence shows that the relative importance of the start, clean swimming, and turn phases shifts progressively as race distance increases (Lipinska et al.,, 2016; Morais et al., 2019). For 200 m events, the literature reports that the clean swim phase is the best predictor of the final race time (Arellano et al., 1994; Thompson et al., 2004). In this phase, performance is largely determined by stroke kinematics, particularly the interaction between stroke length, stroke frequency, and the resulting swim speed, which together reflect the swimmer's technical efficiency and fatigue response (Barbosa et al., 2008; Figueiredo et al., 2013). However, these findings primarily concern long course metre events, and mostly for male swimmers. While considerable attention has been paid to such events (i.e., events held in 50 m pools) (Arellano et al., 1994; Figueiredo et al., 2011; Marinho et al., 2020; McGibbon et al., 2018; Morais et al., 2021), swimmers in SCM races perform more turns and consequently spend proportionally more time in the turning phase. Nevertheless, there remains a notable research gap regarding SCM events (i.e., 25 m swimming pools).
A study by Wolfrum et al. (2013) reported that SCM events are more reliant on turns due to their greater contribution to race time. This occurs because swimmers spend more time turning and less time in the clean swim phase when compared to long course metre events (Born et al., 2021). Consequently, this may shift the focus of coaches and athletes in the design of their training programme, as turning performance is an important success factor in SCM races (Born et al., 2021; Polach et al., 2021), and more consistent turning times may differentiate the best from the worst swimmers (Cuenca-Fernández et al., 2022). It is also worth noting that in SCM events, splits are consistently taken every 50 m rather than every 25 m. This can lead to misleading interpretations of the swimmers’ performance because split times combine both the clean swimming and turning phases, which differ in speed and efficiency. As such, a faster split may reflect improved turning or underwater performance rather than higher clean swimming speed. Indeed, it has been reported, at least in long course metre events, that split times may not correspond to the clean swim speed on that lap (Morais et al., 2021). Therefore, the same reasoning may apply to the analysis of lap times in these SCM events.
Recent research by Cuenca-Fernández et al. (2023) investigated performance variation across all race sections in short course swimming. Specifically analysing how elite male swimmers progress between rounds in 100 m and 200 m events. Their study highlighted the importance of start and split times in shorter distances while noting that turn performance remained relatively unchanged. However, their work primarily focused on intra-individual variations and progression across heats, semi-finals, and finals, rather than on a detailed examination of performance stability and decline throughout a single 200 m race. Moreover, the present study examines performance variation within the final race of the 200 m events (i.e., freestyle, backstroke, breaststroke and butterfly), assessing how lap performance, stroke kinematics, and turn times change over the race. This approach addresses a gap in the literature by offering a more detailed examination of within-race performance trends, rather than across multiple rounds.
Therefore, this study aimed to assess lap performance stability, stroke kinematics, and turn performance in the four 200 m short-course events – freestyle, backstroke, breaststroke, and butterfly – among female finalists (elite level). Two approaches were used: (i) official lap time comparison (50 m), and; (ii) consecutive segments comparison (25 m). Stroke kinematics, including stroke length, stroke frequency, and swimming speed, are critical determinants of performance, as they reflect the swimmer's ability to maintain efficiency and propulsion throughout the race (Barbosa et al., 2008; Morais et al., 2023a). Given that swimmers progressively fatigue over the course of a 200 m event (Figueiredo et al., 2013), changes in these variables can provide insight into how fatigue impacts technique and pacing strategies. It was hypothesised that lap performance, clean swim variables, and turns would show a significant decline over time in both approaches.
Materials and methods
Participants
Participants were 32 elite female swimmers (N = 8 per stroke: backstroke, breaststroke, butterfly, and freestyle) who competed in the 200 m event final at the 2019 LEN European Short course Championships held in Glasgow. At the time of data collection, 200 m performances corresponded to 96.89 ± 0.85% (freestyle; 906.25 World Aquatics Points), 95.80 ± 1.54% (backstroke; 853.38 World Aquatics Points), 95.90 ± 0.74% (breaststroke; 841.5 World Aquatics Points), and 95.02 ± 1.25% (butterfly; 851.5 World Aquatics Points) of the world record. All procedures were in accordance with the Declaration of Helsinki regarding human research, and the Polytechnic Ethics Board approved the research design (N.° 73/2022).
Race analysis
The official race times and block times were obtained from the official competition website (https://glasgow2019.microplustiming.com/). A setup system consisting of 8 pan-tilt-zoom cameras (AXIS v5915, Lund, Sweden) was used to record high-definition video clips at a sampling frequency of 50 Hz. Each swimmer was recorded by an individual camera (i.e., one camera per lane). There was also a fixed camera (AXIS q1635, Lund, Sweden) at each end of the pool to record the start and turns. This allowed for distance calibration based on pool markings (e.g., 5, 10, 15, and 20 m marks) for the 25 m swimming pool, as had been done for the 50 m length (Oliveira et al., 2023). All cameras detected the flashing start lights, which were precisely synchronised with the official timer. The race analysis software was time-stamped using these lights as a reference (Morais et al., 2023b), and a pool calibration based on the pool distance marks was performed before each session. Two expert evaluators analysed the videos using an in-house software developed for race analysis in competitive swimming. This is a software that runs in Labview® (National Instruments, Austin, Texas, USA), allowing the analysts to retrieve the chronometric data and distances (calibrated by the pool's marks). All processes are manual, based on the pool marks and/or the swimmer's position. The use of this type of software and the potential errors associated with it have already been discussed in the literature, concluding that errors are often neglected and that a single lens is sufficient in comparison to a multi-angle camera (Tor et al., 2012). Additionally, the Intra-class Correlation Coefficient (ICC) was calculated on a representative subset of videos from each stroke to confirm the absolute agreement between both evaluators. Agreement was very high, with ICC values ranging from 0.989 to 0.999.
Race parameters
The analysis relied on fixed pool reference points to define each segment of the race. The 15 m mark was selected as it is the standard reference used in race analysis to delimit the end of the start phase and the beginning of clean swimming (Cuenca-Fernández et al., 2023; Veiga and Roig, 2017). All clean swim variables were measured in the middle 10 m of the swimming pool (i.e., from the 10 m mark to the 20 m mark, including all stroke cycles performed within this segment), except for the first lap, where they were measured between the 15 m and the 20 m marks due to the start phase. The swimmer's head was used as the reference point for kinematic measurements and the following variables were selected for analysis: (i) clean swim speed (in m/s); (ii) stroke frequency (SF, in Hz); (iii) stroke length (SL, in m), and; (iv) stroke index (SI, in m2/s). Clean swim speed was calculated as v = d / t, where d is the distance (in metres), and t is the time (in seconds). SF was calculated by computing the time taken to complete a full stroke cycle. This was analysed between the 10 m and 20 m marks (only full stroke cycles were included and the average was used for analysis). The SL was calculated as SL = v / SF (Craig and Pendergast, 1979) and the SI as SI = v · SL (Costill et al., 1985). For the turning phase, the main outcome variable was the total turn time, calculated as the sum of the time from 5 m before to 10 m after the wall (Born et al., 2021).
Statistical analysis
Normality assumption was analysed using the Shapiro–Wilk test and the data were normally distributed. The mean ± SD was chosen as the descriptive statistic and the 95% confidence intervals were also calculated. The relative contribution of the start and turn to the performance was calculated as the average amount of time (in percentage) that the swimmers spent performing: (i) the start (with 15 m time as the main outcome), and; (ii) the average of the seven total turns (5 m in plus 10 m out). For the stability of the variables related to the clean swim phase and turns, the mean stability was used (Morais et al., 2023b). Two statistical approaches were used to analyse pacing in the SCM 200 m events. First, 50 m lap time analysis was conducted using repeated measures ANOVA to evaluate overall pacing trends throughout the race, based on the official 50 m splits. Second, 25 m segment analysis was performed to assess pacing stability with greater precision, using repeated measures ANOVA to determine variations in consecutive 25 m segments for stroke kinematic variables and turn performance. Whenever appropriate, the sphericity assumption was corrected with the Greenhouse-Geisser corrective factor (Blanca et al., 2023). Bonferroni correction was used to verify significant differences between each pairwise. Only differences between consecutive pairwise comparisons were considered. The eta-squared (η2) was chosen as the effect size index and interpreted as: (i) no effect if 0 ≤ η2 < 0.04; (ii) minimal/trivial if 0.04 ≤ η2 < 0.25; (iii) moderate if 0.25 ≤ η2 < 0.64 and; (iv) strong if η2 ≥ 0.64 (Ferguson, 2009).
Results
Table 1 presents the descriptive data for lap performance, start and total turns. It also shows, per swim stroke, the relative contributions of the start and the average total turns to the 200 m race performance. Although not statistically significant, lap time showed a progressive increase until the last 50 m split. In the 50 m split, time decreased in freestyle and backstroke (better performances) and increased in breaststroke and butterfly (worse performances). The start had a greater contribution in the backstroke, followed by freestyle, butterfly, and breaststroke (Table 1).
Descriptive statistics (mean ± SD) and 95% confidence intervals (95CI) of lap performance, clean swim variables, and total turns per swim stroke.
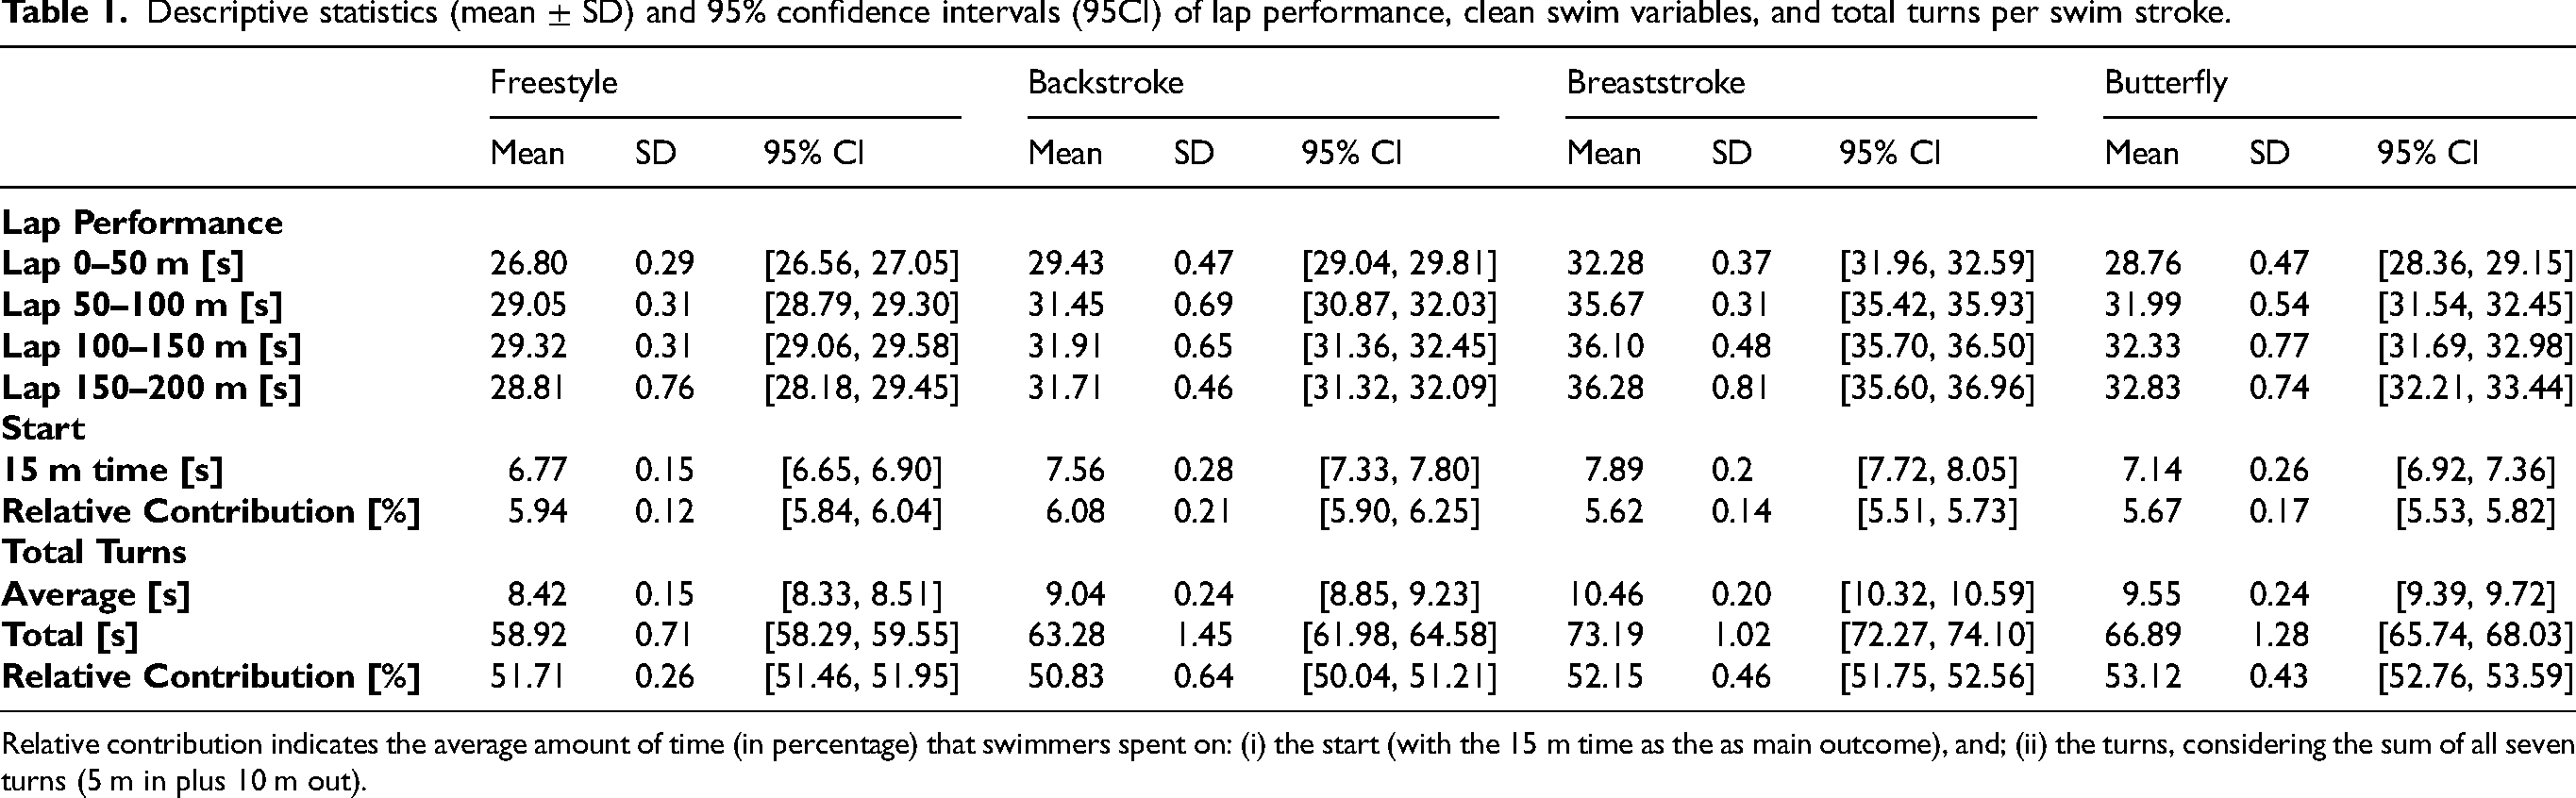
Relative contribution indicates the average amount of time (in percentage) that swimmers spent on: (i) the start (with the 15 m time as the as main outcome), and; (ii) the turns, considering the sum of all seven turns (5 m in plus 10 m out).
Figure 1 graphically presents data (mean ± SD) relating to the lap time performance, stroke kinematics, and total turns for each swimming stroke. The four columns represent freestyle, backstroke, breaststroke, and butterfly, respectively. Variables related to stroke kinematics (i.e., swimming speed, SF, SL and SI) and turns are also presented. Swimming speed tended to decrease over time in all four swim strokes. For the SF, there was an overall decrease in the first half of the race, followed by an increase in the second half. However, in breaststroke, SF began increasing immediately after the 50 m mark. SL and SI showed a tendency to decrease over time. As for the total turn time, it progressively increased throughout the race, indicating a slowdown in turn execution.

Lap time performance, stroke kinematic variables (swimming speed, SF, SL, SI) and total turns, by column, for freestyle, backstroke, breaststroke, and butterfly, respectively. Bars represent the standard deviation. The significance thresholds after Bonferroni correction were set at p < 0.013 for lap time, p < 0.007 for turns, and p < 0.006 for clean-swim variables.
Table 2 shows the stability analysis (ANOVA repeated measures) of lap performance, clean swim variables, and total turns per swim stroke for all 200 m events. The significance level was set at α = 0.05, adjusted to 0.013 for lap time, 0.007 for turn time, and 0.006 for clean swimming variables according to the Bonferroni correction. Lap performance showed significant differences (p < 0.001) with a strong effect size in all four swim strokes. The pairwise comparisons are shown in Figure 1. For freestyle, breaststroke and butterfly, significant differences were found between the 0–50 m and 50–100 m race sections. For backstroke, significant differences were found between the 0–50 m and 50–100 m race sections, and between the 50–100 m and 100–150 m race sections. These findings are detailed in Table 2. Although differences in clean swimming variables were observed across consecutive 25 m segments, these changes did not reach statistical significance in pairwise comparisons. For the total turn, significant differences were found in all four swimming strokes (p < 0.001) with large effect sizes. For freestyle, breaststroke, and butterfly, significant differences were found between the 0–25 m and 25–50 m race sections. For backstroke, differences were found in the same pairwise and between 50–75 m and 75–100 m.
ANOVA repeated measures for lap performance, clean swim variables, and total turns per swim stroke.

SF – stroke frequency; SL – stroke length; SI – stroke index; η2 – eta-squared (effect size index).
Discussion and implications
The aim of this study was to analyse the stability of lap performance, stroke kinematic variables in the clean swim phase, and total turns in the four 200 m SCM events of the female finalists competing in the 2019 LEN European Short Course Championships through two approaches: (i) official lap time comparison (50 m), and; (ii) consecutive segments comparison (25 m). Overall, the differences in lap times obtained by the ANOVAs in all four swimming strokes showed low stability (strong effect size) with a significant increase in time, partially confirming the initial hypothesis. In particular, significant consecutive differences were found between the first and second 50 m splits in all four swim strokes (and also between the second and third splits in the backstroke).
All of the clean swim variables analysed during the 25 m segments showed the same trend of low stability over time, with moderate to strong effect sizes in all four swim strokes. However, when applying a more precise analysis based on consecutive 25 m segments—considering the full race dynamics in an SCM event rather than relying solely on 50 m splits—performance still exhibited fluctuations across all segments, as expected in a competitive race. Nonetheless, these variations did not reach statistical significance in pairwise comparisons (i.e., consecutive 25 m segments) for any of the clean swim variables. This suggests that, although performance progressively declined, the pacing pattern remained relatively stable across 25 m segments (i.e., without significant differences between consecutive pairwise). This finding contrasts with traditional pacing analysis based on 50 m splits, which, due to the significant differences observed between these larger segments, may give the misleading impression of greater pacing instability in SCM events. Total turns showed an overall significant effect with a large effect size across all four swimming strokes, indicating that turning performance varied meaningfully throughout the race. Pairwise comparisons revealed that these differences were specifically located between the first and second 25 m segments in all strokes, which reflects the influence of the initial start and the subsequent adjustment of underwater distance and breakout technique during the early race phase. In backstroke, an additional significant difference was also observed between the third and fourth 25 m segments, possibly due to accumulated fatigue affecting turn efficiency and underwater propulsion in the latter part of the race. In terms of the relative contribution of the start and total turns to the final race time, the start contribution ranged from 5.62% in breaststroke (lowest) to 6.08% in backstroke (highest), while the total turn contribution ranged from 50.83% in backstroke to 53.12% in butterfly.
The management of energy expenditure plays a crucial role in swimming performance, becoming increasingly important as race distance increases (Figueiredo et al., 2011; McGibbon et al., 2018). Events such as the 200 m already fall within the middle-distance category, where swimmers must carefully balance intensity and efficiency to sustain speed throughout the race. Based on the lap times (the most common approach to understanding time-based pacing in sport), two pacing strategies were identified in all four events. Specifically, freestyle and backstroke exhibited a reverse J-shaped parabolic pacing, with a fast start followed by an evenly paced mid-section and a fast end-spurt (Mytton et al., 2015). On the other hand, breaststroke and butterfly showed a positive pacing strategy, most likely due to greater changes in speed during each stroke cycle and lower mechanical efficiency than freestyle and backstroke (Robertson et al., 2009).
However, most recent research on race analysis in swimming has suggested that swimmers’ pacing based on lap times may not be representative of their clean swim (Morais et al., 2023b). This occurs because swimmers show not only inter-lap variation, but also intra-lap variation in their stroke kinematics. In other words, swimmers not only change their stroke kinematics between laps but also within the same lap (Escobar et al., 2018; Simbaña-Escobar et al., 2018). This can have an even greater effect in SCM events, as the swimmers perform more turns for the same distance compared to the same event in long course metres. Based on the present outputs, and through visual inspection of Figure 1, it can be seen that the swimming speed decreased significantly throughout the race, indicating low stability. However, this decrease in speed was not significant when comparing consecutive pairs (i.e., every 25 m). Swimmers showed the greatest speeds in the first 25 m (taking advantage of the start), and then speed tended to decrease gradually over the course of the race for all strokes. To the best of our knowledge, studies on this topic have mainly focused on long course metre events, suggesting a decrease in clean swimming speed of around 6–8% from the first to the last lap in 200 m races (Huot-Marchand et al., 2005; Morais et al., 2021; Thompson et al., 2000; Veiga and Roig, 2016). The present results also showed an overall decrease in speed during the clean swim (i.e., during the middle part of the swimming pool), which is consistent with the previous studies on longer pools. At least for the 200 m freestyle event in long course metre, Morais et al., (2021) also found low stability with a decrease in speed over time. Despite this decrease in speed over time, the authors found significant differences between consecutive pairwise comparisons in long course events (Morais et al., 2021). Again, the present study found pairwise differences in the lap time comparison (every 50 m split), but not in the clean swim, which was done every 25 m segment of the race. This reinforces the fact that in SCM events, analysing swimmers’ stability by lap times (50 m splits, which are the official data) can lead to misleading interpretations of their performance. A study by Cuenca-Fernández et al. (2023) recently compared the performance variation of male swimmers between rounds, across all race sections, in 200 m SCM events. Their study did not assess performance within swimmers, but rather performance between rounds (i.e., heats, semi-finals and finals). However, by visually observing the pacing profile of the male swimmers, it is possible to verify very similar results to those obtained in the current study. The official lap time pacing (i.e., every 50 m split) showed a similar curve and profile in each stroke, when assessed every 25 m segment, revealing similar findings to the present research on speed/time curves. This highlights the contradictory results that can be observed when reporting always on the 50 m splits rather than the 25 m segments.
The stability of the other kinematic variables of the stroke (SF, SL and SI) showed the same trend as the clean swim, i.e., an overall low stability, but without significant differences between consecutive pairwise. Although differences between consecutive 25 m segments did not reach statistical significance in pairwise comparisons, stroke mechanics still exhibited progressive variations as fatigue accumulated throughout the race, aligning with previous research on physiological and neuromuscular responses to fatigue (Barbosa et al., 2006, 2008; Figueiredo et al., 2010, 2011). It was observed that SL and SI decreased as the race progressed. On the other hand, SF tended to decrease during the first lap, to be maintained during the second and third laps, and to increase during the last lap (in all strokes). The observed trends in SL and SI may be related to the physiological and biomechanical effects of fatigue, such as higher lactate accumulation (Figueiredo et al., 2011; Wakayoshi et al., 1995) and neuromuscular fatigue (Figueiredo et al., 2010). Furthermore, the strategic adjustments in SF throughout the race indicate a compensatory mechanism used by swimmers to counteract the decrease in force production associated with fatigue, as demonstrated in previous research (Barbosa et al., 2006; Costill et al., 1985; Figueiredo et al., 2011). The tendency to decrease SF in the initial phase may reflect an effort to optimise energy conservation, while maintaining a stable SF in the middle part suggests a strategic balance (Figueiredo et al., 2011). The subsequent increase in SF at the end of the race indicates a conscious effort to compensate for the reduced propulsion, demonstrating swimmers’ adaptive strategies to maintain speed and performance in the face of accumulating fatigue. Similar results regarding the stroke kinematic variables were found by Cuenca-Fernández et al. (2023) in their study, with the males showing similar kinematic profiles to the female finalists in the present study. This approach addresses the limitations identified in previous research (Morais et al., 2023b) by acknowledging that traditional lap-based analyses may not capture the intricacies of swimmers’ stroke mechanics.
Typically, studies have reported that starts and turns should be analysed separately to better understand: (i) the effects of these phases of the race on the final race time (Nicol et al., 2019; Veiga and Roig, 2017) and; (ii) the implementation of the race strategy by each swimmer (Marinho et al., 2020). On the other hand, there is less information on such effects or contributions in SCM events (Born et al., 2021). Concerning total turns, these showed a low stability with significant differences between the first and second turns in all four swim strokes (backstroke also showed differences between the third and fourth turns). The total time spent on turns increased over the course of the race, i.e., turns became slower as the race progressed. It may be inferred that the approach to the turning wall likely contributed to the observed trend in total turn time (i.e., a decrease in performance). This may be related to the decrease in the swimmer's energetic profile during the clean swim at the end of each lap (Pyne and Sharp, 2014). Swimmers significantly increased their 5 m in time during the race. The 5 m in can be considered as the transition from the clean swim phase to the beginning of the turn (Tor et al., 2014). Therefore, during the last 5 m of the pool length (i.e., the turn 5 m in) swimmers may show symptoms of fatigue.
The relative contribution of each phase of the race to the final race time can give an indication of how swimmers might prioritise specific phases during training to maximise performance. Previous research indicates that as race length increases, the relative contribution of the start and turn phases to total performance decreases and increases, respectively (Morais et al., 2019). However, these data are from long course metre events. Evidence in short course metre (SCM) swimming was, until recently, limited to a few studies, such as the 100 m breaststroke (Olstad et al., 2020) and the 200 m breaststroke (Veiga et al., 2013). More recent analyses have expanded this evidence to include all strokes and distances, confirming the predominant influence of turns in SCM performance (Born et al., 2021).
The present findings showed that the start contributed approximately 6% of the total race time across all strokes, a value lower than expected when compared with shorter races such as the 100 m breaststroke, where Olstad et al. (2020) reported 11.39 ± 0.22%. In contrast, the total turn phase accounted for about 52% of overall race time, indicating its dominant influence on SCM performance. This represents more than twice the contribution observed in long course 200 m races, where turns represent roughly 21% of total performance (Slawson et al., 2010). These results are consistent with the findings of Born et al. (2021), who reported similar turn contributions (≈52%) across all strokes in elite SCM swimmers. Interestingly, Veiga et al. (2013) found lower turn contributions (27–34%) in breaststroke, despite hypothesising a value close to 52%, likely due to the lower proficiency level of their sample (national and regional swimmers). Collectively, this evidence reinforces the increased importance of mastering turns in SCM events, highlighting that optimising turn efficiency and consistency may represent a decisive factor for competitive success in short course swimming.
Overall, the analysis used in the current study provides a deeper insight into pacing in SCM events. The official 50 m lap time in SCM events may give a misleading picture of the swimmers’ performance. Therefore, swimmers and coaches should be aware that the official 50 m splits should not be used for pacing analysis. This study exclusively analysed female swimmers, contributing to the limited body of research on short course events in this population. However, the primary finding (the importance of analysing pacing through 25 m segments instead of relying solely on 50 m official times) applies broadly to all swimmers, regardless of sex.
A limitation of this study is that only eight finalists were analysed, which may restrict the generalizability of the findings. Nevertheless, this limitation does not affect the study's primary conclusion that analysing pacing through 25 m segments provides a more accurate and valid assessment of performance stability than traditional 50 m split analyses. Additionally, while this study demonstrates that total turn time increases throughout the race, it is only possible to speculate on the underlying causes. Future research should aim to break down the total turn into sub-phases to gain deeper insight into the factors contributing to this increase. Moreover, further studies should focus on understanding the stability of male swimmers competing in SCM events in all four swim strokes at the same race distance as the present study (200 m). While this study examined female swimmers, applying the same 25 m segmental analysis to male swimmers could provide deeper insights into potential sex-related differences in pacing stability and turn contributions. This approach ensures that all turns are accounted for, preventing the potential misinterpretations associated with traditional 50 m split analyses. Furthermore, this type of analysis could be extended to both shorter and longer SCM events, where the influence of turns on pacing stability may differ due to variations in race demands and energy distribution.
Conclusion
In conclusion, the present study highlights the differences in lap performance, stroke kinematics, and total turns in 200 m SCM events among female finalists. Despite the observed differences in lap times, a deeper analysis revealed a uniform decrease in clean swimming speed across each 25 m segment of the race. This finding emphasises that analysing performance through 25 m splits offers a more accurate representation of pacing stability in SCM events, as it accounts for every turn and swimming segment within the race. Unlike the traditional 50 m split analysis, which overlooks at least one turn per interval, this approach provides a complete assessment of performance, highlighting the decisive influence of turns that account for over 50% of total race time. From a practical standpoint, these results highlight the need for swimmers and coaches to integrate 25 m pacing assessments into race analysis and to prioritise turn efficiency and underwater transitions in training. By refining race strategies with these factors in mind, athletes can enhance performance consistency and optimise outcomes in short-course competitions.
Footnotes
Acknowledgments
This work is funded by national funds from FCT – Fundação para a Ciência e a Tecnologia, I.P., under the project/support UID/6157/2025 and UID/04045/2025.
ORCID iDs
Funding
Declaration of conflicting interests
The authors declared no potential conflicts of interest with respect to the research, authorship, and/or publication of this article.